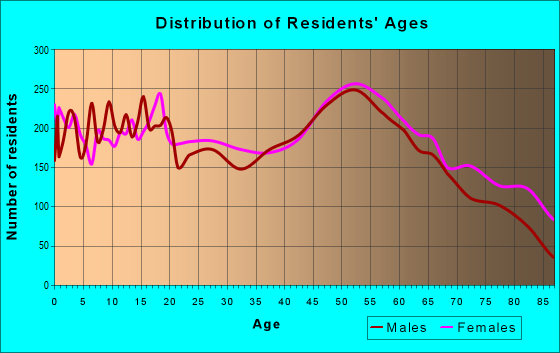
Estimated zip code population in 2022: 28,954 Zip code population in 2010: 31,651 Zip code population in 2000: 32,632
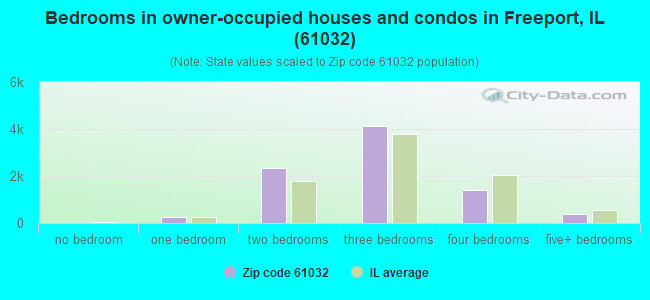
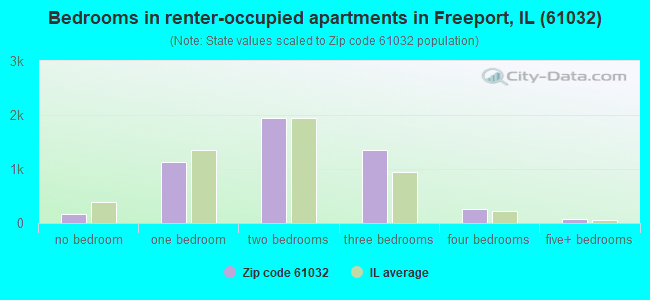
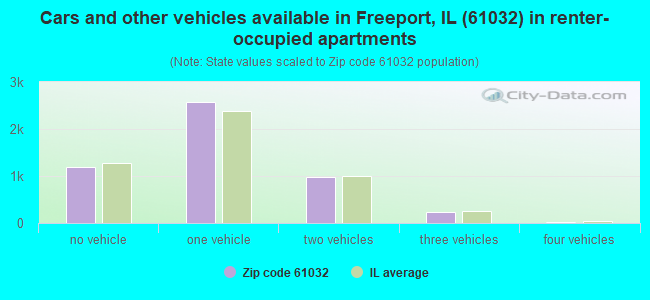
Houses and condos: 14,581 Renter-occupied apartments: 4,970
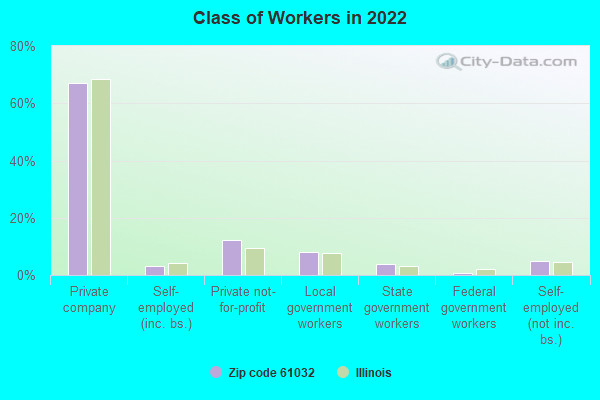
% of renters here:
37%
State:
33%
March 2022 cost of living index in zip code 61032: 75.0 (low, U.S. average is 100)
Land area: 148.0 sq. mi. Water area: 0.2 sq. mi.
Population density: 196 people per square mile
(very low).
OSM Map
General Map
Google Map
MSN Map
OSM Map
General Map
Google Map
MSN Map
OSM Map
General Map
Google Map
MSN Map
OSM Map
General Map
Google Map
MSN Map
Please wait while loading the map...
Real estate property taxes paid for housing units in 2022:
This zip code:
2.5% ($2,541)
Illinois:
2.0% ($4,912)
Median real estate property taxes paid for housing units with mortgages in 2022: $2,699 (2.4%) Median real estate property taxes paid for housing units with no mortgage in 2022: $2,351 (2.5%)
Averages for the 2020 tax year for zip code 61032, filed in 2021:
Average Adjusted Gross Income (AGI) in 2020: $50,978 (Individual Income Tax Returns)
Here:
$50,978
State:
$82,626
Salary/wage: $42,291 (reported on 77.5% of returns)
Here:
$42,291
State:
$66,640
(% of AGI for various income ranges: 1099.6% for AGIs below $25k, 3351.7% for AGIs $25k-50k, 5730.6% for AGIs $50k-75k, 8210.5% for AGIs $75k-100k, 14878.3% for AGIs $100k-200k, 81680.0% for AGIs over 200k)
Taxable interest for individuals: $1,650 (reported on 30.3% of returns)
This zip code:
$1,650
Illinois:
$2,376
(% of AGI for various income ranges: 24.2% for AGIs below $25k, 28.1% for AGIs $25k-50k, 90.7% for AGIs $50k-75k, 109.7% for AGIs $75k-100k, 219.5% for AGIs $100k-200k, 2051.4% for AGIs over 200k)
Ordinary dividends: $5,528 (reported on 17.7% of returns)
Here:
$5,528
State:
$9,061
(% of AGI for various income ranges: 28.7% for AGIs below $25k, 40.8% for AGIs $25k-50k, 121.2% for AGIs $50k-75k, 191.0% for AGIs $75k-100k, 507.0% for AGIs $100k-200k, 6224.3% for AGIs over 200k)
Net capital gain/loss in AGI: +$9,069 (reported on 14.7% of returns)
Here:
+$9,069
State:
+$31,684
(% of AGI for various income ranges: 4.9% for AGIs below $25k, 19.5% for AGIs $25k-50k, 89.5% for AGIs $50k-75k, 183.8% for AGIs $75k-100k, 667.8% for AGIs $100k-200k, 14567.1% for AGIs over 200k)
Profit/loss from business: +$10,035 (reported on 11.3% of returns)
Here:
+$10,035
State:
+$12,175
(% of AGI for various income ranges: 83.3% for AGIs below $25k, 80.0% for AGIs $25k-50k, 97.3% for AGIs $50k-75k, 211.2% for AGIs $75k-100k, 421.3% for AGIs $100k-200k, 5492.9% for AGIs over 200k)
Taxable individual retirement arrangement distribution: $14,213 (reported on 12.5% of returns)
61032:
$14,213
Illinois:
$21,613
(% of AGI for various income ranges: 66.6% for AGIs below $25k, 121.9% for AGIs $25k-50k, 323.4% for AGIs $50k-75k, 455.2% for AGIs $75k-100k, 1000.9% for AGIs $100k-200k, 4315.7% for AGIs over 200k)
Self-employed (Keogh) retirement plans: $21,400 (reported on 0.3% of returns)
61032:
$21,400
Illinois:
$30,962
(% of AGI for various income ranges: 111.2% for AGIs $100k-200k)
Total itemized deductions: $33,388 (reported on 3.5% of returns)
Here:
$33,388
State:
$34,948
(% of AGI for various income ranges: 44.5% for AGIs below $25k, 75.3% for AGIs $25k-50k, 219.7% for AGIs $50k-75k, 211.8% for AGIs $75k-100k, 511.6% for AGIs $100k-200k, 5197.1% for AGIs over 200k)
Charity contributions: $12,134 (reported on 2.5% of returns)
Here:
$12,134
State:
$13,122
(% of AGI for various income ranges: 2.7% for AGIs below $25k, 5.2% for AGIs $25k-50k, 23.1% for AGIs $50k-75k, 44.2% for AGIs $75k-100k, 203.4% for AGIs $100k-200k, 2511.4% for AGIs over 200k)
Taxes paid: $6,527 (reported on 3.5% of returns)
61032:
$6,527
State:
$8,563
(% of AGI for various income ranges: 4.5% for AGIs below $25k, 10.8% for AGIs $25k-50k, 36.3% for AGIs $50k-75k, 54.0% for AGIs $75k-100k, 131.0% for AGIs $100k-200k, 1085.7% for AGIs over 200k)
Earned income credit: $2,411 (reported on 20.3% of returns)
Here:
$2,411
State:
$2,311
(% of AGI for various income ranges: 112.2% for AGIs below $25k, 72.5% for AGIs $25k-50k, 1.9% for AGIs $50k-75k)
Percentage of individuals using paid preparers for their 2020 taxes: 94.5%
Here:
95%
State:
93%
(% for various income ranges: 93.7% for AGIs below $25k, 95.2% for AGIs $25k-50k, 94.6% for AGIs $50k-75k, 96.5% for AGIs $75k-100k, 94.8% for AGIs $100k-200k, 93.1% for AGIs over 200k)
Averages for the 2012 tax year for zip code 61032, filed in 2013:
Average Adjusted Gross Income (AGI) in 2012: $44,439 (Individual Income Tax Returns)
Here:
$44,439
State:
$68,058
Salary/wage: $37,543 (reported on 80.3% of returns)
Here:
$37,543
State:
$55,396
(% of AGI for various income ranges: 69.2% for AGIs below $25k, 73.3% for AGIs $25k-50k, 70.8% for AGIs $50k-75k, 69.4% for AGIs $75k-100k, 68.5% for AGIs $100k-200k, 50.5% for AGIs over 200k)
Taxable interest for individuals: $1,671 (reported on 35.9% of returns)
This zip code:
$1,671
Illinois:
$1,969
(% of AGI for various income ranges: 1.9% for AGIs below $25k, 1.2% for AGIs $25k-50k, 1.1% for AGIs $50k-75k, 1.2% for AGIs $75k-100k, 1.2% for AGIs $100k-200k, 1.9% for AGIs over 200k)
Ordinary dividends: $5,086 (reported on 20.9% of returns)
Here:
$5,086
State:
$7,786
(% of AGI for various income ranges: 1.6% for AGIs below $25k, 1.3% for AGIs $25k-50k, 1.5% for AGIs $50k-75k, 1.7% for AGIs $75k-100k, 2.6% for AGIs $100k-200k, 6.6% for AGIs over 200k)
Net capital gain/loss in AGI: +$5,255 (reported on 15.3% of returns)
Here:
+$5,255
State:
+$22,183
(% of AGI for various income ranges: 0.3% for AGIs $25k-50k, 0.4% for AGIs $50k-75k, 0.9% for AGIs $75k-100k, 2.5% for AGIs $100k-200k, 8.1% for AGIs over 200k)
Profit/loss from business: +$9,172 (reported on 13.1% of returns)
Here:
+$9,172
State:
+$12,903
(% of AGI for various income ranges: 6.2% for AGIs below $25k, 1.7% for AGIs $25k-50k, 1.4% for AGIs $50k-75k, 2.1% for AGIs $75k-100k, 2.7% for AGIs $100k-200k, 3.4% for AGIs over 200k)
Taxable individual retirement arrangement distribution: $10,556 (reported on 14.5% of returns)
61032:
$10,556
Illinois:
$17,929
(% of AGI for various income ranges: 3.7% for AGIs below $25k, 3.7% for AGIs $25k-50k, 3.1% for AGIs $50k-75k, 2.9% for AGIs $75k-100k, 3.8% for AGIs $100k-200k, 3.1% for AGIs over 200k)
Self-employment retirement plans: $17,750 (reported on 0.4% of returns)
61032:
$17,750
Illinois:
$24,666
Total itemized deductions: $19,759 (22% of AGI, reported on 23.1% of returns)
Here:
$19,759
State:
$26,433
Here:
21.6% of AGI
State:
19.2% of AGI
(% of AGI for various income ranges: 7.6% for AGIs below $25k, 8.5% for AGIs $25k-50k, 10.1% for AGIs $50k-75k, 10.1% for AGIs $75k-100k, 13.0% for AGIs $100k-200k, 11.7% for AGIs over 200k)
Charity contributions: $3,935 (reported on 18.8% of returns)
Here:
$3,935
State:
$4,525
(% of AGI for various income ranges: 0.7% for AGIs below $25k, 1.1% for AGIs $25k-50k, 1.3% for AGIs $50k-75k, 1.6% for AGIs $75k-100k, 2.4% for AGIs $100k-200k, 3.0% for AGIs over 200k)
Taxes paid: $7,833 (reported on 23.1% of returns)
61032:
$7,833
State:
$11,968
(% of AGI for various income ranges: 1.4% for AGIs below $25k, 2.4% for AGIs $25k-50k, 3.5% for AGIs $50k-75k, 4.2% for AGIs $75k-100k, 6.1% for AGIs $100k-200k, 6.6% for AGIs over 200k)
Earned income credit: $2,441 (reported on 22.0% of returns)
Here:
$2,441
State:
$2,349
(% of AGI for various income ranges: 7.9% for AGIs below $25k, 1.0% for AGIs $25k-50k)
Percentage of individuals using paid preparers for their 2012 taxes: 55.8%
Here:
56%
State:
57%
(% for various income ranges: 48.5% for AGIs below $25k, 57.1% for AGIs $25k-50k, 64.7% for AGIs $50k-75k, 66.1% for AGIs $75k-100k, 64.2% for AGIs $100k-200k, 85.7% for AGIs over 200k)
Averages for the 2004 tax year for zip code 61032, filed in 2005:
Average Adjusted Gross Income (AGI) in 2004: $38,110 (Individual Income Tax Returns)
Here:
$38,110
State:
$54,625
Salary/wage: $34,077 (reported on 82.3% of returns)
Here:
$34,077
State:
$46,811
(% of AGI for various income ranges: 116.2% for AGIs below $10k, 69.0% for AGIs $10k-25k, 76.5% for AGIs $25k-50k, 76.4% for AGIs $50k-75k, 80.1% for AGIs $75k-100k, 63.1% for AGIs over 100k)
Taxable interest for individuals: $2,061 (reported on 47.2% of returns)
This zip code:
$2,061
Illinois:
$2,101
(% of AGI for various income ranges: 9.1% for AGIs below $10k, 4.1% for AGIs $10k-25k, 2.4% for AGIs $25k-50k, 2.0% for AGIs $50k-75k, 1.5% for AGIs $75k-100k, 2.6% for AGIs over 100k)
Taxable dividends: $3,187 (reported on 26.2% of returns)
Here:
$3,187
State:
$4,306
(% of AGI for various income ranges: 4.1% for AGIs below $10k, 1.8% for AGIs $10k-25k, 1.4% for AGIs $25k-50k, 1.4% for AGIs $50k-75k, 1.5% for AGIs $75k-100k, 4.0% for AGIs over 100k)
Net capital gain/loss: +$4,823 (reported on 19.4% of returns)
Here:
+$4,823
State:
+$17,321
(% of AGI for various income ranges: -1.0% for AGIs below $10k, 0.3% for AGIs $10k-25k, 0.8% for AGIs $25k-50k, 1.3% for AGIs $50k-75k, 1.8% for AGIs $75k-100k, 6.6% for AGIs over 100k)
Profit/loss from business: +$7,550 (reported on 13.1% of returns)
Here:
+$7,550
State:
+$11,771
(% of AGI for various income ranges: 2.0% for AGIs below $10k, 3.0% for AGIs $10k-25k, 1.5% for AGIs $25k-50k, 1.8% for AGIs $50k-75k, 1.5% for AGIs $75k-100k, 4.9% for AGIs over 100k)
IRA payment deduction: $3,074 (reported on 2.9% of returns)
61032:
$3,074
Illinois:
$3,087
(% of AGI for various income ranges: 0.2% for AGIs below $10k, 0.2% for AGIs $10k-25k, 0.4% for AGIs $25k-50k, 0.3% for AGIs $50k-75k, 0.1% for AGIs $75k-100k, 0.1% for AGIs over 100k)
Self-employed pension: $10,975 (reported on 0.5% of returns)
Here:
$10,975
Illinois:
$16,965
(% of AGI for various income ranges: 0.1% for AGIs $50k-75k, 0.1% for AGIs $75k-100k, 0.4% for AGIs over 100k)
Total itemized deductions: $16,163 (22% of AGI, reported on 25.6% of returns)
Here:
$16,163
State:
$20,239
Here:
21.8% of AGI
State:
19.5% of AGI
(% of AGI for various income ranges: 19.3% for AGIs below $10k, 9.4% for AGIs $10k-25k, 9.7% for AGIs $25k-50k, 10.3% for AGIs $50k-75k, 11.7% for AGIs $75k-100k, 11.9% for AGIs over 100k)
Charity contributions deductions: $3,446 (4% of AGI, reported on 22.5% of returns)
Here:
$3,446
State:
$3,719
Here:
4.4% of AGI
State:
3.4% of AGI
(% of AGI for various income ranges: 1.1% for AGIs below $10k, 1.1% for AGIs $10k-25k, 1.4% for AGIs $25k-50k, 1.7% for AGIs $50k-75k, 2.1% for AGIs $75k-100k, 3.3% for AGIs over 100k)
Total tax: $5,379 (reported on 71.1% of returns)
61032:
$5,379
State:
$9,882
(% of AGI for various income ranges: 2.6% for AGIs below $10k, 3.6% for AGIs $10k-25k, 6.7% for AGIs $25k-50k, 8.8% for AGIs $50k-75k, 10.3% for AGIs $75k-100k, 17.5% for AGIs over 100k)
Earned income credit: $1,682 (reported on 17.9% of returns)
Here:
$1,682
State:
$1,788
Percentage of individuals using paid preparers for their 2004 taxes: 61.5%
Here:
61%
State:
61%
(% for various income ranges: 54.6% for AGIs below $10k, 62.6% for AGIs $10k-25k, 64.0% for AGIs $25k-50k, 64.5% for AGIs $50k-75k, 60.5% for AGIs $75k-100k, 67.0% for AGIs over 100k)
Likely homosexual households (counted as self-reported same-sex unmarried-partner households)
Lesbian couples: 0.1% of all households
Gay men: 0.0% of all households
Household received Food Stamps/SNAP in the past 12 months: 3,546 Household did not receive Food Stamps/SNAP in the past 12 months: 10,154
Women who had a birth in the past 12 months: 437 (242 now married, 195 unmarried) Women who did not have a birth in the past 12 months: 4,991 (2,045 now married, 2,943 unmarried)
Housing units in zip code 61032 with a mortgage: 4,074 (350 second mortgage, 6 home equity loan, 285 both second mortgage and home equity loan) Houses without a mortgage: 105
Median monthly owner costs for units with a mortgage: $1,086 Median monthly owner costs for units without a mortgage: $545
Residents with income below the poverty level in 2022:
This zip code:
16.9%
Whole state:
11.9%
Residents with income below 50% of the poverty level in 2022:
This zip code:
10.1%
Whole state:
5.7%
Median number of rooms in houses and condos:
Here:
6.2
State:
6.4
Median number of rooms in apartments:
Here:
4.7
State:
4.1
Notable locations in this zip code not listed on our city pages
Notable locations in zip code 61032: Freeport Country Club (A), Freeport Raceway (B), Graybill Farm (C), Park Hills Golf Course (D), Wallace Yards (E), Williams Farm (F), Freeport Fire Department Station 2 (G), Freeport City Hall (H), Freeport Public Library (I), Stephenson County Courthouse (J), Star Ambulance (K), Freeport Fire Department Station 1 (L), Freeport Rural Fire Protection District Station 3 (M), Freeport Rural Fire Protection District Ambulance Service (N), Freeport Fire Department Station 3 (O), Cedarville Fire Protection District (P), Saint Vincent Childrens Home (Q), Freeport Rural Fire Protection District Station 2 Headquarters (R), Freeport Rural Fire Protection District Station 1 (S), Saint Josephs Home for the Aged (T). Display/hide their locations on the map
Shopping Centers: West Avenue Shopping Center (1), Bavarian Village Shopping Center (2), Crestwood Shopping Center (3), Lincoln Shopping Center (4), Meadows Shopping Center (5), Park Plaza Shopping Center (6), Southwest Plaza Shopping Center (7). Display/hide their locations on the map
Churches in zip code 61032 include: Open Bible Church (A), Kingdom Hall (B), Van Brocklin Church (C), Pleasant View Church (D), Prince of Peace Lutheran Church (E), Richland Church (F), Richland Salem Church (G), Bethany United Church of Christ (H), Bethel Baptist Church (I). Display/hide their locations on the map
Cemeteries: Ellis Van Brocklin Cemetery (1), Bellview Cemetery (2), Zion Cemetery (3), Liebhart Cemetery (4), Martin Cemetery (5), Oakland Freeport Cemetery (6), Richland Cemetery (7). Display/hide their locations on the map
Creeks: Coon Creek (A), Silver Creek (B), Cedar Creek (C), Brush Creek (D), Richland Creek (E), Waddams Creek (F), Yellow Creek (G), Crane Grove Creek (H), Preston Creek (I). Display/hide their locations on the map
Parks in zip code 61032 include: Stephenson County Fairgrounds (1), Taylor Park (2), Third Ward Park (3), Read Park (4), Freeport Prairie Nature Preserve (5), Wirth Prairie Nature Preserve (6), Bidwell Park (7), Wayside Park (8), Krape Park (9). Display/hide their locations on the map
In group quarters: 663 (-1 institutionalized population)
Size of family households: 4,181 2-persons, 1,753 3-persons, 1,129 4-persons, 414 5-persons, 127 6-persons, 120 7-or-more-persons
Size of nonfamily households: 4,930 1-person, 846 2-persons, 55 3-persons
2,829 married couples with children.
2,091 single-parent households (317 men, 1,774 women).
95.9% of residents of 61032 zip code speak English at home.
2.7% of residents speak Spanish at home (77% very well, 9% well, 5% not well, 9% not at all).
0.6% of residents speak other Indo-European language at home (96% very well, 4% not at all).
0.9% of residents speak Asian or Pacific Island language at home (56% very well, 35% well, 9% not well).
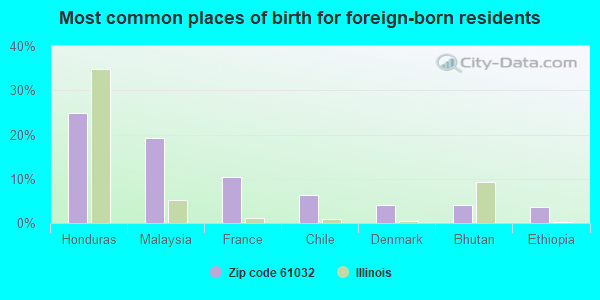
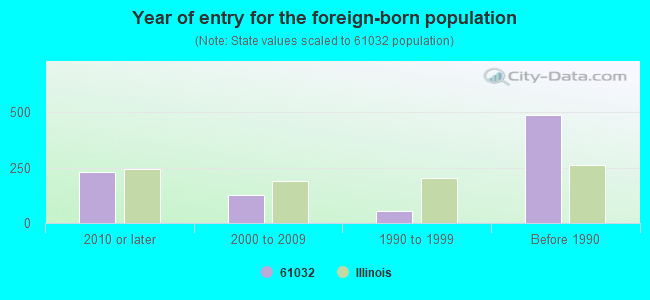
Foreign born population: 795 (2.7%) (55.9% of them are naturalized citizens)
Major facilities with environmental interests located in this zip code:
CONMAT INC (1708 S HOLLYWOOD RD in FREEPORT, IL)
STATE MASTER (Illinois EPA Project) - AIR PROGRAM AIR MINOR (AIRS/AFS) AIR SYNTHETIC MINOR (AIRS/AFS) CRITERIA AND HAZARDOUS AIR POLLUTANT INVENTORY (Inventory of air pollution sources) Business SIC classification: CRUSHED AND BROKEN LIMESTONE; ASPHALT PAVING MIXTURES AND BLOCKS
NORTHERN HILLS UTILITY STP (1438 WEST FAIRVIEW ROAD in FREEPORT, IL)
STATE MASTER (Illinois EPA Project) - National Pollutant Discharge Elimination System Permit ENFORCEMENT/COMPLIANCE ACTIVITY (Integrated Compliance Information System) - ICIS-05-2004-2000, FORMAL ENFORCEMENT ACTION (Integrated Compliance Information System) - ICIS-05-2004-2000, FORMAL ENFORCEMENT ACTION National Pollutant Discharge Elimination System NON-MAJOR (Tracking pollutant discharge elimination systems) - permit National Pollutant Discharge Elimination System NON-MAJOR (Tracking pollutant discharge elimination systems) - permit Business SIC classification: SEWERAGE SYSTEMS Alternative names: NORTHERN HILLS WATER AND SEWER COMPANY
HONEYWELL'S MICRO SWITCH DIVISION PLANT 1 (323 EAST STEPHENSON STREET in FREEPORT, IL)
STATE MASTER (Illinois EPA Project) - SOLID WASTE PROGRAM, HAZARDOUS WASTE PROGRAM, AIR PROGRAM AIR MINOR (AIRS/AFS) CRITERIA AND HAZARDOUS AIR POLLUTANT INVENTORY (Inventory of air pollution sources) National Pollutant Discharge Elimination System NON-MAJOR (Tracking pollutant discharge elimination systems) - permit HAZARDOUS WASTE BIENNIAL REPORTER (Resource Conservation and Recovery Act (tracking hazardous waste)) Large Quantity Generators, more that 1000 kg of hazardous waste/month (Resource Conservation and Recovery Act (tracking hazardous waste)) - notification TRI REPORTER (Tracking of toxic chemicals releasing facilities) Business SIC classification: ELECTRONIC COMPONENTS Business NAICS classification: OTHER ELECTRONIC COMPONENT MANUFACTURING.; SWITCHGEAR AND SWITCHBOARD APPARATUS MANUFACTURING. Organizations: HONEYWELL INTERNATIONAL INC. (CONTACT/OPERATOR)
, MICRO SWITCH A HONEYWELL DIV. (CONTACT/OWNER)
Alternative names: HONEYWELL INC., MICRO SWITCH DIV., HONEYWELL INC., MICRO SWITCH DIV., PLANT 1, HONEYWELL INT INC PLANT 1, HONEYWELL INTERNATIONAL INC-PLANT 1, HONEYWELL INTL. INC., HONEYWELL INTL. INC. PLANT 1, MICRO SWITCH A HONEYWELL DIV.
MODERN PLATING CORPORATION (701 S. HANCOCK AVE. in FREEPORT, IL)
AIR MINOR (AIRS/AFS) (Integrated Compliance Information System) - ICIS-05-1986-0267, FORMAL ENFORCEMENT ACTION CRITERIA AND HAZARDOUS AIR POLLUTANT INVENTORY (Inventory of air pollution sources) HAZARDOUS WASTE BIENNIAL REPORTER (Resource Conservation and Recovery Act (tracking hazardous waste)) Large Quantity Generators, more that 1000 kg of hazardous waste/month (Resource Conservation and Recovery Act (tracking hazardous waste)) TSD (Resource Conservation and Recovery Act (tracking hazardous waste)) - notification TRI REPORTER (Tracking of toxic chemicals releasing facilities) Business SIC and NAICS classification: ELECTROPLATING, PLATING, POLISHING, ANODIZING, AND COLORING
CIVIL CONSTRUCTORS INC (RR 1 in FREEPORT, IL)
STATE MASTER (Illinois EPA Project) - AIR PROGRAM AIR MINOR (AIRS/AFS) CRITERIA AND HAZARDOUS AIR POLLUTANT INVENTORY (Inventory of air pollution sources) National Pollutant Discharge Elimination System NON-MAJOR (Tracking pollutant discharge elimination systems) - permit National Pollutant Discharge Elimination System NON-MAJOR (Tracking pollutant discharge elimination systems) - permit Business SIC classification: ASPHALT PAVING MIXTURES AND BLOCKS Business NAICS classification: ASPHALT PAVING MIXTURE AND BLOCK MANUFACTURING.
MICRO SWITCH RAWLEIGH BLDG (223 E MAIN ST in FREEPORT, IL)
AIR MINOR (AIRS/AFS) SUPERFUND (Superfund database) (Integrated Compliance Information System) - ICIS-05-1985-0211, FORMAL ENFORCEMENT ACTION COMPLIANCE ACTIVITY (Tracking inspections of insecticide, fungicide, and rodenticide, and toxic substances) (Resource Conservation and Recovery Act (tracking hazardous waste)) Business SIC classification: PHARMACEUTICAL PREPARATIONS; SPECIALTY CLEANING, POLISHING, AND SANITATION PREPARATIONS; SURFACE ACTIVE AGENTS, FINISHING AGENTS, SULFONATED OILS, AND ASSISTANTS; SWITCHGEAR AND SWITCHBOARD APPARATUS Organizations: HONEYWELL INC (CONTACT/OWNER)
Alternative names: MICROSWITCH DIV OF HONEYWELL, RALEIGH BUILDING, RAWLEIGH BUILDING, W T RAWLEIGH COMPANY
ANCHOR HARVEY COMPONENTS (600 WEST LAMM ROAD in FREEPORT, IL)
STATE MASTER (Illinois EPA Project) - SOLID WASTE PROGRAM, HAZARDOUS WASTE PROGRAM, AIR PROGRAM AIR MINOR (AIRS/AFS) COMPLIANCE ACTIVITY (Tracking inspections of insecticide, fungicide, and rodenticide, and toxic substances) CRITERIA AND HAZARDOUS AIR POLLUTANT INVENTORY (Inventory of air pollution sources) (Resource Conservation and Recovery Act (tracking hazardous waste)) TRI REPORTER (Tracking of toxic chemicals releasing facilities) Business SIC classification: NONFERROUS FORGINGS Organizations: CHICAGO EXTRUDED METALS (CONTACT/OWNER)
Alternative names: ANCHOR-HARVEY COMPONENTS L.L.C., ANCHOR-HARVEY COMPONENTS LLC
AFS BIOAFFINITY (316 JACKSON ST in FREEPORT, IL)
STATE MASTER (Illinois EPA Project) - AIR PROGRAM STATE MASTER (Illinois EPA Project) - HAZARDOUS WASTE PROGRAM AIR MINOR (AIRS/AFS) CRITERIA AND HAZARDOUS AIR POLLUTANT INVENTORY (Inventory of air pollution sources) Business SIC classification: DRUGS, DRUG PROPRIETARIES, AND DRUGGISTS' SUNDRIES Alternative names: RAWLEIGH CORRIDOR PROPERTY, RAWLEIGH CORRIDOR PROPERTY-316 E. JACKSON ST.
CITY OF FREEPORT (230 WEST STEPHENSON STREET in FREEPORT, IL)
STATE MASTER (Illinois EPA Project) - National Pollutant Discharge Elimination System Permit (Integrated Compliance Information System) - ICIS-05-1996-0629, FORMAL ENFORCEMENT ACTION National Pollutant Discharge Elimination System NON-MAJOR (Tracking pollutant discharge elimination systems) - permit Organizations: FREEPORT?CITY OF (CONTACT/OWNER)
Alternative names: FREEPORT MUNICIPAL LANDFILL 4
NEWELL COMPANIES (916 SOUTH ARCADE AVENUE in FREEPORT, IL)
STATE MASTER (Illinois EPA Project) - SOLID WASTE PROGRAM, HAZARDOUS WASTE PROGRAM, AIR PROGRAM AIR MINOR (AIRS/AFS) CRITERIA AND HAZARDOUS AIR POLLUTANT INVENTORY (Inventory of air pollution sources) Small Quantity Generators, between 100 kg and 1000 kg of hazardous waste/month (Resource Conservation and Recovery Act (tracking hazardous waste)) - notification TRI REPORTER (Tracking of toxic chemicals releasing facilities) Business SIC classification: DRAPERY HARDWARE AND WINDOW BLINDS AND SHADES Business NAICS classification: BLIND AND SHADE MANUFACTURING. Organizations: NEWELL WINDOW FURNISHINGS INC (CONTACT/OWNER)
Alternative names: LEVELOR KIRSCH, NEWELL WINDOW FURNISHINGS
COMMONWEALTH EDISON CO-FREEPORT (2900 RTE. 20 W in FREEPORT, IL)
STATE MASTER (Illinois EPA Project) - SOLID WASTE PROGRAM, HAZARDOUS WASTE PROGRAM, SCRAP TIRE MANAGEMENT, AIR PROGRAM AIR MINOR (AIRS/AFS) CRITERIA AND HAZARDOUS AIR POLLUTANT INVENTORY (Inventory of air pollution sources) (Resource Conservation and Recovery Act (tracking hazardous waste)) Business SIC classification: ELECTRIC SERVICES Alternative names: COM ED FREEPORT, COMMONWEALTH EDISON FREEPORT DIST HDQ
CITY OF FREEPORT (706 N BRICK in FREEPORT, IL)
STATE MASTER (Illinois EPA Project) - AIR PROGRAM AIR MINOR (AIRS/AFS) CRITERIA AND HAZARDOUS AIR POLLUTANT INVENTORY (Inventory of air pollution sources) Business SIC classification: GENERAL GOVERNMENT
NICOR GAS (216 S. LIBERTY in FREEPORT, IL)
STATE MASTER (Illinois EPA Project) - SOLID WASTE PROGRAM, HAZARDOUS WASTE PROGRAM, AIR PROGRAM AIR MINOR (AIRS/AFS) CRITERIA AND HAZARDOUS AIR POLLUTANT INVENTORY (Inventory of air pollution sources) Conditionally Exempt Small Quantity Generators, less than 100 kg/month of hazardous waste (Resource Conservation and Recovery Act (tracking hazardous waste)) Business SIC and NAICS classification: NATURAL GAS DISTRIBUTION Alternative names: RAWLEIGH CORRIDOR PROPERTY, RAWLEIGH CORRIDOR PROPERTY-216 S. LIBERTY AVE
Housing units lacking complete plumbing facilities: 2.2% Housing units lacking complete kitchen facilities: 1.9%
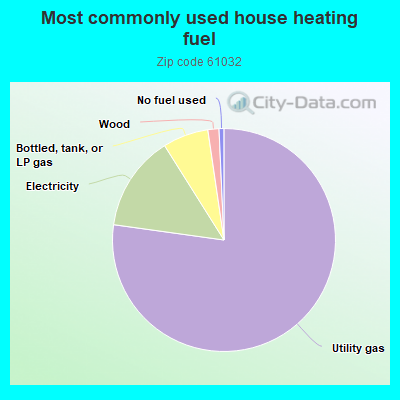
76.9%Utility gas
13.8%Electricity
6.6%Bottled, tank, or LP gas
1.6%Wood
0.7%No fuel used
Population in 1990: 33,259.
Place of birth for U.S.-born residents:
This state: 21,118
Northeast: 517
Midwest: 4,438
South: 1,163
West: 776
57% of the 61032 zip code residents lived in the same house 5 years ago. Out of people who lived in different houses, 64% lived in this county. Out of people who lived in different counties, 50% lived in Illinois.
91% of the 61032 zip code residents lived in the same house 1 year ago. Out of people who lived in different houses, 69% moved from this county. Out of people who lived in different houses, 21% moved from different county within same state. Out of people who lived in different houses, 6% moved from different state. Out of people who lived in different houses, 2% moved from abroad.
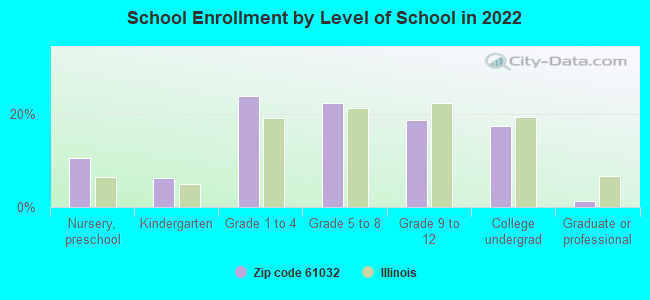
Private vs. public school enrollment:
Students in private schools in grades 1 to 8 (elementary and middle school): 528
Here:
22.1%
Illinois:
13.3%
Students in private schools in grades 9 to 12 (high school): 179
Here:
18.7%
Illinois:
9.9%
Students in private undergraduate colleges: 134
Here:
14.9%
Illinois:
27.4%
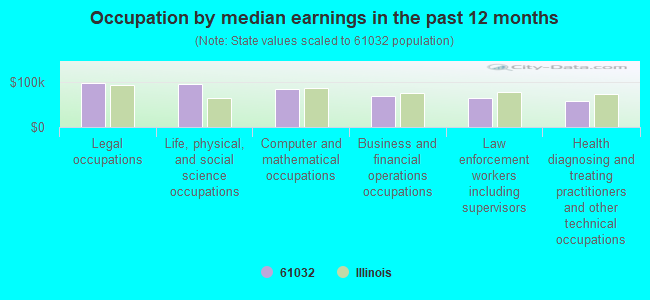
Occupation by median earnings in the past 12 months ($)
98,045Legal occupations
96,689Life, physical, and social science occupations
85,104Computer and mathematical occupations
68,660Business and financial operations occupations
63,868Law enforcement workers including supervisors
58,770Health diagnosing and treating practitioners and other technical occupations
Companies with federal contracts located in this zip code:
HONEYWELL INTERNATIONAL INC (11 W SPRING ST in FREEPORT, IL) : $5,480,226 in 109 contractsfrom 1999 to 2006
Contracts for Switches, Miscellaneous Items, Miscellaneous Printed Matter, Miscellaneous Electrical and Electronic Components, and moreby Defense Logistics Agency, Navy, Army, NASA, and others Signed by year:2000: $1,262,190; 2001: $193,644; 2002: $711,922; 2003: $121,710; 2004: $1,883,835; 2005: $629,124; 2006: $441,004.
Biggest contracts:
$341,550 with Defense Logistics Agency for Switches. Signed on 2000-12-21. Completion date: 2002-01-25.
$299,500, same as above.Signed on 2000-01-21. Completion date: 2001-01-15.
$248,630, same as above.Signed on 2004-01-21. Completion date: 2004-08-23.
$216,041, same as above.Signed on 2004-11-04. Completion date: 2005-10-30.
CIVIL CONSTRUCTORS, INC OF ILL (US HIGHWAY 20 E in FREEPORT, IL) : $101,000 in 2 contractsin 2001
$92,000 with U.S. Fish and Wildlife Service for Maintenance, Repair or Alteration of Real Property -- Highways, Roads, Streets, Bridges, and Railways (includes resurfacing). Signed on 2001-09-15. Completion date: 2001-12-15.
$9,000, same as above.Signed on 2001-09-15. Completion date: 2001-12-15.
AP HOTELS OF ILLINOIS, INC (1060 RIVERSIDE DR in FREEPORT, IL; small business) : $11,201 in 7 contractsfrom 2005 to 2006
Contracts for Lodging - Hotel/Motel by Army Signed by year:2000: $0; 2001: $0; 2002: $0; 2003: $0; 2004: $0; 2005: $3,407; 2006: $7,794.
Biggest contracts:
$2,021 with Army for Lodging - Hotel/Motel. Signed on 2005-12-01. Completion date: 2005-11-06.
$2,019, same as above.Signed on 2006-03-05. Completion date: 2005-12-10.
$1,906, same as above.Signed on 2006-03-05. Completion date: 2006-02-11.
$1,848, same as above.Signed on 2006-01-31. Completion date: 2006-01-08.
LEVOLOR KIRSCH WINDOW FASHIONS (1750 Lincoln Drive in Freeport, IL)
$5,245 with Department of State for Miscellaneous Furniture and Fixtures. Signed on 2005-01-07. Completion date: 2005-10-31.
Top industries in this zip code by the number of employees in 2005:
Health Care and Social Assistance: General Medical and Surgical Hospitals (over 1000 employees: 1 establishment)
Finance and Insurance: Direct Life Insurance Carriers (250-499: 1)
People in group quarters in 2010:
468 people in nursing facilities/skilled-nursing facilities
108 people in local jails and other municipal confinement facilities
58 people in other noninstitutional facilities
49 people in group homes intended for adults
21 people in residential treatment centers for juveniles (non-correctional)
19 people in residential treatment centers for adults
16 people in group homes for juveniles (non-correctional)
15 people in emergency and transitional shelters (with sleeping facilities) for people experiencing homelessness
People in group quarters in 2000:
460 people in nursing homes
107 people in other noninstitutional group quarters
88 people in local jails and other confinement facilities (including police lockups)
49 people in homes for the mentally retarded
14 people in homes or halfway houses for drug/alcohol abuse
10 people in homes for the mentally ill
2 people in religious group quarters
Fatal accident statistics in 2014:
Fatal accident count: 2
Vehicles involved in fatal accidents: 4
Fatal accidents caused by drunken drivers: 1
Fatalities: 2
Persons involved in fatal accidents: 6
Pedestrians involved in fatal accidents: 0
Fatal accident statistics in 2013:
Fatal accident count: 1
Vehicles involved in fatal accidents: 2
Fatal accidents caused by drunken drivers: 0
Fatalities: 2
Persons involved in fatal accidents: 3
Pedestrians involved in fatal accidents: 0
2002 - 2018 National Fire Incident Reporting System (NFIRS) incidents
According to the data from the years 2002 - 2018 the average number of fires per year is 119. The highest number of reported fire incidents - 180 took place in 2009, and the least - 23 in 2003. The data has an increasing trend.
When looking into fire subcategories, the most incidents belonged to: Outside Fires (43.3%), and Structure Fires (37.3%).
Fire incident types reported to NFIRS in Zip Code 61032
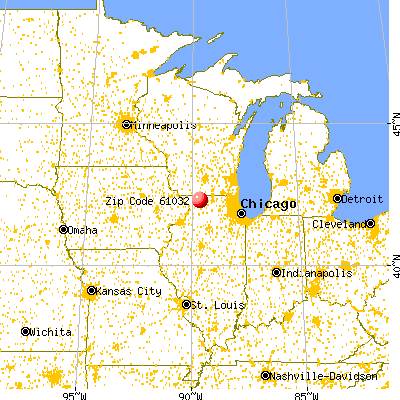


 Nearest zip codes: 61013, 61027, 61018, 61007, 61050, 61067.


 According to the data from the years 2002 - 2018 the average number of fires per year is 119. The highest number of reported fire incidents - 180 took place in 2009, and the least - 23 in 2003. The data has an increasing trend.
 When looking into fire subcategories, the most incidents belonged to: Outside Fires (43.3%), and Structure Fires (37.3%).