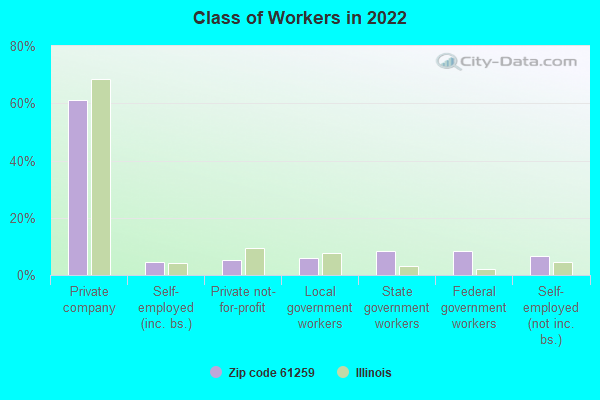
Estimated zip code population in 2022: 1,360 Zip code population in 2010: 1,276 Zip code population in 2000: 1,209
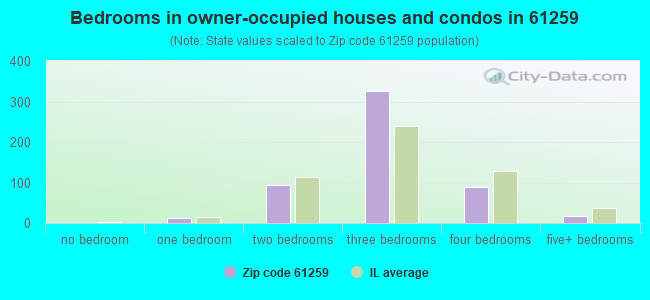
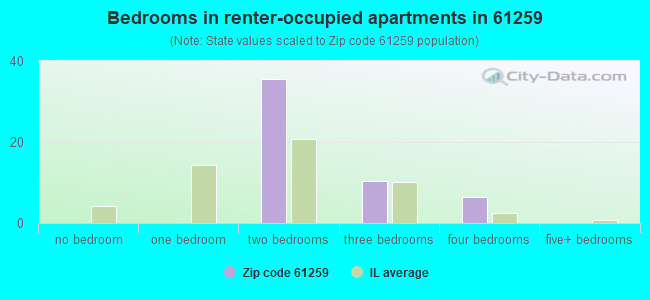
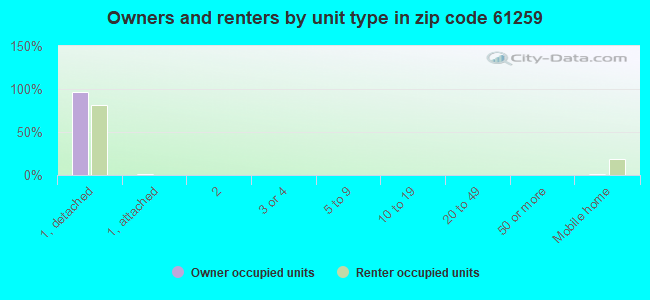
Houses and condos: 650 Renter-occupied apartments: 53
% of renters here:
9%
State:
33%
March 2022 cost of living index in zip code 61259: 83.1 (low, U.S. average is 100)
Land area: 76.4 sq. mi. Water area: 8.0 sq. mi.
Population density: 18 people per square mile
(very low).
OSM Map
General Map
Google Map
MSN Map
OSM Map
General Map
Google Map
MSN Map
OSM Map
General Map
Google Map
MSN Map
OSM Map
General Map
Google Map
MSN Map
Please wait while loading the map...
Real estate property taxes paid for housing units in 2022:
This zip code:
2.1% ($4,622)
Illinois:
2.0% ($4,912)
Median real estate property taxes paid for housing units with mortgages in 2022: $5,426 (2.5%) Median real estate property taxes paid for housing units with no mortgage in 2022: $3,171 (1.4%)
Business Search- 14 Million verified businesses
Males: 702
(51.7%)
Females: 657
(48.3%)
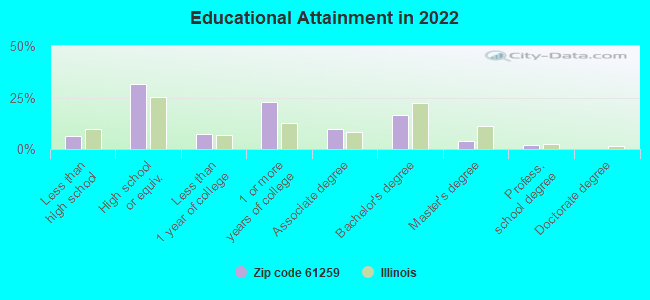
For population 25 years and over in 61259:
High school or higher: 92.0%
Bachelor's degree or higher: 22.3%
Graduate or professional degree: 6.1%
Unemployed: 2.5%
Mean travel time to work (commute): 36.4 minutes
For population 15 years and over in 61259:
Never married: 24.7%
Now married: 65.1%
Separated: 0.8%
Widowed: 4.3%
Divorced: 5.2%
Zip code 61259 compared to state average:
Unemployed percentage below state average.
Black race population percentage significantly below state average.
Hispanic race population percentage significantly below state average.
Median age significantly above state average.
Foreign-born population percentage significantly below state average.
Renting percentage significantly below state average.
Length of stay since moving in significantly above state average.
Percentage of population with a bachelor's degree or higher below state average.
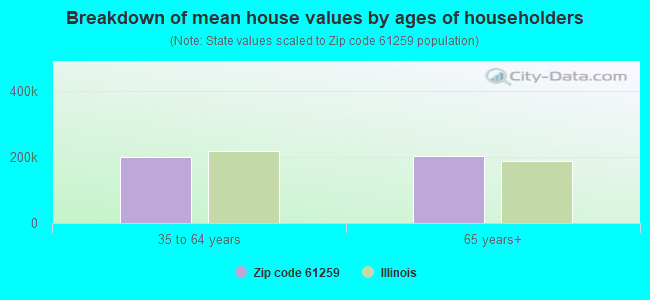
Estimated median house/condo value in 2022: $221,820
61259:
$221,820
Illinois:
$251,600
Median resident age:
This zip code:
53.0 years
Illinois median age:
39.1 years
Average household size:
This zip code:
2.3 people
Illinois:
2.4 people
Averages for the 2020 tax year for zip code 61259, filed in 2021:
Average Adjusted Gross Income (AGI) in 2020: $72,053 (Individual Income Tax Returns)
Here:
$72,053
State:
$82,626
Salary/wage: $66,240 (reported on 72.6% of returns)
Here:
$66,240
State:
$66,640
(% of AGI for various income ranges: 958.0% for AGIs below $25k, 3710.0% for AGIs $25k-50k, 5797.1% for AGIs $50k-75k, 8640.0% for AGIs $75k-100k, 14832.2% for AGIs $100k-200k)
Taxable interest for individuals: $1,211 (reported on 45.2% of returns)
This zip code:
$1,211
Illinois:
$2,376
(% of AGI for various income ranges: 26.0% for AGIs below $25k, 58.8% for AGIs $25k-50k, 155.7% for AGIs $50k-75k, 32.0% for AGIs $75k-100k, 156.7% for AGIs $100k-200k)
Ordinary dividends: $3,960 (reported on 24.2% of returns)
Here:
$3,960
State:
$9,061
(% of AGI for various income ranges: 34.0% for AGIs below $25k, 132.5% for AGIs $25k-50k, 84.3% for AGIs $50k-75k, 70.0% for AGIs $75k-100k, 400.0% for AGIs $100k-200k)
Net capital gain/loss in AGI: +$12,754 (reported on 21.0% of returns)
Here:
+$12,754
State:
+$31,684
(% of AGI for various income ranges: 55.0% for AGIs below $25k, 240.0% for AGIs $50k-75k, 1594.4% for AGIs $100k-200k)
Profit/loss from business: +$5,762 (reported on 12.9% of returns)
Here:
+$5,762
State:
+$12,175
(% of AGI for various income ranges: 225.0% for AGIs below $25k, 124.3% for AGIs $50k-75k, 165.6% for AGIs $100k-200k)
Taxable individual retirement arrangement distribution: $20,814 (reported on 11.3% of returns)
61259:
$20,814
Illinois:
$21,613
(% of AGI for various income ranges: 228.0% for AGIs below $25k, 747.1% for AGIs $50k-75k, 784.4% for AGIs $100k-200k)
Earned income credit: $2,167 (reported on 4.8% of returns)
Here:
$2,167
State:
$2,311
(% of AGI for various income ranges: 65.0% for AGIs below $25k)
Percentage of individuals using paid preparers for their 2020 taxes: 91.9%
Here:
92%
State:
93%
(% for various income ranges: 93.3% for AGIs below $25k, 91.7% for AGIs $25k-50k, 90.0% for AGIs $50k-75k, 87.5% for AGIs $75k-100k, 92.9% for AGIs $100k-200k, 100.0% for AGIs over 200k)
Averages for the 2012 tax year for zip code 61259, filed in 2013:
Average Adjusted Gross Income (AGI) in 2012: $68,878 (Individual Income Tax Returns)
Here:
$68,878
State:
$68,058
Salary/wage: $52,187 (reported on 80.0% of returns)
Here:
$52,187
State:
$55,396
(% of AGI for various income ranges: 60.9% for AGIs below $25k, 66.1% for AGIs $25k-50k, 70.2% for AGIs $50k-75k, 73.1% for AGIs $75k-100k, 95.6% for AGIs $100k-200k)
Taxable interest for individuals: $1,342 (reported on 50.8% of returns)
This zip code:
$1,342
Illinois:
$1,969
(% of AGI for various income ranges: 3.2% for AGIs below $25k, 2.3% for AGIs $25k-50k, 0.7% for AGIs $50k-75k, 0.6% for AGIs $75k-100k, 1.4% for AGIs $100k-200k)
Ordinary dividends: $2,511 (reported on 27.7% of returns)
Here:
$2,511
State:
$7,786
(% of AGI for various income ranges: 3.2% for AGIs below $25k, 0.8% for AGIs $25k-50k, 0.6% for AGIs $50k-75k, 0.3% for AGIs $75k-100k, 2.3% for AGIs $100k-200k)
Net capital gain/loss in AGI: +$12,842 (reported on 18.5% of returns)
Here:
+$12,842
State:
+$22,183
(% of AGI for various income ranges: 42.8% for AGIs below $25k, 1.8% for AGIs $50k-75k, 0.3% for AGIs $75k-100k, 11.4% for AGIs $100k-200k)
Profit/loss from business: +$3,762 (reported on 12.3% of returns)
Here:
+$3,762
State:
+$12,903
Taxable individual retirement arrangement distribution: $13,412 (reported on 12.3% of returns)
61259:
$13,412
Illinois:
$17,929
(% of AGI for various income ranges: 8.2% for AGIs below $25k, 7.3% for AGIs $50k-75k, 3.1% for AGIs $100k-200k)
Total itemized deductions: $19,957 (18% of AGI, reported on 32.3% of returns)
Here:
$19,957
State:
$26,433
Here:
17.6% of AGI
State:
19.2% of AGI
(% of AGI for various income ranges: 12.5% for AGIs $25k-50k, 11.0% for AGIs $50k-75k, 10.0% for AGIs $75k-100k, 16.3% for AGIs $100k-200k)
Charity contributions: $2,538 (reported on 24.6% of returns)
Here:
$2,538
State:
$4,525
(% of AGI for various income ranges: 1.3% for AGIs $50k-75k, 0.7% for AGIs $75k-100k, 2.1% for AGIs $100k-200k)
Taxes paid: $8,386 (reported on 32.3% of returns)
61259:
$8,386
State:
$11,968
(% of AGI for various income ranges: 3.3% for AGIs $25k-50k, 4.1% for AGIs $50k-75k, 4.0% for AGIs $75k-100k, 8.1% for AGIs $100k-200k)
Earned income credit: $2,060 (reported on 7.7% of returns)
Here:
$2,060
State:
$2,349
(% of AGI for various income ranges: 4.8% for AGIs below $25k)
Percentage of individuals using paid preparers for their 2012 taxes: 70.8%
Here:
71%
State:
57%
(% for various income ranges: 66.7% for AGIs below $25k, 69.2% for AGIs $25k-50k, 75.0% for AGIs $50k-75k, 70.0% for AGIs $75k-100k, 70.0% for AGIs $100k-200k, 100.0% for AGIs over 200k)
Averages for the 2004 tax year for zip code 61259, filed in 2005:
Average Adjusted Gross Income (AGI) in 2004: $46,660 (Individual Income Tax Returns)
Here:
$46,660
State:
$54,625
Salary/wage: $42,423 (reported on 82.3% of returns)
Here:
$42,423
State:
$46,811
(% of AGI for various income ranges: 96.0% for AGIs below $10k, 62.8% for AGIs $10k-25k, 76.7% for AGIs $25k-50k, 74.8% for AGIs $50k-75k, 77.8% for AGIs $75k-100k, 72.2% for AGIs over 100k)
Taxable interest for individuals: $1,169 (reported on 65.0% of returns)
This zip code:
$1,169
Illinois:
$2,101
(% of AGI for various income ranges: 9.6% for AGIs below $10k, 4.4% for AGIs $10k-25k, 2.3% for AGIs $25k-50k, 1.3% for AGIs $50k-75k, 1.2% for AGIs $75k-100k, 0.5% for AGIs over 100k)
Taxable dividends: $1,323 (reported on 31.0% of returns)
Here:
$1,323
State:
$4,306
(% of AGI for various income ranges: 1.8% for AGIs below $10k, 2.5% for AGIs $10k-25k, 0.8% for AGIs $25k-50k, 0.4% for AGIs $50k-75k, 0.8% for AGIs $75k-100k, 1.0% for AGIs over 100k)
Net capital gain/loss: +$4,730 (reported on 22.5% of returns)
Here:
+$4,730
State:
+$17,321
(% of AGI for various income ranges: -4.2% for AGIs below $10k, 0.1% for AGIs $10k-25k, 1.9% for AGIs $25k-50k, 0.2% for AGIs $50k-75k, 1.7% for AGIs $75k-100k, 6.5% for AGIs over 100k)
Profit/loss from business: +$1,262 (reported on 10.0% of returns)
Here:
+$1,262
State:
+$11,771
IRA payment deduction: $3,438 (reported on 2.6% of returns)
61259:
$3,438
Illinois:
$3,087
Total itemized deductions: $15,344 (21% of AGI, reported on 29.6% of returns)
Here:
$15,344
State:
$20,239
Here:
21.0% of AGI
State:
19.5% of AGI
(% of AGI for various income ranges: 18.4% for AGIs $10k-25k, 9.3% for AGIs $25k-50k, 7.7% for AGIs $50k-75k, 9.0% for AGIs $75k-100k, 11.2% for AGIs over 100k)
Charity contributions deductions: $2,322 (3% of AGI, reported on 23.5% of returns)
Here:
$2,322
State:
$3,719
Here:
2.9% of AGI
State:
3.4% of AGI
(% of AGI for various income ranges: 3.6% for AGIs below $10k, 0.8% for AGIs $25k-50k, 1.2% for AGIs $50k-75k, 0.9% for AGIs $75k-100k, 1.9% for AGIs over 100k)
Total tax: $5,671 (reported on 79.5% of returns)
61259:
$5,671
State:
$9,882
(% of AGI for various income ranges: 2.9% for AGIs below $10k, 3.0% for AGIs $10k-25k, 6.5% for AGIs $25k-50k, 8.3% for AGIs $50k-75k, 10.7% for AGIs $75k-100k, 15.2% for AGIs over 100k)
Earned income credit: $1,556 (reported on 7.4% of returns)
Here:
$1,556
State:
$1,788
Percentage of individuals using paid preparers for their 2004 taxes: 72.9%
Here:
73%
State:
61%
(% for various income ranges: 63.0% for AGIs below $10k, 69.7% for AGIs $10k-25k, 72.4% for AGIs $25k-50k, 82.2% for AGIs $50k-75k, 80.0% for AGIs $75k-100k, 70.2% for AGIs over 100k)
Household received Food Stamps/SNAP in the past 12 months: 10 Household did not receive Food Stamps/SNAP in the past 12 months: 570
Women who had a birth in the past 12 months: 71 (14 now married, 57 unmarried) Women who did not have a birth in the past 12 months: 126 (72 now married, 52 unmarried)
Housing units in zip code 61259 with a mortgage: 322 (29 second mortgage, 24 both second mortgage and home equity loan) Houses without a mortgage: 37
Median monthly owner costs for units with a mortgage: $1,620 Median monthly owner costs for units without a mortgage: $711
Residents with income below the poverty level in 2022:
This zip code:
4.7%
Whole state:
11.9%
Residents with income below 50% of the poverty level in 2022:
This zip code:
3.0%
Whole state:
5.7%
Median number of rooms in houses and condos:
Here:
6.6
State:
6.4
Median number of rooms in apartments:
Here:
5.4
State:
4.1
Notable locations in this zip code not listed on our city pages
Notable locations in zip code 61259: Loud Thunder Camp (A), Lone Cedar Picnic Area (B), Silva Campground (C), Illinois City Community Fire Protection District (D). Display/hide their locations on the map
Churches in zip code 61259 include: Pine Bluff Church (A), Providence Church (B), Illinois City United Methodist Church (C), River Bend Church (D). Display/hide their locations on the map
Streams, rivers, and creeks: Big Branch (A), Andalusia Slough (B), Drury Slough (C), Velie Chute (D), Copperas Creek (E), Fourth Slough (F). Display/hide their locations on the map
Size of family households: 206 2-persons, 61 3-persons, 131 4-persons, 19 5-persons
Size of nonfamily households: 142 1-person, 29 2-persons
144 married couples with children.
36 single-parent households (22 men, 14 women).
96.8% of residents of 61259 zip code speak English at home.
2.8% of residents speak other Indo-European language at home (46% very well, 26% well, 29% not well).
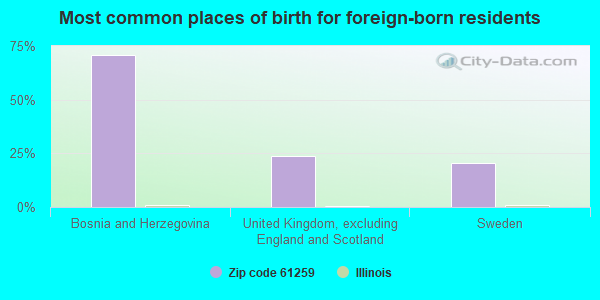
Foreign born population: 34 (2.5%) (100.0% of them are naturalized citizens)
This zip code:
2.5%
Whole state:
14.4%
71%Bosnia and Herzegovina
24%United Kingdom, excluding England and Scotland
21%Sweden
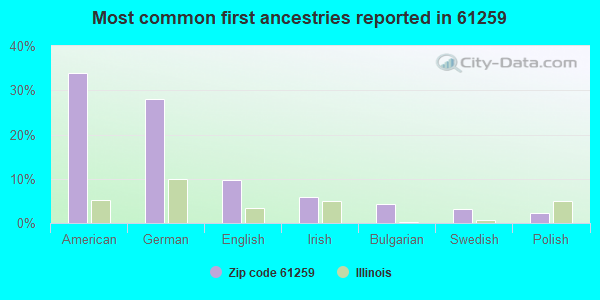
34%American
28%German
10%English
6%Irish
4%Bulgarian
3%Swedish
2%Polish
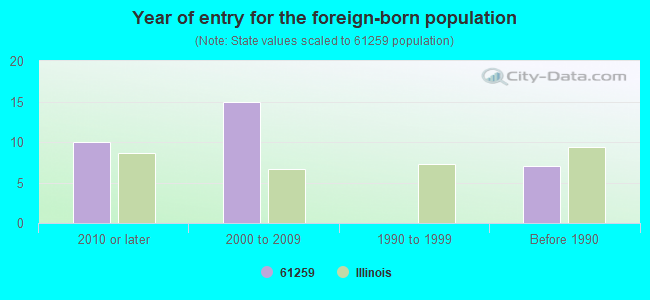
Year of entry for the foreign-born population
102010 or later
152000 to 2009
01990 to 1999
7Before 1990
Public elementary/middle school in in zip code 61259 not listed on the city page:
Facilities with environmental interests located in this zip code:
CROP PRODUCTION SVCS INC (26901 124TH AVE W in ILLINOIS CITY, IL)
STATE MASTER (Illinois EPA Project) - HAZARDOUS WASTE PROGRAM Large Quantity Generators, more that 1000 kg of hazardous waste/month (Resource Conservation and Recovery Act (tracking hazardous waste)) Organizations: DENNIS WEEKS (CONTACT/OPERATOR)
ILLINOIS CITY ELEM SCHOOL (PO BOX 39 in ILLINOIS CITY, IL)
(National Center for Education Statistics) - STATE ID-4908130002005 Organizations: ROCKRIDGE C U SCHOOL DIST 300 (SCHOOL DISTRICT)
ARMY CORPS OF ENGR LOCK DAM 16 (33109 102TH AVE W in ILLINOIS CITY, IL) . Federal Facility. ARMY CORPS OF ENGINEERS
Conditionally Exempt Small Quantity Generators, less than 100 kg/month of hazardous waste (Resource Conservation and Recovery Act (tracking hazardous waste)) - notification Organizations: US ARMY CORPS OF ENGRS DE (CONTACT/OWNER)
Housing units lacking complete kitchen facilities: 1.8%
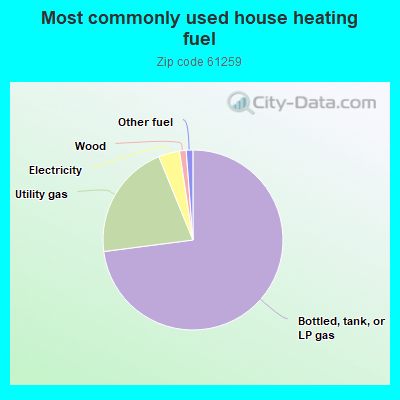
73.1%Bottled, tank, or LP gas
20.9%Utility gas
3.8%Electricity
1.2%Wood
1.2%Other fuel
Population in 1990: 1,553.
Place of birth for U.S.-born residents:
This state: 611
Midwest: 715
South: 7
60% of the 61259 zip code residents lived in the same house 5 years ago. Out of people who lived in different houses, 37% lived in this county. Out of people who lived in different counties, 50% lived in Illinois.
95% of the 61259 zip code residents lived in the same house 1 year ago. Out of people who lived in different houses, 112% moved from different state.
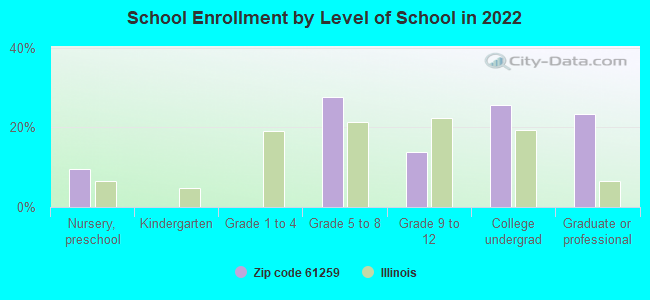
Private vs. public school enrollment:
Students in private schools in grades 1 to 8 (elementary and middle school):
Here:
0.0%
Illinois:
13.3%
Students in private schools in grades 9 to 12 (high school):
Here:
0.0%
Illinois:
9.9%
Students in private undergraduate colleges: 55
Here:
100.0%
Illinois:
27.4%
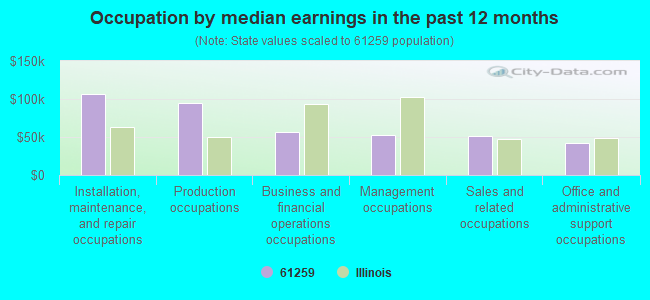
Occupation by median earnings in the past 12 months ($)
107,127Installation, maintenance, and repair occupations
94,329Production occupations
57,094Business and financial operations occupations
53,056Management occupations
50,727Sales and related occupations
41,802Office and administrative support occupations
Companies with federal contracts located in this zip code:
DICK DOYLE EXCAVATING INC (12008 238TH STREET WEST in ILLINOIS CITY, IL; small business) : $75,125 in 2 contractsfrom 2001 to 2002
$81,156 with U.S. Army Corps of Engineers - civil program financing only for Maintenance, Repair or Alteration of Real Property -- Restoration of real property. Taking place in IA. Signed on 2001-10-19. Completion date: 2001-12-31.
-$6,031, same as above.Signed on 2002-01-28. Completion date: 2001-12-31.
TREE SAVERS INC (13123 311TH ST W in ILLINOIS CITY, IL; small business)
$4,305 with Army for Landscaping/Groundskeeping Services. Taking place in IA. Signed on 2006-03-29. Completion date: 2007-03-31.
Top industries in this zip code by the number of employees in 2005:
Construction: Site Preparation Contractors (1-4 employees: 1 establishment)
Home Mortgage Disclosure Act Aggregated Statistics For Year 2009 (Based on 10 partial tracts)
A) FHA, FSA/RHS & VA Home Purchase Loans
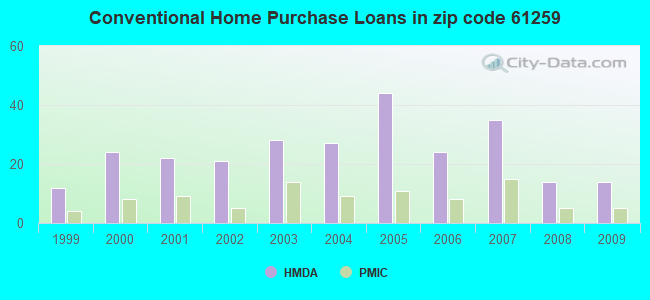
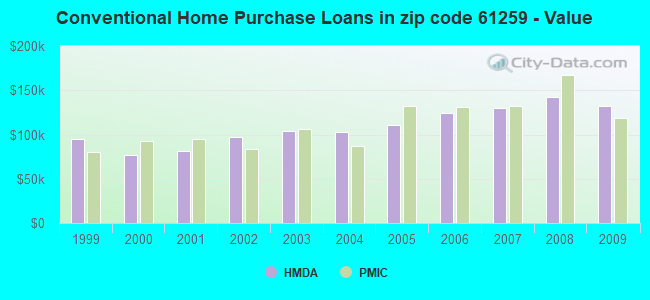
B) Conventional Home Purchase Loans
C) Refinancings
D) Home Improvement Loans
F) Non-occupant Loans on < 5 Family Dwellings (A B C & D)
Number
Average Value
Number
Average Value
Number
Average Value
Number
Average Value
Number
Average Value
LOANS ORIGINATED
16
$110,849
14
$132,050
107
$140,664
8
$33,335
2
$63,100
APPLICATIONS APPROVED, NOT ACCEPTED
2
$76,620
1
$15,020
5
$191,256
1
$210,340
0
$0
APPLICATIONS DENIED
2
$110,800
2
$122,070
10
$150,766
2
$40,940
0
$0
APPLICATIONS WITHDRAWN
0
$0
1
$56,340
11
$145,528
1
$11,270
0
$0
FILES CLOSED FOR INCOMPLETENESS
1
$161,510
0
$0
5
$108,774
0
$0
0
$0
Aggregated Statistics For Year 2008 (Based on 10 partial tracts)
A) FHA, FSA/RHS & VA Home Purchase Loans
B) Conventional Home Purchase Loans
C) Refinancings
D) Home Improvement Loans
F) Non-occupant Loans on < 5 Family Dwellings (A B C & D)
G) Loans On Manufactured Home Dwelling (A B C & D)
Number
Average Value
Number
Average Value
Number
Average Value
Number
Average Value
Number
Average Value
Number
Average Value
LOANS ORIGINATED
5
$116,436
14
$142,245
62
$123,003
14
$31,819
2
$42,065
1
$77,370
APPLICATIONS APPROVED, NOT ACCEPTED
0
$0
1
$72,120
5
$131,760
1
$17,280
1
$18,780
0
$0
APPLICATIONS DENIED
1
$103,670
1
$258,410
22
$145,835
7
$80,700
0
$0
0
$0
APPLICATIONS WITHDRAWN
1
$162,260
2
$90,895
9
$141,476
2
$67,610
0
$0
0
$0
FILES CLOSED FOR INCOMPLETENESS
0
$0
0
$0
1
$37,560
0
$0
0
$0
0
$0
Aggregated Statistics For Year 2007 (Based on 10 partial tracts)
A) FHA, FSA/RHS & VA Home Purchase Loans
B) Conventional Home Purchase Loans
C) Refinancings
D) Home Improvement Loans
F) Non-occupant Loans on < 5 Family Dwellings (A B C & D)
G) Loans On Manufactured Home Dwelling (A B C & D)
Number
Average Value
Number
Average Value
Number
Average Value
Number
Average Value
Number
Average Value
Number
Average Value
LOANS ORIGINATED
2
$98,785
35
$130,279
60
$108,511
22
$27,350
4
$57,090
0
$0
APPLICATIONS APPROVED, NOT ACCEPTED
1
$37,560
5
$108,774
9
$147,236
3
$16,527
0
$0
1
$78,120
APPLICATIONS DENIED
3
$123,697
5
$143,630
25
$143,028
2
$69,860
0
$0
0
$0
APPLICATIONS WITHDRAWN
2
$167,140
2
$109,300
11
$163,625
1
$37,560
0
$0
0
$0
FILES CLOSED FOR INCOMPLETENESS
0
$0
0
$0
0
$0
0
$0
0
$0
0
$0
Aggregated Statistics For Year 2006 (Based on 10 partial tracts)
A) FHA, FSA/RHS & VA Home Purchase Loans
B) Conventional Home Purchase Loans
C) Refinancings
D) Home Improvement Loans
F) Non-occupant Loans on < 5 Family Dwellings (A B C & D)
G) Loans On Manufactured Home Dwelling (A B C & D)
Number
Average Value
Number
Average Value
Number
Average Value
Number
Average Value
Number
Average Value
Number
Average Value
LOANS ORIGINATED
3
$112,430
24
$124,042
59
$102,392
16
$35,212
3
$61,850
1
$32,300
APPLICATIONS APPROVED, NOT ACCEPTED
0
$0
7
$110,641
9
$117,354
2
$20,660
0
$0
0
$0
APPLICATIONS DENIED
0
$0
5
$111,328
24
$103,196
6
$51,582
0
$0
1
$18,780
APPLICATIONS WITHDRAWN
1
$60,100
5
$81,130
14
$129,850
5
$73,468
0
$0
0
$0
FILES CLOSED FOR INCOMPLETENESS
0
$0
1
$195,310
4
$122,070
1
$135,220
0
$0
0
$0
Aggregated Statistics For Year 2005 (Based on 10 partial tracts)
A) FHA, FSA/RHS & VA Home Purchase Loans
B) Conventional Home Purchase Loans
C) Refinancings
D) Home Improvement Loans
F) Non-occupant Loans on < 5 Family Dwellings (A B C & D)
Number
Average Value
Number
Average Value
Number
Average Value
Number
Average Value
Number
Average Value
LOANS ORIGINATED
2
$109,675
44
$111,280
56
$113,217
15
$30,999
1
$48,080
APPLICATIONS APPROVED, NOT ACCEPTED
0
$0
2
$206,580
5
$165,114
2
$84,885
0
$0
APPLICATIONS DENIED
1
$57,840
10
$87,665
25
$122,386
6
$69,612
0
$0
APPLICATIONS WITHDRAWN
0
$0
9
$81,798
13
$116,552
1
$60,100
0
$0
FILES CLOSED FOR INCOMPLETENESS
0
$0
2
$59,345
3
$162,010
0
$0
0
$0
Aggregated Statistics For Year 2004 (Based on 10 partial tracts)
A) FHA, FSA/RHS & VA Home Purchase Loans
B) Conventional Home Purchase Loans
C) Refinancings
D) Home Improvement Loans
F) Non-occupant Loans on < 5 Family Dwellings (A B C & D)
G) Loans On Manufactured Home Dwelling (A B C & D)
Number
Average Value
Number
Average Value
Number
Average Value
Number
Average Value
Number
Average Value
Number
Average Value
LOANS ORIGINATED
0
$0
27
$102,859
73
$110,344
21
$24,181
5
$60,246
0
$0
APPLICATIONS APPROVED, NOT ACCEPTED
0
$0
3
$168,520
9
$117,438
2
$7,135
0
$0
1
$3,000
APPLICATIONS DENIED
0
$0
8
$66,200
23
$133,387
4
$45,072
0
$0
0
$0
APPLICATIONS WITHDRAWN
1
$91,650
5
$95,402
17
$126,378
3
$41,567
0
$0
0
$0
FILES CLOSED FOR INCOMPLETENESS
0
$0
0
$0
1
$30,050
0
$0
0
$0
0
$0
Aggregated Statistics For Year 2003 (Based on 10 partial tracts)
A) FHA, FSA/RHS & VA Home Purchase Loans
B) Conventional Home Purchase Loans
C) Refinancings
D) Home Improvement Loans
F) Non-occupant Loans on < 5 Family Dwellings (A B C & D)
Number
Average Value
Number
Average Value
Number
Average Value
Number
Average Value
Number
Average Value
LOANS ORIGINATED
3
$101,160
28
$104,417
170
$97,833
11
$18,370
4
$47,700
APPLICATIONS APPROVED, NOT ACCEPTED
1
$31,550
1
$136,720
11
$79,832
1
$37,560
0
$0
APPLICATIONS DENIED
1
$61,600
4
$132,588
24
$107,484
3
$90,393
0
$0
APPLICATIONS WITHDRAWN
0
$0
4
$74,180
29
$99,081
2
$16,900
1
$18,780
FILES CLOSED FOR INCOMPLETENESS
1
$43,570
2
$69,860
5
$123,498
1
$20,280
0
$0
Aggregated Statistics For Year 2002 (Based on 10 partial tracts)
A) FHA, FSA/RHS & VA Home Purchase Loans
B) Conventional Home Purchase Loans
C) Refinancings
D) Home Improvement Loans
F) Non-occupant Loans on < 5 Family Dwellings (A B C & D)
Number
Average Value
Number
Average Value
Number
Average Value
Number
Average Value
Number
Average Value
LOANS ORIGINATED
3
$99,410
21
$97,406
125
$105,955
15
$20,683
3
$102,663
APPLICATIONS APPROVED, NOT ACCEPTED
1
$43,570
2
$72,865
10
$87,665
2
$4,130
0
$0
APPLICATIONS DENIED
0
$0
2
$55,590
20
$72,002
2
$7,890
1
$24,040
APPLICATIONS WITHDRAWN
2
$78,500
2
$45,070
21
$101,770
0
$0
0
$0
FILES CLOSED FOR INCOMPLETENESS
0
$0
0
$0
2
$75,120
0
$0
0
$0
Aggregated Statistics For Year 2001 (Based on 10 partial tracts)
A) FHA, FSA/RHS & VA Home Purchase Loans
B) Conventional Home Purchase Loans
C) Refinancings
D) Home Improvement Loans
F) Non-occupant Loans on < 5 Family Dwellings (A B C & D)
Number
Average Value
Number
Average Value
Number
Average Value
Number
Average Value
Number
Average Value
LOANS ORIGINATED
6
$80,253
22
$81,027
110
$93,927
17
$22,359
1
$22,540
APPLICATIONS APPROVED, NOT ACCEPTED
0
$0
2
$25,165
13
$91,820
3
$14,773
0
$0
APPLICATIONS DENIED
2
$77,000
2
$83,385
20
$89,881
3
$12,520
0
$0
APPLICATIONS WITHDRAWN
0
$0
4
$122,820
22
$87,480
0
$0
0
$0
FILES CLOSED FOR INCOMPLETENESS
0
$0
0
$0
2
$62,725
1
$15,020
0
$0
Aggregated Statistics For Year 2000 (Based on 10 partial tracts)
A) FHA, FSA/RHS & VA Home Purchase Loans
B) Conventional Home Purchase Loans
C) Refinancings
D) Home Improvement Loans
F) Non-occupant Loans on < 5 Family Dwellings (A B C & D)
Number
Average Value
Number
Average Value
Number
Average Value
Number
Average Value
Number
Average Value
LOANS ORIGINATED
1
$120,940
24
$76,622
32
$80,613
23
$18,747
1
$22,540
APPLICATIONS APPROVED, NOT ACCEPTED
0
$0
3
$47,827
8
$73,242
4
$29,860
0
$0
APPLICATIONS DENIED
1
$63,850
4
$52,395
11
$64,194
6
$14,773
0
$0
APPLICATIONS WITHDRAWN
0
$0
4
$80,378
14
$67,232
2
$24,040
0
$0
FILES CLOSED FOR INCOMPLETENESS
0
$0
0
$0
4
$79,440
0
$0
0
$0
Aggregated Statistics For Year 1999 (Based on 5 partial tracts)


 Nearest zip codes: 52761, 61272, 61260, 52749, 61284, 52726.


 (Students: 163, Location: 24017 122ND AVE W, Grades: PK-2)