Estimated zip code population in 2022: 1,835 Zip code population in 2010: 1,961 Zip code population in 2000: 2,102
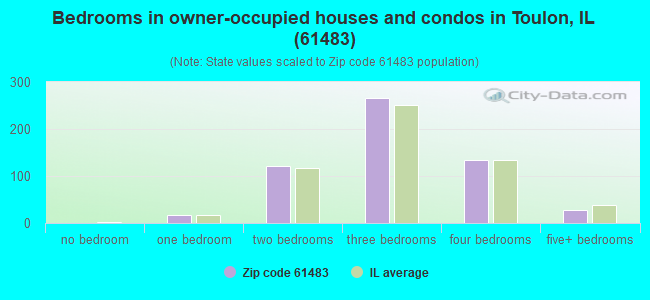
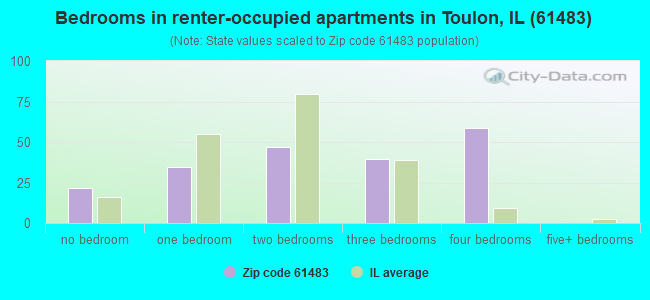
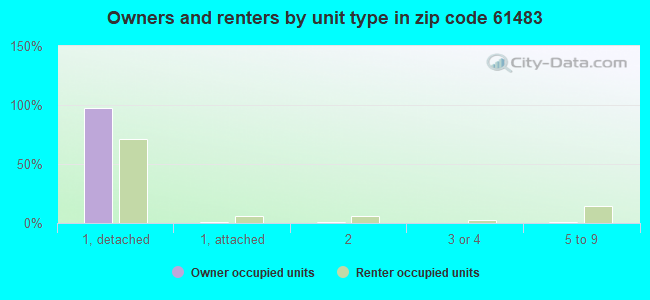
Houses and condos: 842 Renter-occupied apartments: 204
% of renters here:
27%
State:
33%
March 2022 cost of living index in zip code 61483: 84.1 (less than average, U.S. average is 100)
Land area: 94.8 sq. mi. Water area: 0.0 sq. mi.
Population density: 19 people per square mile
(very low).
OSM Map
General Map
Google Map
MSN Map
OSM Map
General Map
Google Map
MSN Map
OSM Map
General Map
Google Map
MSN Map
OSM Map
General Map
Google Map
MSN Map
Please wait while loading the map...
Real estate property taxes paid for housing units in 2022:
This zip code:
1.8% ($1,963)
Illinois:
2.0% ($4,912)
Median real estate property taxes paid for housing units with mortgages in 2022: $1,855 (1.8%) Median real estate property taxes paid for housing units with no mortgage in 2022: $2,085 (1.9%)
Business Search- 14 Million verified businesses
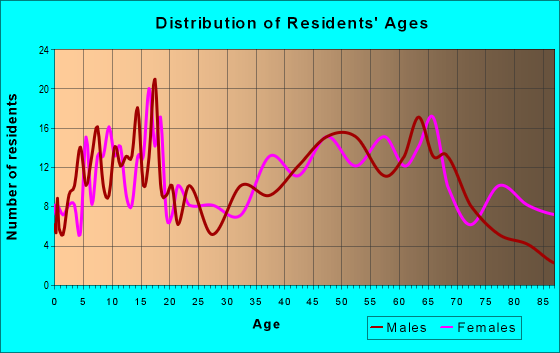
Males: 927
(50.5%)
Females: 907
(49.5%)
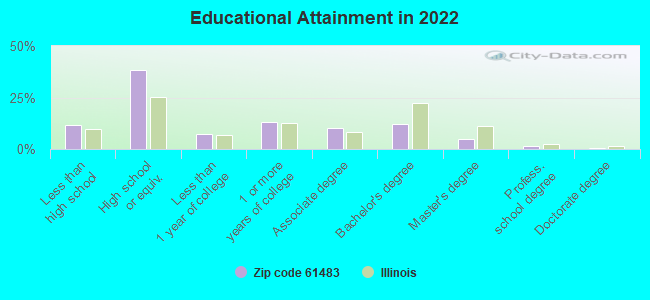
For population 25 years and over in 61483:
High school or higher: 86.8%
Bachelor's degree or higher: 19.0%
Graduate or professional degree: 6.8%
Unemployed: 2.6%
Mean travel time to work (commute): 32.1 minutes
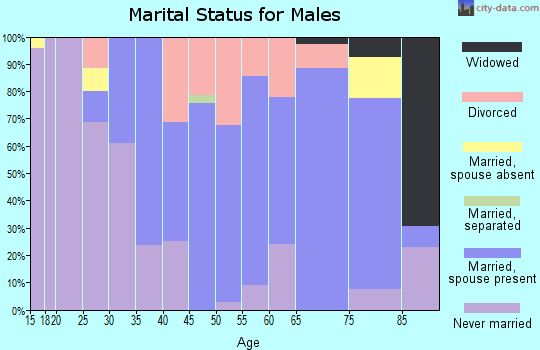
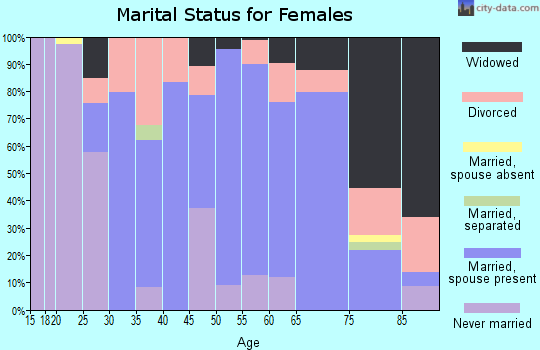
For population 15 years and over in 61483:
Never married: 23.0%
Now married: 57.2%
Separated: 0.9%
Widowed: 10.0%
Divorced: 8.9%
Zip code 61483 compared to state average:
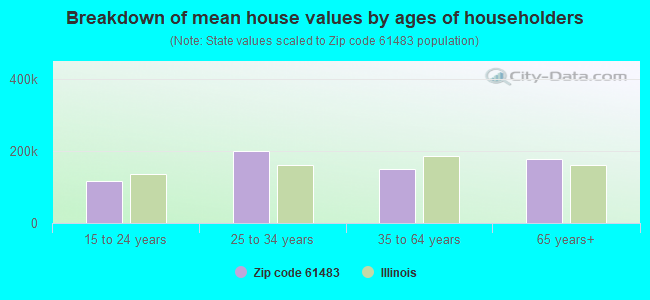
Median house value significantly below state average.
Unemployed percentage below state average.
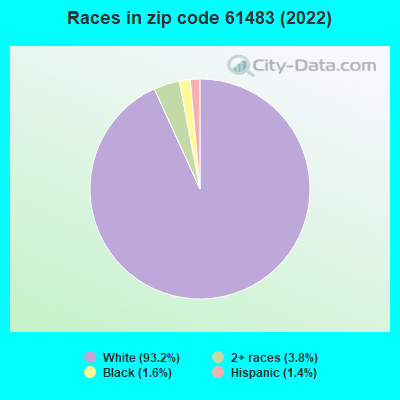
Black race population percentage significantly below state average.
Hispanic race population percentage significantly below state average.
Median age above state average.
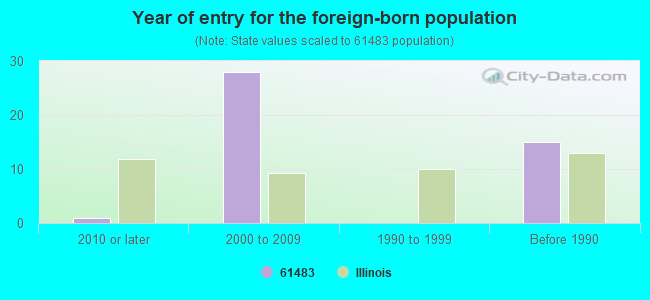
Foreign-born population percentage significantly below state average.
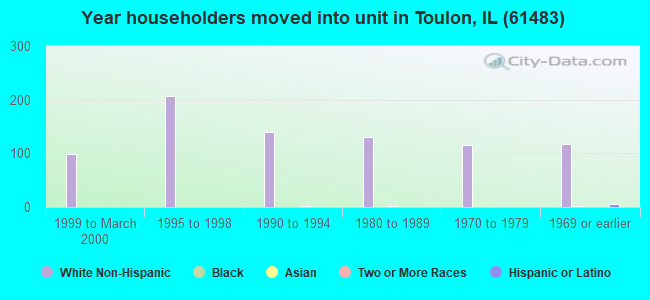
Length of stay since moving in above state average.
Number of college students significantly below state average.
Percentage of population with a bachelor's degree or higher below state average.
Averages for the 2020 tax year for zip code 61483, filed in 2021:
Average Adjusted Gross Income (AGI) in 2020: $60,855 (Individual Income Tax Returns)
Here:
$60,855
State:
$82,626
Salary/wage: $44,871 (reported on 78.2% of returns)
Here:
$44,871
State:
$66,640
(% of AGI for various income ranges: 1184.3% for AGIs below $25k, 3599.3% for AGIs $25k-50k, 5784.0% for AGIs $50k-75k, 9753.3% for AGIs $75k-100k, 13451.7% for AGIs $100k-200k)
Taxable interest for individuals: $1,087 (reported on 44.8% of returns)
This zip code:
$1,087
Illinois:
$2,376
(% of AGI for various income ranges: 9.0% for AGIs below $25k, 48.0% for AGIs $25k-50k, 95.0% for AGIs $50k-75k, 75.0% for AGIs $75k-100k, 128.3% for AGIs $100k-200k)
Ordinary dividends: $3,947 (reported on 19.5% of returns)
Here:
$3,947
State:
$9,061
(% of AGI for various income ranges: 26.7% for AGIs below $25k, 124.0% for AGIs $50k-75k, 268.3% for AGIs $75k-100k, 550.0% for AGIs $100k-200k)
Net capital gain/loss in AGI: +$6,693 (reported on 17.2% of returns)
Here:
+$6,693
State:
+$31,684
(% of AGI for various income ranges: 37.1% for AGIs below $25k, 87.0% for AGIs $50k-75k, 171.7% for AGIs $75k-100k, 1226.7% for AGIs $100k-200k)
Profit/loss from business: +$11,464 (reported on 12.6% of returns)
Here:
+$11,464
State:
+$12,175
(% of AGI for various income ranges: 37.6% for AGIs below $25k, 162.7% for AGIs $25k-50k, 461.0% for AGIs $50k-75k, 795.0% for AGIs $100k-200k)
Taxable individual retirement arrangement distribution: $10,850 (reported on 11.5% of returns)
61483:
$10,850
Illinois:
$21,613
(% of AGI for various income ranges: 141.0% for AGIs below $25k, 392.0% for AGIs $50k-75k, 661.7% for AGIs $100k-200k)
Earned income credit: $2,377 (reported on 14.9% of returns)
Here:
$2,377
State:
$2,311
(% of AGI for various income ranges: 95.2% for AGIs below $25k, 72.7% for AGIs $25k-50k)
Percentage of individuals using paid preparers for their 2020 taxes: 95.4%
Here:
95%
State:
93%
(% for various income ranges: 96.4% for AGIs below $25k, 95.0% for AGIs $25k-50k, 93.3% for AGIs $50k-75k, 90.9% for AGIs $75k-100k, 100.0% for AGIs $100k-200k, 100.0% for AGIs over 200k)
Averages for the 2012 tax year for zip code 61483, filed in 2013:
Average Adjusted Gross Income (AGI) in 2012: $57,696 (Individual Income Tax Returns)
Here:
$57,696
State:
$68,058
Salary/wage: $40,079 (reported on 78.7% of returns)
Here:
$40,079
State:
$55,396
(% of AGI for various income ranges: 68.4% for AGIs below $25k, 72.3% for AGIs $25k-50k, 64.5% for AGIs $50k-75k, 66.8% for AGIs $75k-100k, 70.3% for AGIs $100k-200k)
Taxable interest for individuals: $961 (reported on 51.7% of returns)
This zip code:
$961
Illinois:
$1,969
(% of AGI for various income ranges: 2.1% for AGIs below $25k, 0.7% for AGIs $25k-50k, 1.0% for AGIs $50k-75k, 0.9% for AGIs $75k-100k, 0.7% for AGIs $100k-200k, 0.7% for AGIs over 200k)
Ordinary dividends: $2,330 (reported on 22.5% of returns)
Here:
$2,330
State:
$7,786
(% of AGI for various income ranges: 1.6% for AGIs below $25k, 0.3% for AGIs $25k-50k, 1.0% for AGIs $50k-75k, 1.0% for AGIs $75k-100k, 1.6% for AGIs $100k-200k)
Net capital gain/loss in AGI: +$8,220 (reported on 16.9% of returns)
Here:
+$8,220
State:
+$22,183
(% of AGI for various income ranges: 0.6% for AGIs below $25k, 0.1% for AGIs $50k-75k, 0.3% for AGIs $75k-100k, 9.0% for AGIs $100k-200k)
Profit/loss from business: +$5,458 (reported on 13.5% of returns)
Here:
+$5,458
State:
+$12,903
(% of AGI for various income ranges: 6.1% for AGIs below $25k, 3.7% for AGIs $25k-50k, 0.3% for AGIs $50k-75k, 1.4% for AGIs $75k-100k)
Taxable individual retirement arrangement distribution: $8,345 (reported on 12.4% of returns)
61483:
$8,345
Illinois:
$17,929
(% of AGI for various income ranges: 7.2% for AGIs below $25k, 4.5% for AGIs $50k-75k, 2.1% for AGIs $100k-200k)
Total itemized deductions: $19,255 (17% of AGI, reported on 22.5% of returns)
Here:
$19,255
State:
$26,433
Here:
16.7% of AGI
State:
19.2% of AGI
(% of AGI for various income ranges: 6.8% for AGIs $25k-50k, 7.1% for AGIs $50k-75k, 7.7% for AGIs $75k-100k, 10.9% for AGIs $100k-200k, 6.7% for AGIs over 200k)
Charity contributions: $5,831 (reported on 14.6% of returns)
Here:
$5,831
State:
$4,525
(% of AGI for various income ranges: 1.4% for AGIs $50k-75k, 1.7% for AGIs $75k-100k, 3.9% for AGIs $100k-200k)
Taxes paid: $7,425 (reported on 22.5% of returns)
61483:
$7,425
State:
$11,968
(% of AGI for various income ranges: 1.8% for AGIs $25k-50k, 2.2% for AGIs $50k-75k, 2.7% for AGIs $75k-100k, 4.3% for AGIs $100k-200k, 3.7% for AGIs over 200k)
Earned income credit: $2,123 (reported on 14.6% of returns)
Here:
$2,123
State:
$2,349
(% of AGI for various income ranges: 5.4% for AGIs below $25k, 0.9% for AGIs $25k-50k)
Percentage of individuals using paid preparers for their 2012 taxes: 68.5%
Here:
69%
State:
57%
(% for various income ranges: 62.5% for AGIs below $25k, 65.0% for AGIs $25k-50k, 64.3% for AGIs $50k-75k, 80.0% for AGIs $75k-100k, 80.0% for AGIs $100k-200k, 100.0% for AGIs over 200k)
Averages for the 2004 tax year for zip code 61483, filed in 2005:
Average Adjusted Gross Income (AGI) in 2004: $38,944 (Individual Income Tax Returns)
Here:
$38,944
State:
$54,625
Salary/wage: $33,178 (reported on 79.4% of returns)
Here:
$33,178
State:
$46,811
(% of AGI for various income ranges: 116.7% for AGIs below $10k, 59.4% for AGIs $10k-25k, 72.4% for AGIs $25k-50k, 66.3% for AGIs $50k-75k, 78.3% for AGIs $75k-100k, 54.0% for AGIs over 100k)
Taxable interest for individuals: $1,552 (reported on 64.6% of returns)
This zip code:
$1,552
Illinois:
$2,101
(% of AGI for various income ranges: 11.5% for AGIs below $10k, 5.3% for AGIs $10k-25k, 2.2% for AGIs $25k-50k, 2.5% for AGIs $50k-75k, 0.7% for AGIs $75k-100k, 2.4% for AGIs over 100k)
Taxable dividends: $1,705 (reported on 29.6% of returns)
Here:
$1,705
State:
$4,306
(% of AGI for various income ranges: 5.2% for AGIs below $10k, 1.6% for AGIs $10k-25k, 1.1% for AGIs $25k-50k, 1.4% for AGIs $50k-75k, 1.2% for AGIs $75k-100k, 1.0% for AGIs over 100k)
Net capital gain/loss: +$2,877 (reported on 21.5% of returns)
Here:
+$2,877
State:
+$17,321
(% of AGI for various income ranges: 3.1% for AGIs below $10k, 0.5% for AGIs $10k-25k, 0.5% for AGIs $25k-50k, 0.4% for AGIs $50k-75k, 2.0% for AGIs $75k-100k, 4.5% for AGIs over 100k)
Profit/loss from business: +$3,766 (reported on 15.3% of returns)
Here:
+$3,766
State:
+$11,771
(% of AGI for various income ranges: 0.3% for AGIs below $10k, 3.9% for AGIs $10k-25k, 4.1% for AGIs $25k-50k, 0.4% for AGIs $50k-75k, 0.2% for AGIs $75k-100k)
Profit/loss from farming: +$12,549 (reported on 8.6% of returns)
Here:
+$12,549
State:
+$2,327
(% of AGI for various income ranges: -9.6% for AGIs below $10k, 0.2% for AGIs $25k-50k, 4.2% for AGIs $50k-75k, 10.3% for AGIs $75k-100k)
IRA payment deduction: $2,105 (reported on 2.0% of returns)
61483:
$2,105
Illinois:
$3,087
Total itemized deductions: $15,157 (20% of AGI, reported on 16.8% of returns)
Here:
$15,157
State:
$20,239
Here:
20.2% of AGI
State:
19.5% of AGI
(% of AGI for various income ranges: 10.2% for AGIs $10k-25k, 5.1% for AGIs $25k-50k, 6.6% for AGIs $50k-75k, 7.2% for AGIs $75k-100k, 6.3% for AGIs over 100k)
Charity contributions deductions: $3,500 (4% of AGI, reported on 13.5% of returns)
Here:
$3,500
State:
$3,719
Here:
4.3% of AGI
State:
3.4% of AGI
(% of AGI for various income ranges: 0.5% for AGIs $10k-25k, 0.5% for AGIs $25k-50k, 1.3% for AGIs $50k-75k, 1.3% for AGIs $75k-100k, 2.2% for AGIs over 100k)
Total tax: $5,438 (reported on 75.2% of returns)
61483:
$5,438
State:
$9,882
(% of AGI for various income ranges: 2.8% for AGIs below $10k, 3.7% for AGIs $10k-25k, 6.7% for AGIs $25k-50k, 9.1% for AGIs $50k-75k, 11.2% for AGIs $75k-100k, 20.2% for AGIs over 100k)
Earned income credit: $1,674 (reported on 14.6% of returns)
Here:
$1,674
State:
$1,788
Percentage of individuals using paid preparers for their 2004 taxes: 69.5%
Here:
70%
State:
61%
(% for various income ranges: 56.2% for AGIs below $10k, 71.0% for AGIs $10k-25k, 71.7% for AGIs $25k-50k, 75.0% for AGIs $50k-75k, 76.6% for AGIs $75k-100k, 80.4% for AGIs over 100k)
Likely homosexual households (counted as self-reported same-sex unmarried-partner households)
Lesbian couples: 0.4% of all households
Gay men: 0.4% of all households
Household received Food Stamps/SNAP in the past 12 months: 132 Household did not receive Food Stamps/SNAP in the past 12 months: 638
Women who had a birth in the past 12 months: 15 (15 now married, 0 unmarried) Women who did not have a birth in the past 12 months: 284 (143 now married, 140 unmarried)
Housing units in zip code 61483 with a mortgage: 292 (16 second mortgage, 16 both second mortgage and home equity loan) Houses without a mortgage: 3
Median monthly owner costs for units with a mortgage: $1,142 Median monthly owner costs for units without a mortgage: $489
Residents with income below the poverty level in 2022:
This zip code:
14.5%
Whole state:
11.9%
Residents with income below 50% of the poverty level in 2022:
This zip code:
4.8%
Whole state:
5.7%
Median number of rooms in houses and condos:
Here:
6.5
State:
6.4
Median number of rooms in apartments:
Here:
5.2
State:
4.1
Notable locations in this zip code not listed on our city pages
Notable locations in zip code 61483: Morgan - Richey Jersey Farm (A), Stark County Courthouse (B), Toulon Public Library (C), Stark County Ambulance Service (D), Toulon Fire Protection District (E). Display/hide their locations on the map
Churches in zip code 61483 include: Elmira United Presbyterian Church (A), Faith Baptist Church (B), First Baptist Church (C), First Congregational Church (D), Toulon United Methodist Church (E). Display/hide their locations on the map
Cemeteries: Stringtown Cemetery (1), Starwano Cemetery (2), West Jersey Methodist Churchyard (3), Toulon Cemetery (4), Elmira Cemetery (5), Shockley Cemetery (6), County Farm Cemetery (7). Display/hide their locations on the map
In group quarters: 74 (-1 institutionalized population)
Size of family households: 249 2-persons, 98 3-persons, 75 4-persons, 63 5-persons, 3 7-or-more-persons
Size of nonfamily households: 251 1-person, 24 2-persons
272 married couples with children.
71 single-parent households (60 men, 11 women).
96.6% of residents of 61483 zip code speak English at home.
2.2% of residents speak Spanish at home (66% very well, 24% well, 11% not well).
1.3% of residents speak other language at home (100% very well).
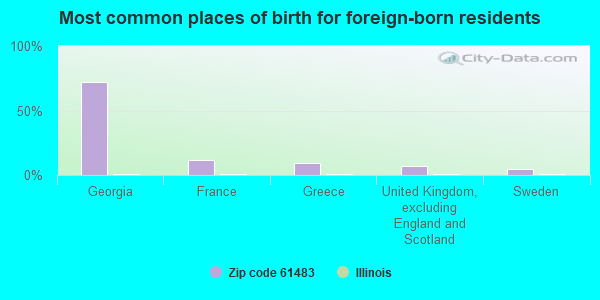
Foreign born population: 43 (2.4%) (67.6% of them are naturalized citizens)
This zip code:
2.4%
Whole state:
14.4%
72%Georgia
12%France
9%Greece
7%United Kingdom, excluding England and Scotland
5%Sweden
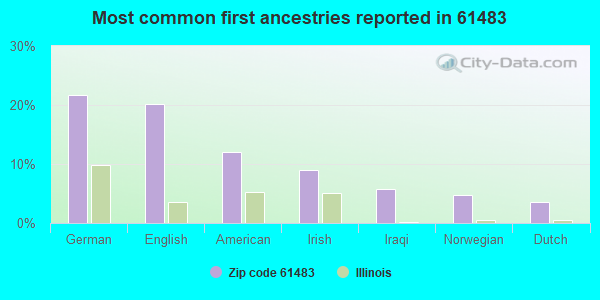
22%German
20%English
12%American
9%Irish
6%Iraqi
5%Norwegian
4%Dutch
Year of entry for the foreign-born population
12010 or later
282000 to 2009
01990 to 1999
15Before 1990
Facilities with environmental interests located in this zip code:
AG VIEW FS INC (RR 1, BOX 116A in TOULON, IL)
STATE MASTER (Illinois EPA Project) - AIR PROGRAM AIR MINOR (AIRS/AFS) Business SIC classification: NONCLASSIFIABLE ESTABLISHMENTS
KRAFT USA (515 E. MAIN - HIGHWAY 17 in TOULON, IL)
STATE MASTER (Illinois EPA Project) - National Pollutant Discharge Elimination System Permit National Pollutant Discharge Elimination System NON-MAJOR (Tracking pollutant discharge elimination systems) - permit Alternative names: TOULON COLD STORAGE
RUMBOLD & KUHN INC. (214 GREENWOOD ST in TOULON, IL)
STATE MASTER (Illinois EPA Project) - AIR PROGRAM AIR MINOR (AIRS/AFS) CRITERIA AND HAZARDOUS AIR POLLUTANT INVENTORY (Inventory of air pollution sources) Business SIC classification: GRAIN AND FIELD BEANS Alternative names: TOULON GRAIN & FEED COMPANY
MIDLAND COAL CO (PO BOX 8 in TOULON, IL)
STATE MASTER (Illinois EPA Project) - AIR PROGRAM AIR MINOR (AIRS/AFS) Business SIC classification: BITUMINOUS COAL UNDERGROUND MINING
DEXTER OIL CO (328 CLINTON in TOULON, IL)
STATE MASTER (Illinois EPA Project) - AIR PROGRAM AIR MINOR (AIRS/AFS) Business SIC classification: PETROLEUM BULK STATIONS AND TERMINALS
BOB PROPHETER AGGREGATES LLC (ROUTES 17 & 78 in TOULON, IL)
STATE MASTER (Illinois EPA Project) - SOLID WASTE PROGRAM, AIR PROGRAM AIR MINOR (AIRS/AFS) Business SIC classification: ASPHALT PAVING MIXTURES AND BLOCKS Alternative names: BOB PROPHETER AGGREGATES LLC-PLANT #6
BLUE RIBBON PAINT SUPERFUND REMOVAL SITE (601 E REYNOLDS ST in GOSHEN, IL)
(Integrated Compliance Information System) - ICIS-05-2002-0087, FORMAL ENFORCEMENT ACTION
ALLEN?PHILLIP L. (RR 2, W. CLINTON ST-4TH HOUSE in TOULON, IL)
National Pollutant Discharge Elimination System NON-MAJOR (Tracking pollutant discharge elimination systems) - permit Alternative names: ALLEN, PHILLIP L.
MUSSELMAN FARMS (RR #1 in TOULON, IL)
National Pollutant Discharge Elimination System NON-MAJOR (Tracking pollutant discharge elimination systems) - permit Organizations: MUSSELMAN TRUCKING, INC (CONTACT/OWNER)
AG VIEW FS INC. (RR ELMIRA ROAD in ELMIRA, IL)
ENFORCEMENT/COMPLIANCE ACTIVITY (Integrated Compliance Information System)
Housing units lacking complete plumbing facilities: 3.6% Housing units lacking complete kitchen facilities: 6.2%
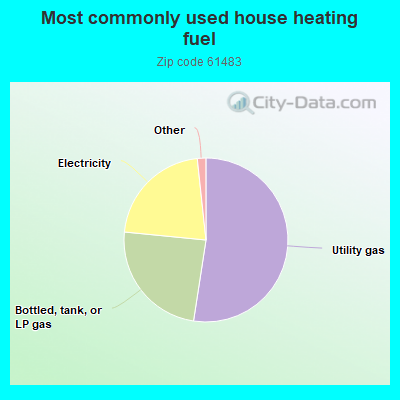
52.6%Utility gas
24.2%Bottled, tank, or LP gas
21.8%Electricity
0.9%No fuel used
0.8%Wood
Population in 1990: 2,378.
Place of birth for U.S.-born residents:
This state: 1,420
Northeast: 4
Midwest: 173
South: 28
West: 160
62% of the 61483 zip code residents lived in the same house 5 years ago. Out of people who lived in different houses, 49% lived in this county. Out of people who lived in different counties, 50% lived in Illinois.
84% of the 61483 zip code residents lived in the same house 1 year ago. Out of people who lived in different houses, 39% moved from this county. Out of people who lived in different houses, 51% moved from different county within same state. Out of people who lived in different houses, 12% moved from different state.
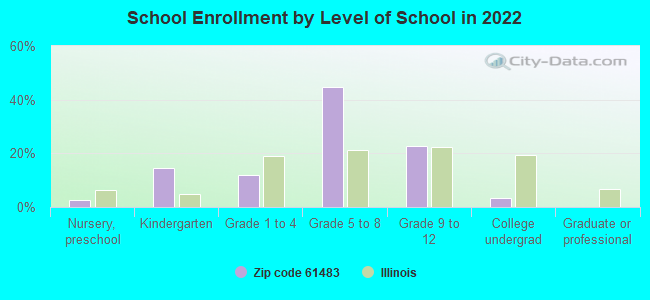
Private vs. public school enrollment:
Students in private schools in grades 1 to 8 (elementary and middle school): 9
Here:
5.4%
Illinois:
13.3%
Students in private schools in grades 9 to 12 (high school): 8
Here:
12.4%
Illinois:
9.9%
Students in private undergraduate colleges: 3
Here:
33.7%
Illinois:
27.4%
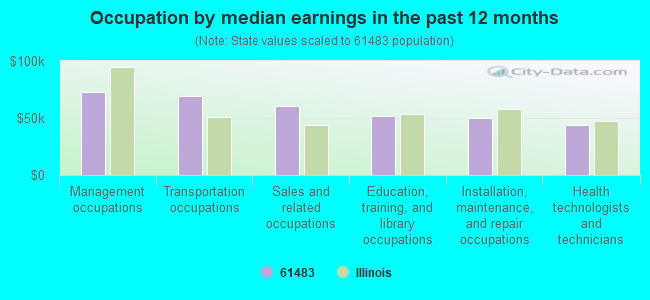
Occupation by median earnings in the past 12 months ($)
72,523Management occupations
69,568Transportation occupations
60,773Sales and related occupations
51,709Education, training, and library occupations
49,898Installation, maintenance, and repair occupations
43,988Health technologists and technicians
Top industries in this zip code by the number of employees in 2005:
Wholesale Trade: Other Electronic Parts and Equipment Merchant Wholesalers (20-49 employees: 1 establishment)
Professional, Scientific, and Technical Services: Other Accounting Services (20-49: 1)
Finance and Insurance: Commercial Banking (20-49: 1)
90 people in nursing facilities/skilled-nursing facilities
2 people in local jails and other municipal confinement facilities
People in group quarters in 2000:
112 people in nursing homes
3 people in local jails and other confinement facilities (including police lockups)
Fatal accident statistics in 2014:
Fatal accident count: 2
Vehicles involved in fatal accidents: 4
Fatal accidents caused by drunken drivers: 0
Fatalities: 2
Persons involved in fatal accidents: 6
Pedestrians involved in fatal accidents: 1
Fatal accident statistics in 2012:
Fatal accident count: 1
Vehicles involved in fatal accidents: 1
Fatal accidents caused by drunken drivers: 1
Fatalities: 1
Persons involved in fatal accidents: 2
Pedestrians involved in fatal accidents: 0
2002 - 2018 National Fire Incident Reporting System (NFIRS) incidents
According to the data from the years 2002 - 2018 the average number of fires per year is 15. The highest number of fires - 28 took place in 2014, and the least - 1 in 2006. The data has a dropping trend.
When looking into fire subcategories, the most incidents belonged to: Outside Fires (53.7%), and Structure Fires (28.2%).
Fire incident types reported to NFIRS in Zip Code 61483
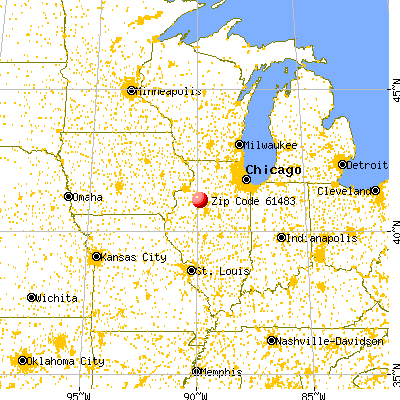


 Nearest zip codes: 61449, 61491, 61451, 61426, 61434, 61443.


 According to the data from the years 2002 - 2018 the average number of fires per year is 15. The highest number of fires - 28 took place in 2014, and the least - 1 in 2006. The data has a dropping trend.
 When looking into fire subcategories, the most incidents belonged to: Outside Fires (53.7%), and Structure Fires (28.2%).