Estimated zip code population in 2022: 1,266 Zip code population in 2010: 1,120 Zip code population in 2000: 1,199
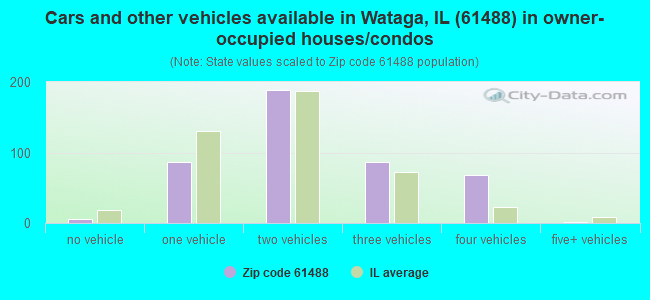
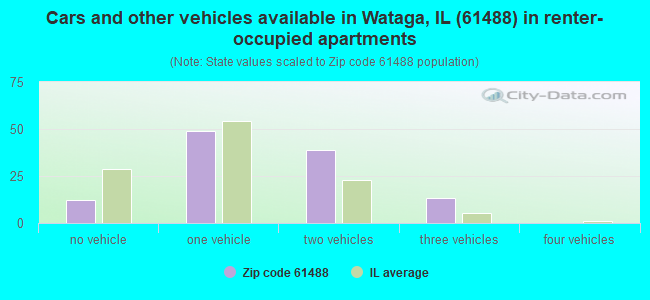
Houses and condos: 569 Renter-occupied apartments: 114
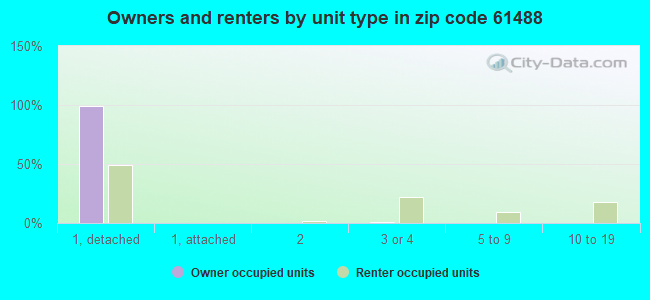
% of renters here:
20%
State:
33%
March 2022 cost of living index in zip code 61488: 83.6 (less than average, U.S. average is 100)
Land area: 25.8 sq. mi. Water area: 0.0 sq. mi.
Population density: 49 people per square mile
(very low).
OSM Map
General Map
Google Map
MSN Map
OSM Map
General Map
Google Map
MSN Map
OSM Map
General Map
Google Map
MSN Map
OSM Map
General Map
Google Map
MSN Map
Please wait while loading the map...
Real estate property taxes paid for housing units in 2022:
This zip code:
1.8% ($2,285)
Illinois:
2.0% ($4,912)
Median real estate property taxes paid for housing units with mortgages in 2022: $2,217 (1.9%) Median real estate property taxes paid for housing units with no mortgage in 2022: $2,376 (1.7%)
Business Search- 14 Million verified businesses
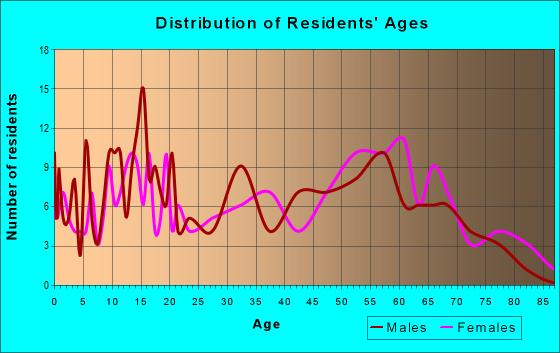
Males: 606
(47.9%)
Females: 659
(52.1%)
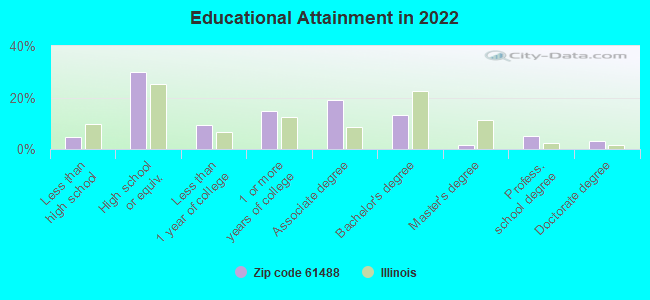
For population 25 years and over in 61488:
High school or higher: 94.9%
Bachelor's degree or higher: 22.9%
Graduate or professional degree: 9.7%
Unemployed: 1.4%
Mean travel time to work (commute): 18.6 minutes
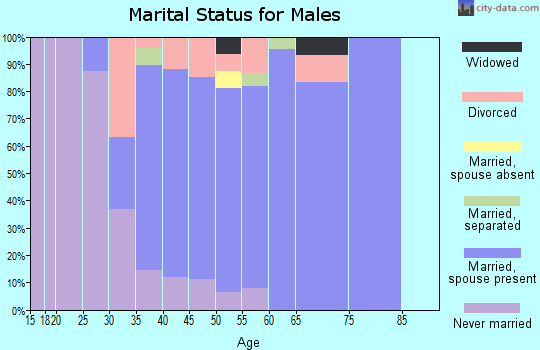
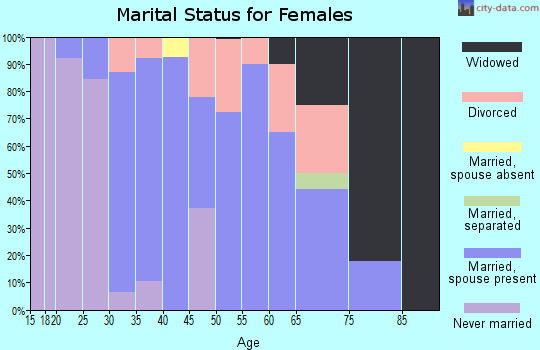
For population 15 years and over in 61488:
Never married: 23.0%
Now married: 54.9%
Separated: 0.2%
Widowed: 12.4%
Divorced: 9.5%
Zip code 61488 compared to state average:
Median house value below state average.
Unemployed percentage significantly below state average.
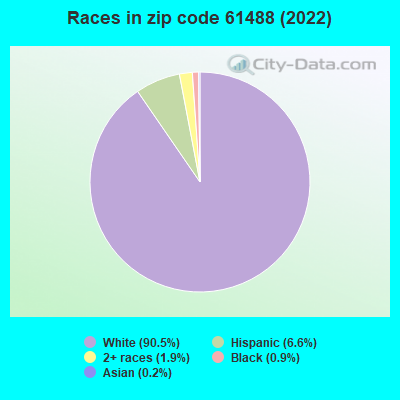
Black race population percentage significantly below state average.
Hispanic race population percentage below state average.
Foreign-born population percentage significantly below state average.
Renting percentage below state average.
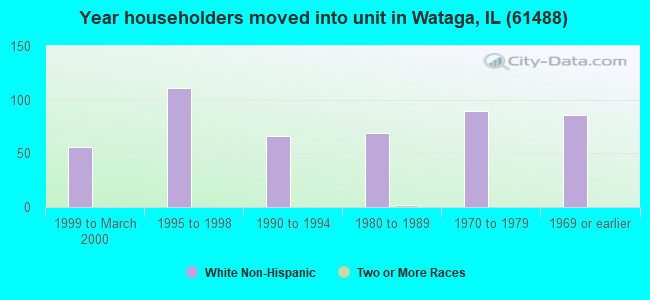
Length of stay since moving in significantly above state average.
Number of college students significantly below state average.
Percentage of population with a bachelor's degree or higher below state average.
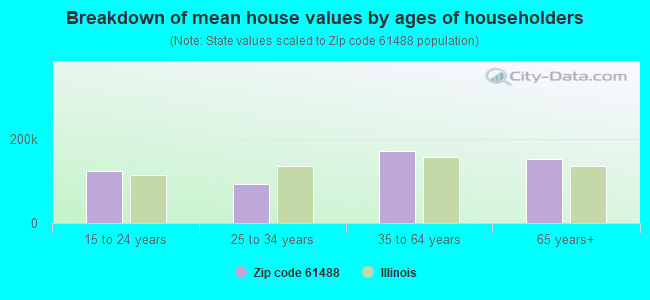
Estimated median house/condo value in 2022: $125,221
61488:
$125,221
Illinois:
$251,600
Median resident age:
This zip code:
40.1 years
Illinois median age:
39.1 years
Average household size:
This zip code:
2.3 people
Illinois:
2.4 people
Averages for the 2020 tax year for zip code 61488, filed in 2021:
Average Adjusted Gross Income (AGI) in 2020: $60,192 (Individual Income Tax Returns)
Here:
$60,192
State:
$82,626
Salary/wage: $49,002 (reported on 80.4% of returns)
Here:
$49,002
State:
$66,640
(% of AGI for various income ranges: 980.9% for AGIs below $25k, 3148.3% for AGIs $25k-50k, 5190.0% for AGIs $50k-75k, 7550.0% for AGIs $75k-100k, 17634.0% for AGIs $100k-200k)
Taxable interest for individuals: $567 (reported on 35.3% of returns)
This zip code:
$567
Illinois:
$2,376
(% of AGI for various income ranges: 22.7% for AGIs below $25k, 4.2% for AGIs $25k-50k, 55.0% for AGIs $50k-75k, 56.0% for AGIs $100k-200k)
Ordinary dividends: $1,489 (reported on 17.6% of returns)
Here:
$1,489
State:
$9,061
(% of AGI for various income ranges: 23.6% for AGIs below $25k, 60.0% for AGIs $50k-75k, 120.0% for AGIs $100k-200k)
Net capital gain/loss in AGI: +$1,771 (reported on 13.7% of returns)
Here:
+$1,771
State:
+$31,684
(% of AGI for various income ranges: 25.0% for AGIs $50k-75k, 208.0% for AGIs $100k-200k)
Profit/loss from business: +$11,020 (reported on 9.8% of returns)
Here:
+$11,020
State:
+$12,175
(% of AGI for various income ranges: 166.4% for AGIs below $25k, 460.0% for AGIs $50k-75k)
Taxable individual retirement arrangement distribution: $9,483 (reported on 11.8% of returns)
61488:
$9,483
Illinois:
$21,613
(% of AGI for various income ranges: 99.1% for AGIs below $25k, 165.0% for AGIs $25k-50k, 873.3% for AGIs $75k-100k)
Earned income credit: $2,300 (reported on 15.7% of returns)
Here:
$2,300
State:
$2,311
(% of AGI for various income ranges: 96.4% for AGIs below $25k, 65.0% for AGIs $25k-50k)
Percentage of individuals using paid preparers for their 2020 taxes: 96.1%
Here:
96%
State:
93%
(% for various income ranges: 100.0% for AGIs below $25k, 92.9% for AGIs $25k-50k, 90.0% for AGIs $50k-75k, 100.0% for AGIs $75k-100k, 100.0% for AGIs $100k-200k)
Averages for the 2012 tax year for zip code 61488, filed in 2013:
Average Adjusted Gross Income (AGI) in 2012: $50,611 (Individual Income Tax Returns)
Here:
$50,611
State:
$68,058
Salary/wage: $38,959 (reported on 81.5% of returns)
Here:
$38,959
State:
$55,396
(% of AGI for various income ranges: 70.1% for AGIs below $25k, 74.3% for AGIs $25k-50k, 71.0% for AGIs $50k-75k, 74.6% for AGIs $75k-100k, 44.8% for AGIs $100k-200k)
Taxable interest for individuals: $620 (reported on 37.0% of returns)
This zip code:
$620
Illinois:
$1,969
(% of AGI for various income ranges: 0.6% for AGIs below $25k, 0.7% for AGIs $25k-50k, 0.5% for AGIs $50k-75k, 0.2% for AGIs $75k-100k, 0.4% for AGIs $100k-200k)
Ordinary dividends: $1,250 (reported on 14.8% of returns)
Here:
$1,250
State:
$7,786
(% of AGI for various income ranges: 0.7% for AGIs below $25k, 1.4% for AGIs $50k-75k, 0.2% for AGIs $100k-200k)
Profit/loss from business: +$5,500 (reported on 13.0% of returns)
Here:
+$5,500
State:
+$12,903
Taxable individual retirement arrangement distribution: $7,540 (reported on 9.3% of returns)
61488:
$7,540
Illinois:
$17,929
Total itemized deductions: $17,950 (16% of AGI, reported on 18.5% of returns)
Here:
$17,950
State:
$26,433
Here:
16.1% of AGI
State:
19.2% of AGI
(% of AGI for various income ranges: 11.7% for AGIs $25k-50k, 6.4% for AGIs $75k-100k, 8.9% for AGIs $100k-200k)
Charity contributions: $3,571 (reported on 13.0% of returns)
Here:
$3,571
State:
$4,525
Taxes paid: $6,370 (reported on 18.5% of returns)
61488:
$6,370
State:
$11,968
(% of AGI for various income ranges: 3.2% for AGIs $25k-50k, 2.3% for AGIs $75k-100k, 3.6% for AGIs $100k-200k)
Earned income credit: $2,230 (reported on 18.5% of returns)
Here:
$2,230
State:
$2,349
(% of AGI for various income ranges: 6.8% for AGIs below $25k, 0.9% for AGIs $25k-50k)
Percentage of individuals using paid preparers for their 2012 taxes: 55.6%
Here:
56%
State:
57%
(% for various income ranges: 47.6% for AGIs below $25k, 53.8% for AGIs $25k-50k, 57.1% for AGIs $50k-75k, 71.4% for AGIs $75k-100k, 66.7% for AGIs $100k-200k)
Averages for the 2004 tax year for zip code 61488, filed in 2005:
Average Adjusted Gross Income (AGI) in 2004: $37,651 (Individual Income Tax Returns)
Here:
$37,651
State:
$54,625
Salary/wage: $31,670 (reported on 84.7% of returns)
Here:
$31,670
State:
$46,811
(% of AGI for various income ranges: 100.9% for AGIs below $10k, 68.2% for AGIs $10k-25k, 75.2% for AGIs $25k-50k, 80.4% for AGIs $50k-75k, 78.5% for AGIs $75k-100k, 33.1% for AGIs over 100k)
Taxable interest for individuals: $777 (reported on 43.8% of returns)
This zip code:
$777
Illinois:
$2,101
(% of AGI for various income ranges: 4.0% for AGIs below $10k, 1.2% for AGIs $10k-25k, 1.6% for AGIs $25k-50k, 0.5% for AGIs $50k-75k, 0.6% for AGIs $75k-100k, 0.3% for AGIs over 100k)
Taxable dividends: $658 (reported on 21.0% of returns)
Here:
$658
State:
$4,306
(% of AGI for various income ranges: 0.4% for AGIs below $10k, 0.4% for AGIs $10k-25k, 0.6% for AGIs $25k-50k, 0.4% for AGIs $50k-75k, 0.4% for AGIs $75k-100k)
Net capital gain/loss: +$318 (reported on 15.6% of returns)
Here:
+$318
State:
+$17,321
(% of AGI for various income ranges: -0.1% for AGIs $10k-25k, 0.1% for AGIs $25k-50k, 0.2% for AGIs $50k-75k, 0.4% for AGIs $75k-100k)
Profit/loss from business: +$1,789 (reported on 10.5% of returns)
Here:
+$1,789
State:
+$11,771
(% of AGI for various income ranges: 1.1% for AGIs below $10k, 3.7% for AGIs $10k-25k, 1.2% for AGIs $25k-50k, -0.7% for AGIs $50k-75k)
Profit/loss from farming: +$8,900 (reported on 1.8% of returns)
Here:
+$8,900
State:
+$2,327
Total itemized deductions: $15,719 (22% of AGI, reported on 17.6% of returns)
Here:
$15,719
State:
$20,239
Here:
21.7% of AGI
State:
19.5% of AGI
(% of AGI for various income ranges: 7.2% for AGIs $10k-25k, 6.1% for AGIs $25k-50k, 7.0% for AGIs $50k-75k, 18.0% for AGIs $75k-100k)
Charity contributions deductions: $1,922 (3% of AGI, reported on 14.2% of returns)
Here:
$1,922
State:
$3,719
Here:
3.1% of AGI
State:
3.4% of AGI
(% of AGI for various income ranges: 0.9% for AGIs $10k-25k, 0.3% for AGIs $25k-50k, 0.9% for AGIs $50k-75k, 1.6% for AGIs $75k-100k)
Total tax: $4,431 (reported on 74.6% of returns)
61488:
$4,431
State:
$9,882
(% of AGI for various income ranges: 2.7% for AGIs below $10k, 3.7% for AGIs $10k-25k, 7.1% for AGIs $25k-50k, 8.9% for AGIs $50k-75k, 11.4% for AGIs $75k-100k, 13.6% for AGIs over 100k)
Earned income credit: $1,591 (reported on 16.2% of returns)
Here:
$1,591
State:
$1,788
Percentage of individuals using paid preparers for their 2004 taxes: 61.4%
Here:
61%
State:
61%
(% for various income ranges: 44.8% for AGIs below $10k, 55.6% for AGIs $10k-25k, 70.1% for AGIs $25k-50k, 68.8% for AGIs $50k-75k, 70.3% for AGIs $75k-100k, 86.7% for AGIs over 100k)
Household received Food Stamps/SNAP in the past 12 months: 62 Household did not receive Food Stamps/SNAP in the past 12 months: 492
Women who had a birth in the past 12 months: 17 (1 now married, 15 unmarried) Women who did not have a birth in the past 12 months: 213 (141 now married, 70 unmarried)
Housing units in zip code 61488 with a mortgage: 260 (7 second mortgage, 8 both second mortgage and home equity loan) Median monthly owner costs for units with a mortgage: $1,040 Median monthly owner costs for units without a mortgage: $531
Residents with income below the poverty level in 2022:
This zip code:
10.7%
Whole state:
11.9%
Residents with income below 50% of the poverty level in 2022:
This zip code:
4.3%
Whole state:
5.7%
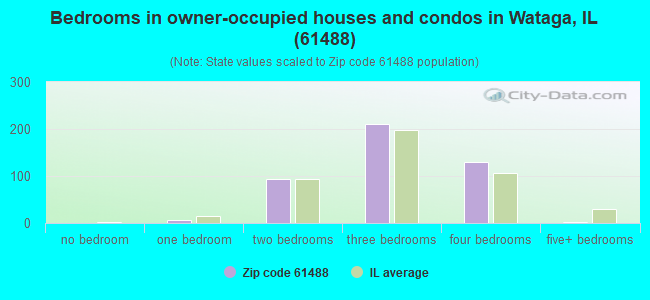
Median number of rooms in houses and condos:
Here:
6.6
State:
6.4
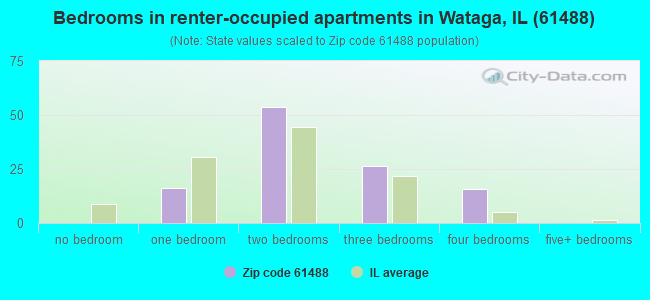
Median number of rooms in apartments:
Here:
4.6
State:
4.1
Notable locations in this zip code not listed on our city pages
Size of family households: 213 2-persons, 48 3-persons, 16 4-persons, 67 5-persons, 15 7-or-more-persons
Size of nonfamily households: 157 1-person, 37 2-persons
134 married couples with children.
84 single-parent households (17 men, 67 women).
99.7% of residents of 61488 zip code speak English at home.
0.1% of residents speak Asian or Pacific Island language at home (100% very well).
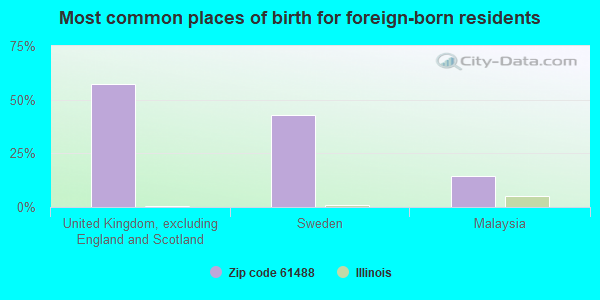
Foreign born population: 7 (0.6%) (71.6% of them are naturalized citizens)
This zip code:
0.6%
Whole state:
14.4%
57%United Kingdom, excluding England and Scotland
43%Sweden
14%Malaysia
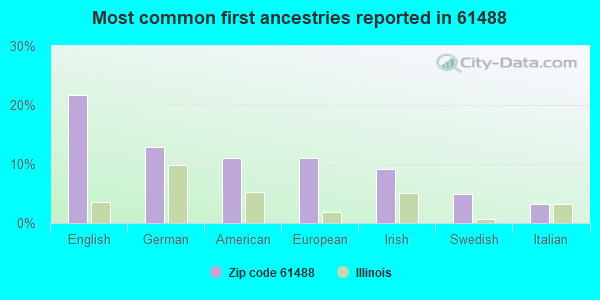
22%English
13%German
11%American
11%European
9%Irish
5%Swedish
3%Italian
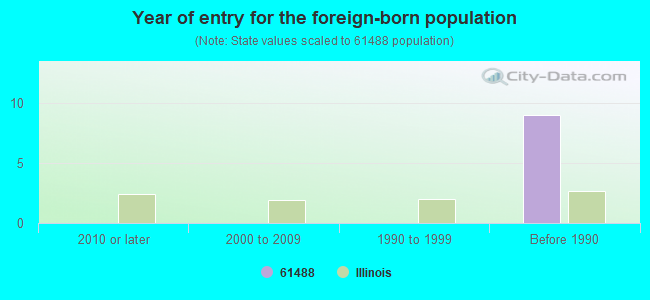
Year of entry for the foreign-born population
02010 or later
02000 to 2009
01990 to 1999
9Before 1990
Facilities with environmental interests located in this zip code:
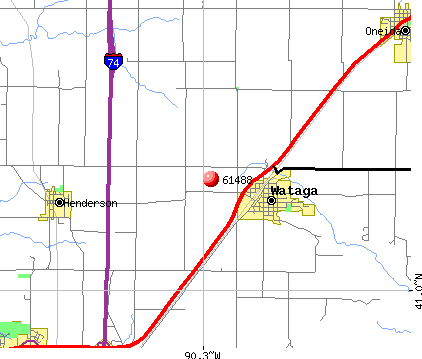
KNOX COUNTY LANDFILL (996 KNOX ROAD 2150 NORTH, BOX in WATAGA, IL)
STATE MASTER (Illinois EPA Project) - SCRAP TIRE MANAGEMENT, SOLID WASTE PROGRAM CRITERIA AND HAZARDOUS AIR POLLUTANT INVENTORY (Inventory of air pollution sources) Business SIC classification: REFUSE SYSTEMS Business NAICS classification: SOLID WASTE LANDFILL. Alternative names: KNOX COUNTY LANDFILL #3
COTTOM'S TRUCKING (895 IL RTE. 167 in WATAGA, IL)
National Pollutant Discharge Elimination System NON-MAJOR (Tracking pollutant discharge elimination systems) - permit
BOOTH TRUCKING DBA?JIM (RTE. 150 NORTH - 3 MI. NORTH in WATAGA, IL)
National Pollutant Discharge Elimination System NON-MAJOR (Tracking pollutant discharge elimination systems) - permit Alternative names: BOOTH, JIM TRUCKING
Housing units lacking complete plumbing facilities: 3.6% Housing units lacking complete kitchen facilities: 2.2%
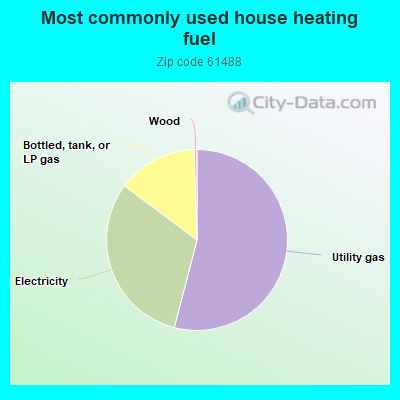
54.1%Utility gas
31.2%Electricity
14.3%Bottled, tank, or LP gas
0.5%Wood
Population in 1990: 1,197. Population change in the 1990s: +2 (+0.2%).
Place of birth for U.S.-born residents:
This state: 951
Northeast: 123
Midwest: 140
South: 10
West: 30
66% of the 61488 zip code residents lived in the same house 5 years ago. Out of people who lived in different houses, 54% lived in this county. Out of people who lived in different counties, 50% lived in Illinois.
98% of the 61488 zip code residents lived in the same house 1 year ago. Out of people who lived in different houses, 82% moved from this county. Out of people who lived in different houses, 9% moved from different county within same state. Out of people who lived in different houses, 5% moved from different state.
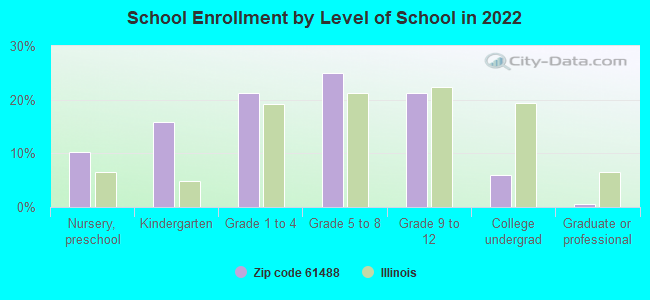
Private vs. public school enrollment:
Students in private schools in grades 1 to 8 (elementary and middle school):
Here:
0.0%
Illinois:
13.3%
Students in private schools in grades 9 to 12 (high school): 7
Here:
19.5%
Illinois:
9.9%
Students in private undergraduate colleges:
Here:
0.0%
Illinois:
27.4%
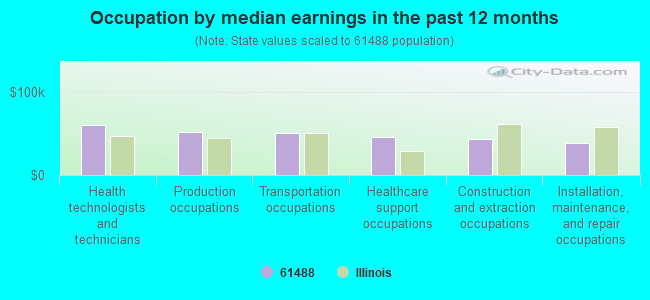
Occupation by median earnings in the past 12 months ($)
60,236Health technologists and technicians
51,224Production occupations
50,522Transportation occupations
45,568Healthcare support occupations
43,149Construction and extraction occupations
39,096Installation, maintenance, and repair occupations
Top industries in this zip code by the number of employees in 2005:
Wholesale Trade: Farm and Garden Machinery and Equipment Merchant Wholesalers (20-49 employees: 1 establishment, 5-9 employees: 1 establishment)
Other Services (except Public Administration): General Automotive Repair (5-9: 1, 1-4: 1)
Information: Newspaper Publishers (5-9: 1)
Other Services (except Public Administration): Labor Unions and Similar Labor Organizations (1-4: 2)
Construction: Siding Contractors (1-4: 1)
2006 - 2018 National Fire Incident Reporting System (NFIRS) incidents
According to the data from the years 2006 - 2018 the average number of fires per year is 11. The highest number of fires - 19 took place in 2017, and the least - 0 in 2007. The data has a growing trend.
When looking into fire subcategories, the most incidents belonged to: Outside Fires (51.8%), and Structure Fires (30.9%).
Fire incident types reported to NFIRS in Zip Code 61488
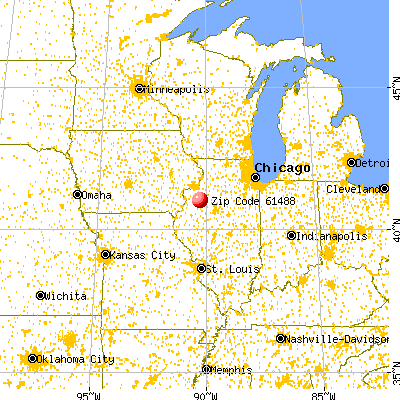


 Nearest zip codes: 61439, 61467, 61430, 61472, 61401, 61448.


 According to the data from the years 2006 - 2018 the average number of fires per year is 11. The highest number of fires - 19 took place in 2017, and the least - 0 in 2007. The data has a growing trend.
 When looking into fire subcategories, the most incidents belonged to: Outside Fires (51.8%), and Structure Fires (30.9%).