Estimated zip code population in 2022: 1,226 Zip code population in 2010: 1,048 Zip code population in 2000: 1,241
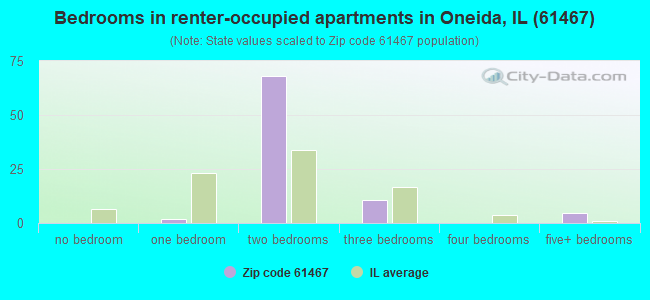
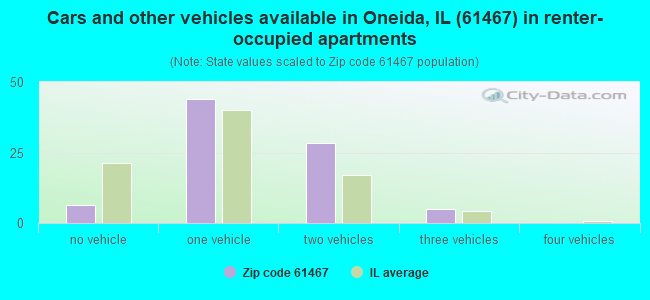
Houses and condos: 468 Renter-occupied apartments: 84
% of renters here:
19%
State:
33%
March 2022 cost of living index in zip code 61467: 84.1 (less than average, U.S. average is 100)
Land area: 49.4 sq. mi. Water area: 0.2 sq. mi.
Population density: 25 people per square mile
(very low).
OSM Map
General Map
Google Map
MSN Map
OSM Map
General Map
Google Map
MSN Map
OSM Map
General Map
Google Map
MSN Map
OSM Map
General Map
Google Map
MSN Map
Please wait while loading the map...
Real estate property taxes paid for housing units in 2022:
This zip code:
1.7% ($2,161)
Illinois:
2.0% ($4,912)
Median real estate property taxes paid for housing units with mortgages in 2022: $2,725 (2.1%) Median real estate property taxes paid for housing units with no mortgage in 2022: $1,891 (1.6%)
Business Search- 14 Million verified businesses
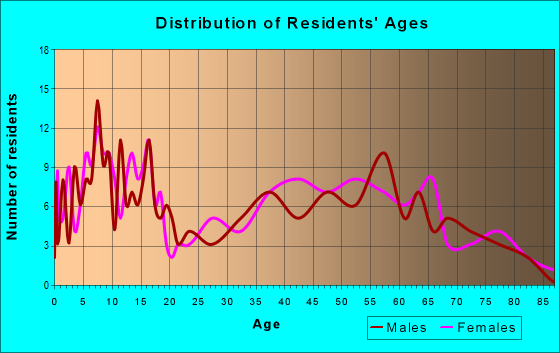
Males: 576
(47.0%)
Females: 650
(53.0%)
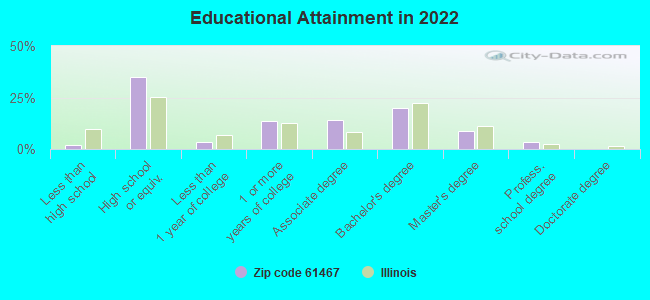
For population 25 years and over in 61467:
High school or higher: 97.9%
Bachelor's degree or higher: 31.8%
Graduate or professional degree: 12.1%
Unemployed: 6.0%
Mean travel time to work (commute): 27.4 minutes
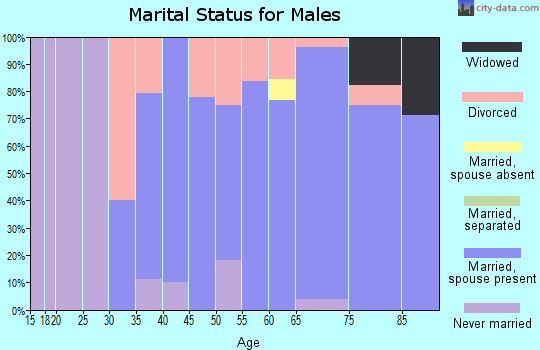
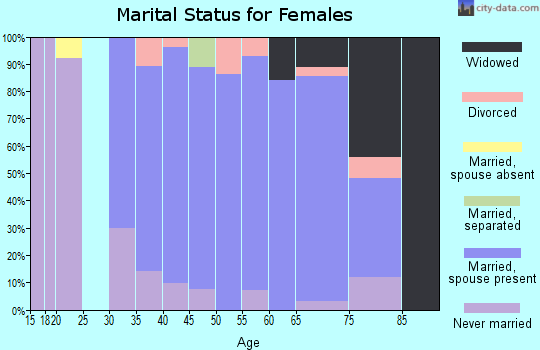
For population 15 years and over in 61467:
Never married: 29.2%
Now married: 58.2%
Separated: 0.7%
Widowed: 5.4%
Divorced: 6.5%
Zip code 61467 compared to state average:
Median house value below state average.
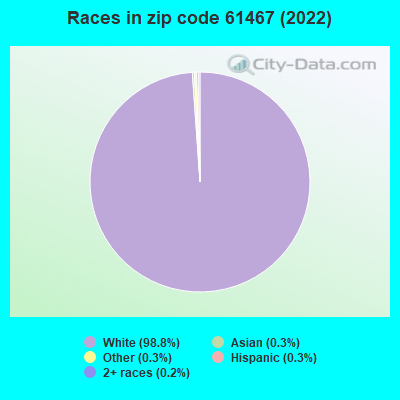
Black race population percentage significantly below state average.
Hispanic race population percentage significantly below state average.
Foreign-born population percentage significantly below state average.
Estimated median house/condo value in 2022: $125,116
61467:
$125,116
Illinois:
$251,600
Median resident age:
This zip code:
38.6 years
Illinois median age:
39.1 years
Average household size:
This zip code:
2.7 people
Illinois:
2.4 people
Averages for the 2020 tax year for zip code 61467, filed in 2021:
Average Adjusted Gross Income (AGI) in 2020: $61,487 (Individual Income Tax Returns)
Here:
$61,487
State:
$82,626
Salary/wage: $50,807 (reported on 81.1% of returns)
Here:
$50,807
State:
$66,640
(% of AGI for various income ranges: 1140.0% for AGIs below $25k, 3378.9% for AGIs $25k-50k, 5763.8% for AGIs $50k-75k, 8335.0% for AGIs $75k-100k, 19214.0% for AGIs $100k-200k)
Taxable interest for individuals: $470 (reported on 43.4% of returns)
This zip code:
$470
Illinois:
$2,376
(% of AGI for various income ranges: 10.0% for AGIs below $25k, 33.3% for AGIs $25k-50k, 12.5% for AGIs $50k-75k, 52.5% for AGIs $75k-100k, 72.0% for AGIs $100k-200k)
Ordinary dividends: $2,317 (reported on 22.6% of returns)
Here:
$2,317
State:
$9,061
(% of AGI for various income ranges: 13.6% for AGIs below $25k, 48.9% for AGIs $25k-50k, 65.0% for AGIs $50k-75k, 334.0% for AGIs $100k-200k)
Net capital gain/loss in AGI: +$3,925 (reported on 15.1% of returns)
Here:
+$3,925
State:
+$31,684
(% of AGI for various income ranges: 34.4% for AGIs $25k-50k, 370.0% for AGIs $75k-100k, 270.0% for AGIs $100k-200k)
Profit/loss from business: +$11,729 (reported on 13.2% of returns)
Here:
+$11,729
State:
+$12,175
(% of AGI for various income ranges: 318.9% for AGIs $25k-50k, 1335.0% for AGIs $75k-100k)
Taxable individual retirement arrangement distribution: $15,183 (reported on 11.3% of returns)
61467:
$15,183
Illinois:
$21,613
(% of AGI for various income ranges: 378.9% for AGIs $25k-50k, 1425.0% for AGIs $75k-100k)
Earned income credit: $1,750 (reported on 11.3% of returns)
Here:
$1,750
State:
$2,311
(% of AGI for various income ranges: 42.7% for AGIs below $25k, 64.4% for AGIs $25k-50k)
Percentage of individuals using paid preparers for their 2020 taxes: 96.2%
Here:
96%
State:
93%
(% for various income ranges: 93.3% for AGIs below $25k, 100.0% for AGIs $25k-50k, 100.0% for AGIs $50k-75k, 100.0% for AGIs $75k-100k, 90.0% for AGIs $100k-200k)
Averages for the 2012 tax year for zip code 61467, filed in 2013:
Average Adjusted Gross Income (AGI) in 2012: $56,557 (Individual Income Tax Returns)
Here:
$56,557
State:
$68,058
Salary/wage: $42,960 (reported on 79.6% of returns)
Here:
$42,960
State:
$55,396
(% of AGI for various income ranges: 74.5% for AGIs below $25k, 72.0% for AGIs $25k-50k, 69.1% for AGIs $50k-75k, 73.1% for AGIs $75k-100k, 46.5% for AGIs $100k-200k)
Taxable interest for individuals: $955 (reported on 40.7% of returns)
This zip code:
$955
Illinois:
$1,969
(% of AGI for various income ranges: 1.0% for AGIs below $25k, 0.8% for AGIs $25k-50k, 1.1% for AGIs $50k-75k, 0.4% for AGIs $75k-100k, 0.6% for AGIs $100k-200k)
Ordinary dividends: $2,445 (reported on 20.4% of returns)
Here:
$2,445
State:
$7,786
(% of AGI for various income ranges: 1.7% for AGIs below $25k, 0.9% for AGIs $50k-75k, 1.4% for AGIs $100k-200k)
Net capital gain/loss in AGI: +$783 (reported on 11.1% of returns)
Here:
+$783
State:
+$22,183
(% of AGI for various income ranges: 0.2% for AGIs below $25k, 0.7% for AGIs $25k-50k, 0.2% for AGIs $75k-100k)
Profit/loss from business: +$13,614 (reported on 13.0% of returns)
Here:
+$13,614
State:
+$12,903
Taxable individual retirement arrangement distribution: $12,033 (reported on 11.1% of returns)
61467:
$12,033
Illinois:
$17,929
(% of AGI for various income ranges: 4.2% for AGIs below $25k, 3.7% for AGIs $25k-50k, 9.6% for AGIs $75k-100k)
Total itemized deductions: $17,555 (16% of AGI, reported on 20.4% of returns)
Here:
$17,555
State:
$26,433
Here:
15.9% of AGI
State:
19.2% of AGI
(% of AGI for various income ranges: 12.9% for AGIs below $25k, 9.8% for AGIs $50k-75k, 8.4% for AGIs $100k-200k)
Charity contributions: $4,129 (reported on 13.0% of returns)
Here:
$4,129
State:
$4,525
Taxes paid: $6,809 (reported on 20.4% of returns)
61467:
$6,809
State:
$11,968
(% of AGI for various income ranges: 2.9% for AGIs below $25k, 3.9% for AGIs $50k-75k, 3.6% for AGIs $100k-200k)
Earned income credit: $2,083 (reported on 11.1% of returns)
Here:
$2,083
State:
$2,349
(% of AGI for various income ranges: 3.5% for AGIs below $25k, 1.2% for AGIs $25k-50k)
Percentage of individuals using paid preparers for their 2012 taxes: 66.7%
Here:
67%
State:
57%
(% for various income ranges: 58.8% for AGIs below $25k, 61.5% for AGIs $25k-50k, 66.7% for AGIs $50k-75k, 83.3% for AGIs $75k-100k, 77.8% for AGIs $100k-200k)
Averages for the 2004 tax year for zip code 61467, filed in 2005:
Average Adjusted Gross Income (AGI) in 2004: $37,515 (Individual Income Tax Returns)
Here:
$37,515
State:
$54,625
Salary/wage: $33,147 (reported on 79.6% of returns)
Here:
$33,147
State:
$46,811
(% of AGI for various income ranges: 117.6% for AGIs below $10k, 63.8% for AGIs $10k-25k, 68.1% for AGIs $25k-50k, 73.0% for AGIs $50k-75k, 72.3% for AGIs $75k-100k, 62.1% for AGIs over 100k)
Taxable interest for individuals: $1,134 (reported on 57.3% of returns)
This zip code:
$1,134
Illinois:
$2,101
(% of AGI for various income ranges: 13.5% for AGIs below $10k, 3.1% for AGIs $10k-25k, 1.4% for AGIs $25k-50k, 1.1% for AGIs $50k-75k, 1.9% for AGIs $75k-100k, 1.2% for AGIs over 100k)
Taxable dividends: $1,098 (reported on 29.4% of returns)
Here:
$1,098
State:
$4,306
(% of AGI for various income ranges: 4.1% for AGIs below $10k, 2.0% for AGIs $10k-25k, 0.9% for AGIs $25k-50k, 0.7% for AGIs $50k-75k, 0.7% for AGIs $75k-100k)
Net capital gain/loss: +$282 (reported on 16.3% of returns)
Here:
+$282
State:
+$17,321
(% of AGI for various income ranges: -3.5% for AGIs below $10k, 0.2% for AGIs $10k-25k, -0.2% for AGIs $25k-50k, 0.2% for AGIs $50k-75k, 0.7% for AGIs $75k-100k)
Profit/loss from business: +$4,106 (reported on 12.7% of returns)
Here:
+$4,106
State:
+$11,771
(% of AGI for various income ranges: -1.3% for AGIs $10k-25k, 3.8% for AGIs $25k-50k, 0.7% for AGIs $50k-75k, 1.7% for AGIs $75k-100k)
Profit/loss from farming: +$5,366 (reported on 7.9% of returns)
Here:
+$5,366
State:
+$2,327
(% of AGI for various income ranges: 1.7% for AGIs $10k-25k, 3.2% for AGIs $50k-75k, -0.5% for AGIs $75k-100k)
IRA payment deduction: $2,000 (reported on 1.9% of returns)
61467:
$2,000
Illinois:
$3,087
Total itemized deductions: $12,943 (23% of AGI, reported on 16.9% of returns)
Here:
$12,943
State:
$20,239
Here:
22.7% of AGI
State:
19.5% of AGI
(% of AGI for various income ranges: 8.5% for AGIs $10k-25k, 7.4% for AGIs $25k-50k, 4.4% for AGIs $50k-75k, 8.5% for AGIs $75k-100k)
Charity contributions deductions: $2,725 (5% of AGI, reported on 13.3% of returns)
Here:
$2,725
State:
$3,719
Here:
4.8% of AGI
State:
3.4% of AGI
(% of AGI for various income ranges: 6.0% for AGIs below $10k, 1.1% for AGIs $25k-50k, 0.9% for AGIs $50k-75k, 1.4% for AGIs $75k-100k)
Total tax: $4,380 (reported on 78.5% of returns)
61467:
$4,380
State:
$9,882
(% of AGI for various income ranges: 5.7% for AGIs below $10k, 4.5% for AGIs $10k-25k, 6.4% for AGIs $25k-50k, 8.4% for AGIs $50k-75k, 11.5% for AGIs $75k-100k, 18.2% for AGIs over 100k)
Earned income credit: $1,816 (reported on 9.4% of returns)
Here:
$1,816
State:
$1,788
Percentage of individuals using paid preparers for their 2004 taxes: 65.8%
Here:
66%
State:
61%
(% for various income ranges: 54.5% for AGIs below $10k, 61.6% for AGIs $10k-25k, 70.6% for AGIs $25k-50k, 72.2% for AGIs $50k-75k, 72.3% for AGIs $75k-100k, 70.6% for AGIs over 100k)
Household received Food Stamps/SNAP in the past 12 months: 62 Household did not receive Food Stamps/SNAP in the past 12 months: 385
Women who had a birth in the past 12 months: 3 (1 now married, 1 unmarried) Women who did not have a birth in the past 12 months: 365 (198 now married, 165 unmarried)
Housing units in zip code 61467 with a mortgage: 212 (3 second mortgage, 1 both second mortgage and home equity loan) Median monthly owner costs for units with a mortgage: $1,161 Median monthly owner costs for units without a mortgage: $575
Residents with income below the poverty level in 2022:
This zip code:
2.0%
Whole state:
11.9%
Residents with income below 50% of the poverty level in 2022:
This zip code:
1.7%
Whole state:
5.7%
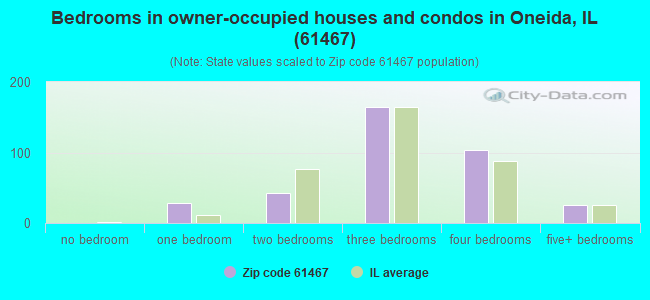
Median number of rooms in houses and condos:
Here:
7.2
State:
6.4
Median number of rooms in apartments:
Here:
4.3
State:
4.1
Notable locations in this zip code not listed on our city pages
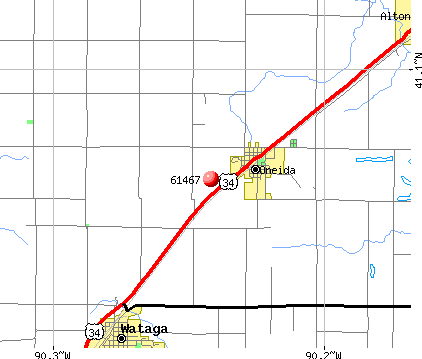
Notable locations in zip code 61467: Knox County Landfill (A), Oneida - Wataga Fire Protection District (B), Altona - Oneida - Wataga Ambulance Service (C), Oneida - Wataga Fire Protection District (D). Display/hide their locations on the map
Size of family households: 118 2-persons, 83 3-persons, 40 4-persons, 48 5-persons, 32 6-persons
Size of nonfamily households: 115 1-person, 5 3-persons
312 married couples with children.
56 single-parent households (14 men, 42 women).
98.8% of residents of 61467 zip code speak English at home.
0.2% of residents speak other Indo-European language at home (100% very well).
Foreign born population: 0 (0.0%)
:
0.0%
Whole state:
14.4%
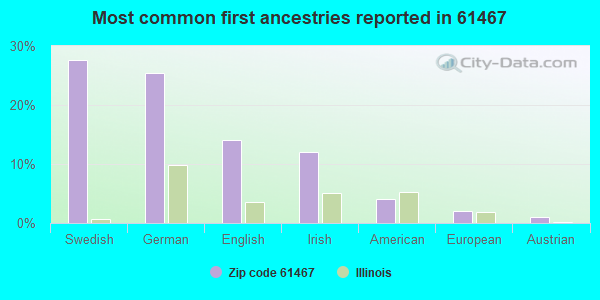
28%Swedish
25%German
14%English
12%Irish
4%American
2%European
1%Austrian
Facilities with environmental interests located in this zip code:
ONEIDA SD NORTH STP (1/4 MILE NORTH OF THE CITY in ONEIDA, IL)
STATE MASTER (Illinois EPA Project) - National Pollutant Discharge Elimination System Permit National Pollutant Discharge Elimination System NON-MAJOR (Tracking pollutant discharge elimination systems) - permit National Pollutant Discharge Elimination System NON-MAJOR (Tracking pollutant discharge elimination systems) - permit Business SIC classification: SEWERAGE SYSTEMS Alternative names: ONEIDA NORTH STP, ONEIDA SANITARY DISTRICT-NORTH
ONEIDA SOUTH SD STP (SOUTHWEST CORNER OF THE CITY in ONEIDA, IL)
STATE MASTER (Illinois EPA Project) - National Pollutant Discharge Elimination System Permit National Pollutant Discharge Elimination System NON-MAJOR (Tracking pollutant discharge elimination systems) - permit National Pollutant Discharge Elimination System NON-MAJOR (Tracking pollutant discharge elimination systems) - permit Business SIC classification: SEWERAGE SYSTEMS Alternative names: ONEIDA SANITARY DISTRICT-SOUTH, ONEIDA SD SOUTH STP, CITY OF, ONEIDA SD STP, ONEIDA SD STP, CITY OF, ONEIDA SOUTH STP
KNOX COUNTY LANDFILL (996 KNOX RD 2150 N in ONEIDA, IL)
STATE MASTER (Illinois EPA Project) - SOLID WASTE PROGRAM, AIR PROGRAM, National Pollutant Discharge Elimination System Permit AIR MINOR (AIRS/AFS) CRITERIA AND HAZARDOUS AIR POLLUTANT INVENTORY (Inventory of air pollution sources) Business SIC classification: REFUSE SYSTEMS Alternative names: KNOX COUNTY LANDFILLE
K & L GRAIN CO (478 NORTH WASHINGTON in ONEIDA, IL)
STATE MASTER (Illinois EPA Project) - AIR PROGRAM AIR MINOR (AIRS/AFS) Business SIC classification: GRAIN AND FIELD BEANS
ONEIDA AUTO BODY (RTE 34 in ONEIDA, IL)
STATE MASTER (Illinois EPA Project) - HAZARDOUS WASTE PROGRAM Small Quantity Generators, between 100 kg and 1000 kg of hazardous waste/month (Resource Conservation and Recovery Act (tracking hazardous waste)) - notification Organizations: FELL KENNETH E (CONTACT/OWNER)
ONEIDA ELEM SCHOOL (PO BOX 69 in ONEIDA, IL)
(National Center for Education Statistics) - STATE ID-3304820802001 Organizations: R O W V A COMM UNIT SCH DIST 208 (SCHOOL DISTRICT)
R O W V A JR HIGH SCHOOL (PO BOX 69 in ONEIDA, IL)
(National Center for Education Statistics) - STATE ID-3304820801001 Organizations: R O W V A COMM UNIT SCH DIST 208 (SCHOOL DISTRICT)
R O W V A SR HIGH SCHOOL (P O BOX 69 in ONEIDA, IL)
(National Center for Education Statistics) - STATE ID-3304820800001 Organizations: R O W V A COMM UNIT SCH DIST 208 (SCHOOL DISTRICT)
CROP PRODUCTION SERVICES (611 EAST ONTARIO in ONEIDA, IL)
ENFORCEMENT/COMPLIANCE ACTIVITY (Integrated Compliance Information System) (Resource Conservation and Recovery Act (tracking hazardous waste)) Organizations: CROP PRODUCTION SERVICES INC (CONTACT/OWNER)
Alternative names: C P S FARM CENTER ONEIDA
ROVWA COMMUNITY UNIT SCH DIST #208 (P O BOX 69 in ONEIDA, IL)
COMPLIANCE ACTIVITY (Tracking inspections of insecticide, fungicide, and rodenticide, and toxic substances)
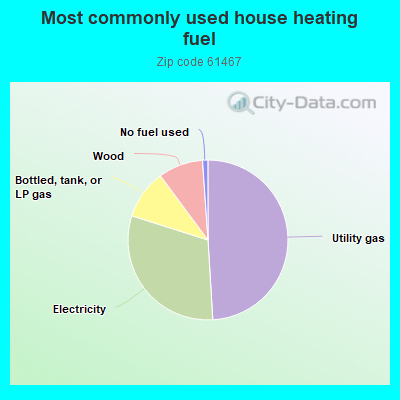
49.3%Utility gas
31.0%Electricity
10.0%Bottled, tank, or LP gas
9.1%Wood
1.1%No fuel used
Population in 1990: 1,122. Population change in the 1990s: +119 (+10.6%).
Place of birth for U.S.-born residents:
This state: 1,070
Midwest: 126
South: 18
West: 7
63% of the 61467 zip code residents lived in the same house 5 years ago. Out of people who lived in different houses, 62% lived in this county. Out of people who lived in different counties, 50% lived in Illinois.
99% of the 61467 zip code residents lived in the same house 1 year ago. Out of people who lived in different houses, 100% moved from this county.
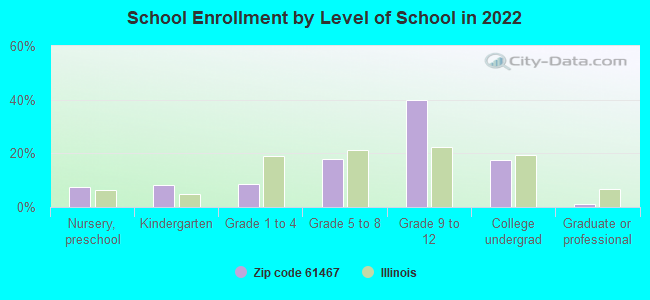
Private vs. public school enrollment:
Students in private schools in grades 1 to 8 (elementary and middle school): 4
Here:
3.8%
Illinois:
13.3%
Students in private schools in grades 9 to 12 (high school): 4
Here:
3.0%
Illinois:
9.9%
Students in private undergraduate colleges:
Here:
1.3%
Illinois:
27.4%
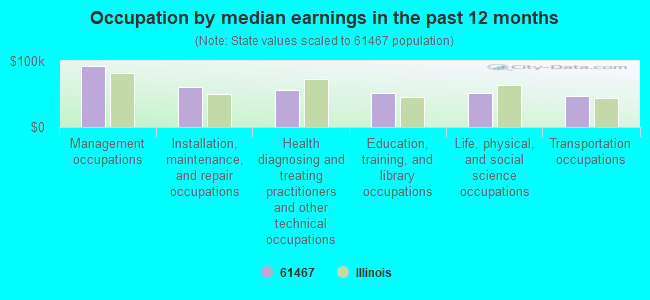
Occupation by median earnings in the past 12 months ($)
91,851Management occupations
60,422Installation, maintenance, and repair occupations
56,499Health diagnosing and treating practitioners and other technical occupations
51,835Education, training, and library occupations
51,169Life, physical, and social science occupations
46,768Transportation occupations
Top industries in this zip code by the number of employees in 2005:
Finance and Insurance: Commercial Banking (10-19 employees: 1 establishment)
Wholesale Trade: Electrical Apparatus and Equipment, Wiring Supplies, and Related Equipment Merchant Wholesalers (5-9: 1)
Construction: Masonry Contractors (1-4: 2)
Construction: New Single-Family Housing Construction (except Operative Builders) (1-4: 1)
Other Services (except Public Administration): Religious Organizations (1-4: 1)
Construction: Site Preparation Contractors (1-4: 1)
Wholesale Trade: Motor Vehicle Supplies and New Parts Merchant Wholesalers (1-4: 1)
Fatal accident statistics in 2011:
Fatal accident count: 1
Vehicles involved in fatal accidents: 1
Fatal accidents caused by drunken drivers: 0
Fatalities: 1
Persons involved in fatal accidents: 1
Pedestrians involved in fatal accidents: 0
Fatal accident statistics in 2010:
Fatal accident count: 1
Vehicles involved in fatal accidents: 1
Fatal accidents caused by drunken drivers: 0
Fatalities: 1
Persons involved in fatal accidents: 4
Pedestrians involved in fatal accidents: 0
2005 - 2018 National Fire Incident Reporting System (NFIRS) incidents
According to the data from the years 2005 - 2018 the average number of fires per year is 7. The highest number of fires - 14 took place in 2013, and the least - 0 in 2006. The data has a growing trend.
When looking into fire subcategories, the most incidents belonged to: Outside Fires (57.4%), and Structure Fires (28.7%).
Fire incident types reported to NFIRS in Zip Code 61467
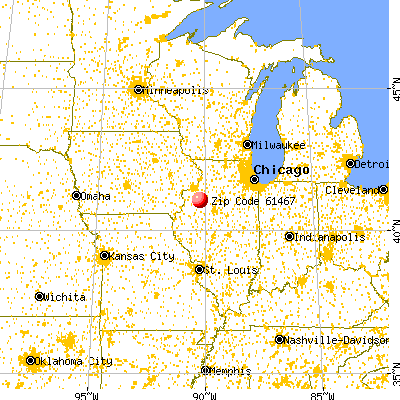


 Nearest zip codes: 61488, 61414, 61490, 61439, 61448, 61472.
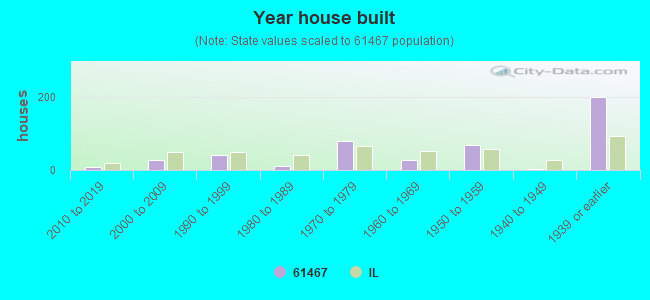


 According to the data from the years 2005 - 2018 the average number of fires per year is 7. The highest number of fires - 14 took place in 2013, and the least - 0 in 2006. The data has a growing trend.
 When looking into fire subcategories, the most incidents belonged to: Outside Fires (57.4%), and Structure Fires (28.7%).