Estimated zip code population in 2022: 850 Zip code population in 2010: 1,055 Zip code population in 2000: 774
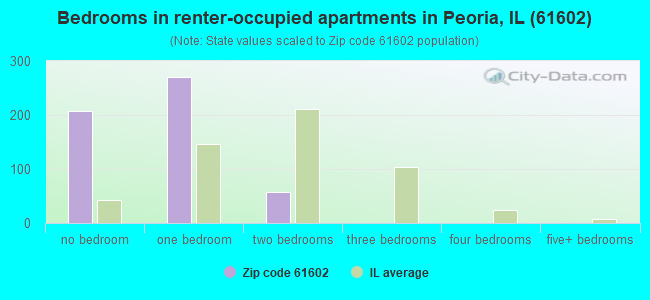
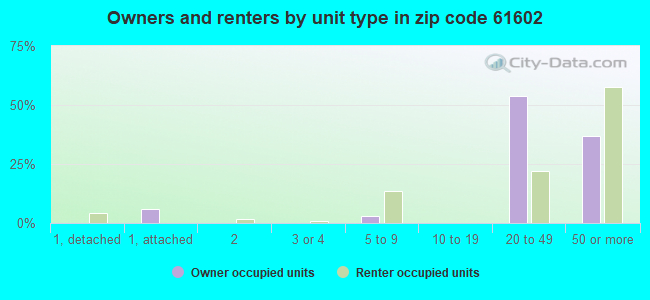
Houses and condos: 727 Renter-occupied apartments: 510
% of renters here:
83%
State:
33%
March 2022 cost of living index in zip code 61602: 92.6 (less than average, U.S. average is 100)
Land area: 1.5 sq. mi. Water area: 0.2 sq. mi.
Population density: 558 people per square mile
(low).
OSM Map
General Map
Google Map
MSN Map
OSM Map
General Map
Google Map
MSN Map
OSM Map
General Map
Google Map
MSN Map
OSM Map
General Map
Google Map
MSN Map
Please wait while loading the map...
Real estate property taxes paid for housing units in 2022:
This zip code:
2.5% ($6,198)
Illinois:
2.0% ($4,912)
Median real estate property taxes paid for housing units with mortgages in 2022: $6,379 (2.6%) Median real estate property taxes paid for housing units with no mortgage in 2022: $6,036 (2.4%)
Averages for the 2020 tax year for zip code 61602, filed in 2021:
Average Adjusted Gross Income (AGI) in 2020: $100,086 (Individual Income Tax Returns)
Here:
$100,086
State:
$82,626
Salary/wage: $60,297 (reported on 78.6% of returns)
Here:
$60,297
State:
$66,640
(% of AGI for various income ranges: 1126.7% for AGIs below $25k, 4473.3% for AGIs $25k-50k, 4240.0% for AGIs $50k-75k, 13306.7% for AGIs $100k-200k)
Taxable interest for individuals: $1,392 (reported on 31.0% of returns)
This zip code:
$1,392
Illinois:
$2,376
(% of AGI for various income ranges: 36.7% for AGIs $25k-50k, 20.0% for AGIs $50k-75k, 120.0% for AGIs $100k-200k)
Ordinary dividends: $18,650 (reported on 28.6% of returns)
Here:
$18,650
State:
$9,061
(% of AGI for various income ranges: 52.2% for AGIs below $25k, 155.7% for AGIs $50k-75k, 940.0% for AGIs $100k-200k)
Net capital gain/loss in AGI: +$14,282 (reported on 26.2% of returns)
Here:
+$14,282
State:
+$31,684
(% of AGI for various income ranges: 7.8% for AGIs below $25k, 200.0% for AGIs $50k-75k, 2070.0% for AGIs $100k-200k)
Profit/loss from business: +$5,925 (reported on 9.5% of returns)
Here:
+$5,925
State:
+$12,175
(% of AGI for various income ranges: 338.6% for AGIs $50k-75k)
Taxable individual retirement arrangement distribution: $31,333 (reported on 7.1% of returns)
61602:
$31,333
Illinois:
$21,613
(% of AGI for various income ranges: 1342.9% for AGIs $50k-75k)
Total itemized deductions: $49,950 (reported on 9.5% of returns)
Here:
$49,950
State:
$34,948
(% of AGI for various income ranges: 6660.0% for AGIs $100k-200k)
Charity contributions: $34,250 (reported on 9.5% of returns)
Here:
$34,250
State:
$13,122
(% of AGI for various income ranges: 4566.7% for AGIs $100k-200k)
Taxes paid: $7,925 (reported on 9.5% of returns)
61602:
$7,925
State:
$8,563
(% of AGI for various income ranges: 1056.7% for AGIs $100k-200k)
Earned income credit: $871 (reported on 16.7% of returns)
Here:
$871
State:
$2,311
(% of AGI for various income ranges: 67.8% for AGIs below $25k)
Percentage of individuals using paid preparers for their 2020 taxes: 85.7%
Here:
86%
State:
93%
(% for various income ranges: 92.3% for AGIs below $25k, 88.9% for AGIs $25k-50k, 85.7% for AGIs $50k-75k, 75.0% for AGIs $75k-100k, 80.0% for AGIs $100k-200k, 75.0% for AGIs over 200k)
Averages for the 2012 tax year for zip code 61602, filed in 2013:
Average Adjusted Gross Income (AGI) in 2012: $120,565 (Individual Income Tax Returns)
Here:
$120,565
State:
$68,058
Salary/wage: $98,769 (reported on 78.3% of returns)
Here:
$98,769
State:
$55,396
(% of AGI for various income ranges: 82.2% for AGIs below $25k, 76.6% for AGIs $25k-50k, 95.6% for AGIs $50k-75k, 57.9% for AGIs $100k-200k, 63.9% for AGIs over 200k)
Taxable interest for individuals: $4,684 (reported on 41.3% of returns)
This zip code:
$4,684
Illinois:
$1,969
(% of AGI for various income ranges: 1.1% for AGIs below $25k, 0.7% for AGIs $25k-50k, 0.8% for AGIs $50k-75k, 2.1% for AGIs $100k-200k, 1.8% for AGIs over 200k)
Ordinary dividends: $17,647 (reported on 32.6% of returns)
Here:
$17,647
State:
$7,786
(% of AGI for various income ranges: 6.1% for AGIs below $25k, 5.3% for AGIs $25k-50k, 10.4% for AGIs $50k-75k, 5.6% for AGIs $100k-200k, 4.2% for AGIs over 200k)
Net capital gain/loss in AGI: +$22,879 (reported on 30.4% of returns)
Here:
+$22,879
State:
+$22,183
(% of AGI for various income ranges: 1.4% for AGIs below $25k, 6.7% for AGIs $50k-75k, 2.4% for AGIs $100k-200k, 7.3% for AGIs over 200k)
Profit/loss from business: +$6,625 (reported on 8.7% of returns)
Here:
+$6,625
State:
+$12,903
Taxable individual retirement arrangement distribution: $27,175 (reported on 8.7% of returns)
61602:
$27,175
Illinois:
$17,929
Total itemized deductions: $35,853 (15% of AGI, reported on 37.0% of returns)
Here:
$35,853
State:
$26,433
Here:
15.1% of AGI
State:
19.2% of AGI
(% of AGI for various income ranges: 30.2% for AGIs $25k-50k, 28.4% for AGIs $50k-75k, 12.9% for AGIs $100k-200k, 8.8% for AGIs over 200k)
Charity contributions: $8,173 (reported on 23.9% of returns)
Here:
$8,173
State:
$4,525
(% of AGI for various income ranges: 3.1% for AGIs $50k-75k, 1.6% for AGIs $100k-200k, 1.8% for AGIs over 200k)
Taxes paid: $14,918 (reported on 37.0% of returns)
61602:
$14,918
State:
$11,968
(% of AGI for various income ranges: 3.6% for AGIs $25k-50k, 5.4% for AGIs $50k-75k, 5.3% for AGIs $100k-200k, 4.9% for AGIs over 200k)
Earned income credit: $1,100 (reported on 19.6% of returns)
Here:
$1,100
State:
$2,349
(% of AGI for various income ranges: 4.6% for AGIs below $25k)
Percentage of individuals using paid preparers for their 2012 taxes: 58.7%
Here:
59%
State:
57%
(% for various income ranges: 52.6% for AGIs below $25k, 50.0% for AGIs $25k-50k, 66.7% for AGIs $50k-75k, 80.0% for AGIs $100k-200k, 83.3% for AGIs over 200k)
Averages for the 2004 tax year for zip code 61602, filed in 2005:
Average Adjusted Gross Income (AGI) in 2004: $94,234 (Individual Income Tax Returns)
Here:
$94,234
State:
$54,625
Salary/wage: $56,052 (reported on 66.8% of returns)
Here:
$56,052
State:
$46,811
(% of AGI for various income ranges: 87.5% for AGIs below $10k, 64.1% for AGIs $10k-25k, 58.0% for AGIs $25k-50k, 54.4% for AGIs $50k-75k, 69.0% for AGIs $75k-100k, 34.0% for AGIs over 100k)
Taxable interest for individuals: $6,577 (reported on 53.6% of returns)
This zip code:
$6,577
Illinois:
$2,101
(% of AGI for various income ranges: 7.7% for AGIs below $10k, 7.3% for AGIs $10k-25k, 5.3% for AGIs $25k-50k, 4.3% for AGIs $50k-75k, 1.9% for AGIs $75k-100k, 3.4% for AGIs over 100k)
Taxable dividends: $13,033 (reported on 46.8% of returns)
Here:
$13,033
State:
$4,306
(% of AGI for various income ranges: 22.1% for AGIs below $10k, 9.8% for AGIs $10k-25k, 11.3% for AGIs $25k-50k, 5.7% for AGIs $50k-75k, 1.2% for AGIs $75k-100k, 6.0% for AGIs over 100k)
Net capital gain/loss: +$54,015 (reported on 39.2% of returns)
Here:
+$54,015
State:
+$17,321
(% of AGI for various income ranges: -5.2% for AGIs below $10k, 3.1% for AGIs $10k-25k, 0.5% for AGIs $25k-50k, 8.6% for AGIs $50k-75k, 27.5% for AGIs over 100k)
Profit/loss from business: +$23,750 (reported on 11.5% of returns)
Here:
+$23,750
State:
+$11,771
Total itemized deductions: $41,834 (22% of AGI, reported on 42.8% of returns)
Here:
$41,834
State:
$20,239
Here:
22.3% of AGI
State:
19.5% of AGI
(% of AGI for various income ranges: 79.8% for AGIs below $10k, 50.6% for AGIs $10k-25k, 26.5% for AGIs $25k-50k, 32.9% for AGIs $50k-75k, 36.0% for AGIs $75k-100k, 14.2% for AGIs over 100k)
Charity contributions deductions: $8,577 (3% of AGI, reported on 27.3% of returns)
Here:
$8,577
State:
$3,719
Here:
3.3% of AGI
State:
3.4% of AGI
(% of AGI for various income ranges: 2.2% for AGIs $10k-25k, 0.9% for AGIs $25k-50k, 3.7% for AGIs $50k-75k, 2.7% for AGIs over 100k)
Total tax: $26,267 (reported on 66.2% of returns)
61602:
$26,267
State:
$9,882
(% of AGI for various income ranges: 1.2% for AGIs below $10k, 4.1% for AGIs $10k-25k, 9.3% for AGIs $25k-50k, 10.3% for AGIs $50k-75k, 14.1% for AGIs $75k-100k, 20.9% for AGIs over 100k)
Earned income credit: $653 (reported on 18.8% of returns)
Here:
$653
State:
$1,788
Percentage of individuals using paid preparers for their 2004 taxes: 67.6%
Here:
68%
State:
61%
(% for various income ranges: 55.8% for AGIs below $10k, 64.3% for AGIs $10k-25k, 68.3% for AGIs $25k-50k, 71.4% for AGIs $50k-75k, 85.7% for AGIs $75k-100k, 85.1% for AGIs over 100k)
Household received Food Stamps/SNAP in the past 12 months: 268 Household did not receive Food Stamps/SNAP in the past 12 months: 372
Women who did not have a birth in the past 12 months: 152 (48 now married, 104 unmarried)
Housing units in zip code 61602 with a mortgage: 32 (6 second mortgage, 6 both second mortgage and home equity loan) Median monthly owner costs for units with a mortgage: $1,949 Median monthly owner costs for units without a mortgage: $1,376
Residents with income below the poverty level in 2022:
This zip code:
46.0%
Whole state:
11.9%
Residents with income below 50% of the poverty level in 2022:
This zip code:
17.8%
Whole state:
5.7%
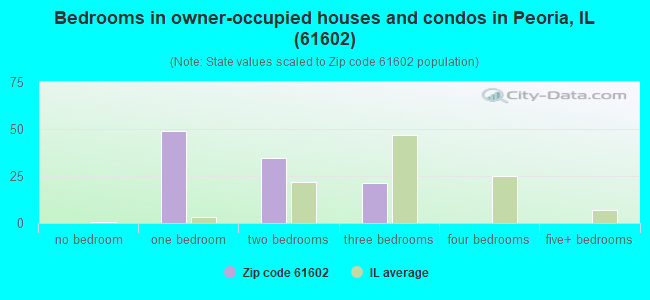
Median number of rooms in houses and condos:
Here:
3.9
State:
6.4
Median number of rooms in apartments:
Here:
2.2
State:
4.1
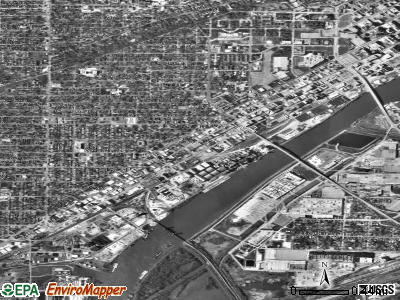
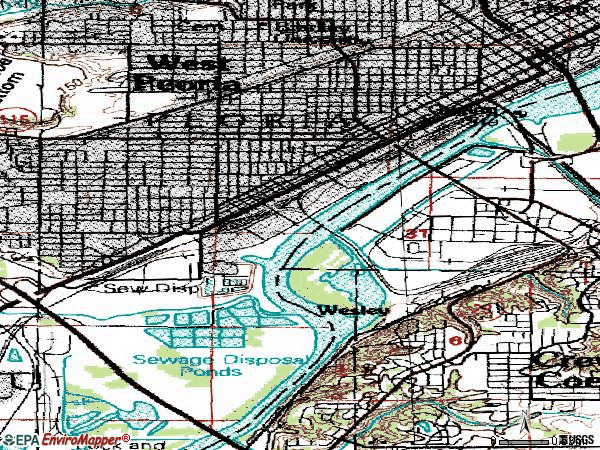
Notable locations in this zip code not listed on our city pages
Notable locations in zip code 61602: Union Station (A), Peoria Sanitary District Plant (B), Peoria City Jail (C), Peoria Public Library (D), Peoria City Hall (E), Peoria County Courthouse (F), Illinois American Historical Water Museum (G), Illinois Terminal Station (H), Municipal River and Rail Terminal (I), Peoria Civic Center (J), Riverfront Amphitheater (K), Rock Island Station (L). Display/hide their locations on the map
Churches in zip code 61602 include: Cornerstone Church (A), First United Methodist Church (B), Sacred Hearth Church (C). Display/hide their locations on the map
In group quarters: 129 (-1 institutionalized population)
Size of family households: 85 2-persons
Size of nonfamily households: 507 1-person, 37 2-persons
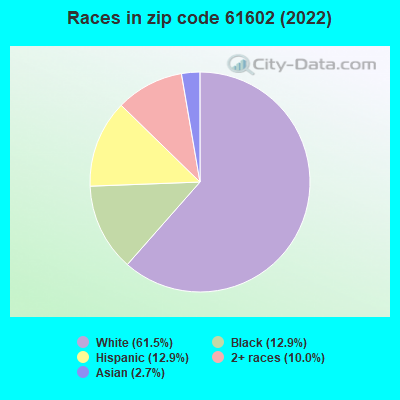
82.6% of residents of 61602 zip code speak English at home.
11.0% of residents speak Spanish at home (51% very well, 28% well, 21% not well).
2.8% of residents speak other Indo-European language at home (38% very well, 62% not well).
2.7% of residents speak Asian or Pacific Island language at home (70% very well, 30% well).
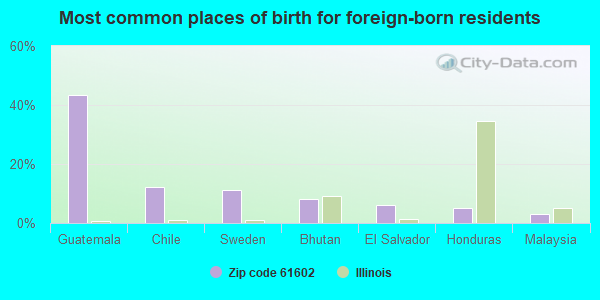
Foreign born population: 99 (11.6%) (20.3% of them are naturalized citizens)
Major facilities with environmental interests located in this zip code:
ARCHER DANIELS MIDLAND CO (1 EDMUND STREET in PEORIA, IL)
STATE MASTER (Illinois EPA Project) - SOLID WASTE PROGRAM, HAZARDOUS WASTE PROGRAM, AIR PROGRAM, AIR MAJOR (AIRS/AFS) AIR MINOR (AIRS/AFS) (Integrated Compliance Information System) - ICIS-05-1990-0206, FORMAL ENFORCEMENT ACTION, ICIS-05-2001-1701, CRITERIA AND HAZARDOUS AIR POLLUTANT INVENTORY (Inventory of air pollution sources) National Pollutant Discharge Elimination System NON-MAJOR (Tracking pollutant discharge elimination systems) - permit - ICIS-, ENFORCEMENT/COMPLIANCE ACTIVITY National Pollutant Discharge Elimination System NON-MAJOR (Tracking pollutant discharge elimination systems) - permit National Pollutant Discharge Elimination System NON-MAJOR (Tracking pollutant discharge elimination systems) - permit National Pollutant Discharge Elimination System NON-MAJOR (Tracking pollutant discharge elimination systems) - permit AIR MAJOR ("Best Available" air pollution technologies tracking) HAZARDOUS WASTE BIENNIAL REPORTER (Resource Conservation and Recovery Act (tracking hazardous waste)) Small Quantity Generators, between 100 kg and 1000 kg of hazardous waste/month (Resource Conservation and Recovery Act (tracking hazardous waste)) - notification TRI REPORTER (Tracking of toxic chemicals releasing facilities) Business SIC classification: SOYBEAN OIL MILLS; DISTILLED AND BLENDED LIQUORS; INDUSTRIAL ORGANIC CHEMICALS; ELECTRIC SERVICES; GRAIN AND FIELD BEANS Alternative names: ADM, ADM CORN SWEETENERS, ADM/GROWMARK RIVER SYSTEM INC, ARCHER DANIEL MIDLAND-TRUCKING, ARCHER DANIELS MIDLAND COMPANY, ARCHER DANIELS MIDLAND COMPANY LOC-401, ARCHER DANIELS MIDLAND (ADM) C, ARCHER DANIELS MIDLAND-MASON, ARCHER DANIELS MIDLAND-MECHANI, ARCHER DANIELS MIDLAND PEORIA , NARCHER DANIELS MIDLAND CO.
PRAIRIE MATERIAL SALES (100 CASS ST in PEORIA, IL)
STATE MASTER (Illinois EPA Project) - AIR PROGRAM STATE MASTER (Illinois EPA Project) - National Pollutant Discharge Elimination System Permit AIR MINOR (AIRS/AFS) CRITERIA AND HAZARDOUS AIR POLLUTANT INVENTORY (Inventory of air pollution sources) National Pollutant Discharge Elimination System NON-MAJOR (Tracking pollutant discharge elimination systems) - permit National Pollutant Discharge Elimination System NON-MAJOR (Tracking pollutant discharge elimination systems) - permit Business SIC classification: READY-MIXED CONCRETE Business NAICS classification: READY-MIX CONCRETE MANUFACTURING. Organizations: CONSTRUCTION MATERIALS COMPANY (CONTACT/OWNER)
, CONSTRUCTION MATERIALS CO. (CONTACT/OWNER)
Alternative names: CONSTRUCTION MATERIALS CO., PRAIRIE MATERIALS YARD 28
LUCAS AND SONS (1328 SW WASHINGTON in PEORIA, IL)
STATE MASTER (Illinois EPA Project) - HAZARDOUS WASTE PROGRAM, AIR PROGRAM STATE MASTER (Illinois EPA Project) - National Pollutant Discharge Elimination System Permit AIR MINOR (AIRS/AFS) CRITERIA AND HAZARDOUS AIR POLLUTANT INVENTORY (Inventory of air pollution sources) National Pollutant Discharge Elimination System NON-MAJOR (Tracking pollutant discharge elimination systems) - permit Conditionally Exempt Small Quantity Generators, less than 100 kg/month of hazardous waste (Resource Conservation and Recovery Act (tracking hazardous waste)) - notification Business SIC and NAICS classification: FABRICATED STRUCTURAL METAL Organizations: LUCAS & SONS?A. (CONTACT/OWNER)
, LUCAS A AND SONS (CONTACT/OWNER)
Alternative names: A LUCAS AND SONS, LUCAS, A. & SONS, LUCAS & SONS?A.
PEORIA CSOS (419 FULTON STREET in PEORIA, IL)
National Pollutant Discharge Elimination System NON-MAJOR (Tracking pollutant discharge elimination systems) - permit - ICIS-, ENFORCEMENT/COMPLIANCE ACTIVITY National Pollutant Discharge Elimination System NON-MAJOR (Tracking pollutant discharge elimination systems) - permit National Pollutant Discharge Elimination System NON-MAJOR (Tracking pollutant discharge elimination systems) - permit Small Quantity Generators, between 100 kg and 1000 kg of hazardous waste/month (Resource Conservation and Recovery Act (tracking hazardous waste)) - notification Business SIC classification: SEWERAGE SYSTEMS Organizations: PEORIA CITY OF (CONTACT/OWNER)
Alternative names: DEERBROOK ESTATES STP, OAKBROOK ESTATES STP, PEORIA CITY OF, PEORIA CSOS, CITY OF
LENZ OIL SERVICE (3001 SW WASHINGTON ST in PEORIA, IL)
STATE MASTER (Illinois EPA Project) - SOLID WASTE PROGRAM, HAZARDOUS WASTE PROGRAM, AIR PROGRAM AIR MINOR (AIRS/AFS) CRITERIA AND HAZARDOUS AIR POLLUTANT INVENTORY (Inventory of air pollution sources) TRANSPORTER (Resource Conservation and Recovery Act (tracking hazardous waste)) USED OIL PROGRAM (Resource Conservation and Recovery Act (tracking hazardous waste)) Business SIC classification: PETROLEUM BULK STATIONS AND TERMINALS Alternative names: LENZ OIL PEORIA INC
IDEAL TROY CO (714 W DETWEILLER DR in PEORIA, IL)
STATE MASTER (Illinois EPA Project) - HAZARDOUS WASTE PROGRAM, AIR PROGRAM AIR MINOR (AIRS/AFS) CRITERIA AND HAZARDOUS AIR POLLUTANT INVENTORY (Inventory of air pollution sources) Small Quantity Generators, between 100 kg and 1000 kg of hazardous waste/month (Resource Conservation and Recovery Act (tracking hazardous waste)) Business SIC classification: DRYCLEANING PLANTS, EXCEPT RUG CLEANING Business NAICS classification: DRYCLEANING AND LAUNDRY SERVICES (EXCEPT COIN-OPERATED).
ACE USED TRUCK & AUTO PARTS (1918 S WASHINGTON in PEORIA, IL)
STATE MASTER (Illinois EPA Project) - HAZARDOUS WASTE PROGRAM, SCRAP TIRE MANAGEMENT National Pollutant Discharge Elimination System NON-MAJOR (Tracking pollutant discharge elimination systems) - permit Conditionally Exempt Small Quantity Generators, less than 100 kg/month of hazardous waste (Resource Conservation and Recovery Act (tracking hazardous waste)) Organizations: POSTON?HOMER H. (CONTACT/OWNER)
, POSTON KENNETH (CONTACT/OWNER)
Alternative names: ACE USED AUTO PARTS
MILITARY AND NAVAL DEPARTMENT/PEORIA (523 N.E. ADAMS ST. in PEORIA, IL)
STATE MASTER (Illinois EPA Project) - SOLID WASTE PROGRAM, HAZARDOUS WASTE PROGRAM, AIR PROGRAM AIR MINOR (AIRS/AFS) Small Quantity Generators, between 100 kg and 1000 kg of hazardous waste/month (Resource Conservation and Recovery Act (tracking hazardous waste)) - notification Business SIC classification: NATIONAL SECURITY Organizations: ILLINOIS STATE OF (CONTACT/OWNER)
Alternative names: DEPT. OF MILITARY AFFAIRS, PEORIA OMS
ALLIED IRON AND STEEL CO (2900 W CLARKE ST in PEORIA, IL)
STATE MASTER (Illinois EPA Project) - SOLID WASTE PROGRAM, AIR PROGRAM AIR MINOR (AIRS/AFS) SUPERFUND (Superfund database) CRITERIA AND HAZARDOUS AIR POLLUTANT INVENTORY (Inventory of air pollution sources) Business SIC classification: SCRAP AND WASTE MATERIALS
ACME MANUFACTURING CO (308 SW COMMERCIAL in PEORIA, IL)
STATE MASTER (Illinois EPA Project) - AIR PROGRAM AIR MINOR (AIRS/AFS) COMPLIANCE ACTIVITY (Tracking inspections of insecticide, fungicide, and rodenticide, and toxic substances) Business SIC classification: FABRICATED PIPE AND PIPE FITTINGS
J & L DOCK FACILITIES INC (6 SANGER ST in PEORIA, IL)
STATE MASTER (Illinois EPA Project) - AIR PROGRAM AIR MINOR (AIRS/AFS) CRITERIA AND HAZARDOUS AIR POLLUTANT INVENTORY (Inventory of air pollution sources) Business SIC classification: COAL MINING SERVICES
NICHOLS AUTO ELEC SVC INC (813 SW ADAMS in PEORIA, IL)
STATE MASTER (Illinois EPA Project) - SOLID WASTE PROGRAM (Resource Conservation and Recovery Act (tracking hazardous waste))
PEORIA ENGRAVING CO (613 MAIN ST in PEORIA, IL)
STATE MASTER (Illinois EPA Project) - HAZARDOUS WASTE PROGRAM (Resource Conservation and Recovery Act (tracking hazardous waste))
Housing units lacking complete plumbing facilities: 3.4% Housing units lacking complete kitchen facilities: 5.7%
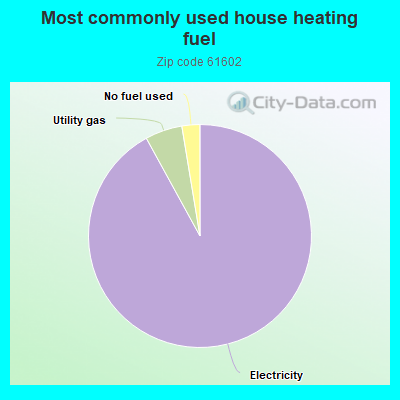
92.2%Electricity
5.4%Utility gas
2.6%No fuel used
Population in 1990: 740. Population change in the 1990s: +34 (+4.6%).
Place of birth for U.S.-born residents:
This state: 550
Northeast: 11
Midwest: 69
South: 63
West: 56
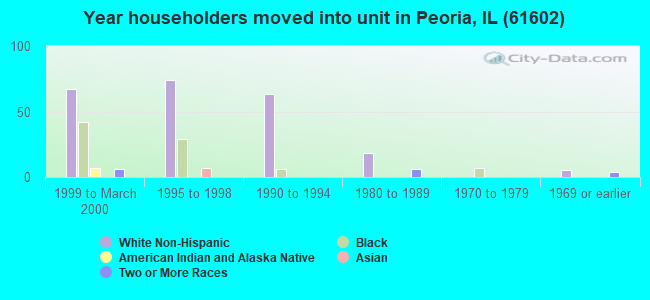
21% of the 61602 zip code residents lived in the same house 5 years ago. Out of people who lived in different houses, 44% lived in this county. Out of people who lived in different counties, 50% lived in Illinois.
75% of the 61602 zip code residents lived in the same house 1 year ago. Out of people who lived in different houses, 16% moved from this county. Out of people who lived in different houses, 67% moved from different county within same state. Out of people who lived in different houses, 22% moved from different state.
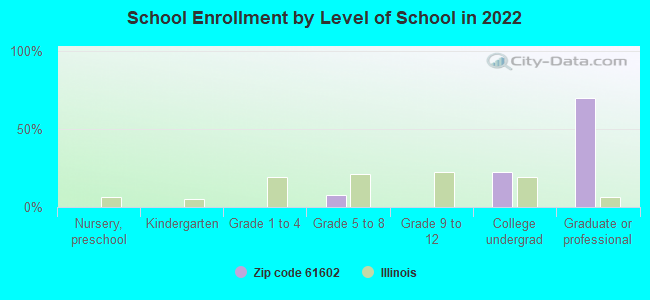
Private vs. public school enrollment:
Students in private schools in grades 1 to 8 (elementary and middle school): 14
Here:
100.0%
Illinois:
13.3%
Students in private undergraduate colleges: 4
Here:
11.1%
Illinois:
27.4%
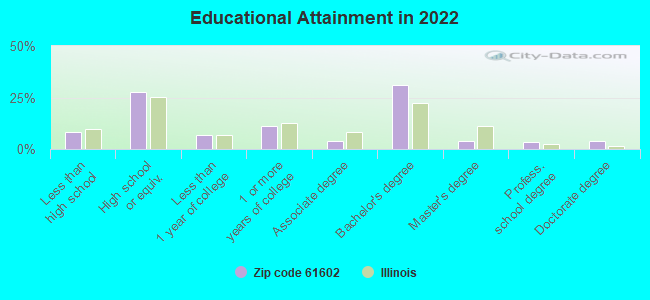
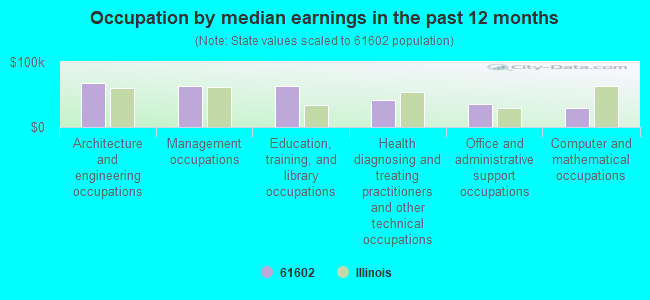
Occupation by median earnings in the past 12 months ($)
67,594Architecture and engineering occupations
63,428Management occupations
62,271Education, training, and library occupations
41,994Health diagnosing and treating practitioners and other technical occupations
35,215Office and administrative support occupations
29,514Computer and mathematical occupations
Companies with biggest federal contracts located in this zip code (PEORIA, IL):
SBC (320 FULTON STREET, FLR 4) : $6,359,756 in 29 contractsfrom 2000 to 2006
Contracts for Other ADP and Telecommunications Services (includes data storage on tapes, compact disks, etc.), Telephone and/or Communications Services (includes Telegraph, Telex, and Cablevision Services), Communications Security Equipment and Components, Other Photographic, Mapping, Printing, and Publication Services, and moreby Federal Technology Service, Air Force, Department of Veterans Affairs, Internal Revenue Service, and others Signed by year:2000: $660,243; 2001: $5,025,900; 2002: $492,568; 2003: $40,153; 2004: $22,818; 2005: $118,006; 2006: $68.
Biggest contracts:
$5,000,000 with Federal Technology Service for Other ADP and Telecommunications Services (includes data storage on tapes, compact disks, etc.). Signed on 2001-01-15. Completion date: 2001-12-15.
$498,243 with Air Force for Telephone and/or Communications Services (includes Telegraph, Telex, and Cablevision Services). Signed on 2000-10-01. Completion date: 2001-09-30.
$493,568, same as above.Signed on 2002-08-27. Completion date: 2003-08-03.
$69,000 with Department of Veterans Affairs for Other ADP and Telecommunications Services (includes data storage on tapes, compact disks, etc.). Signed on 2000-10-15. Completion date: 2001-03-15.
AMEREX CORPORATION (1525 SW ADAMS ST; small business) : $1,490,749 in 20 contractsfrom 2000 to 2006
Contracts for Fire Fighting Equipment, Safety and Rescue Equipment, Miscellaneous Vehicular Components, Gases: Compressed and Liquefied, and moreby Army, U.S. Coast Guard, Navy, Air Force, and others Signed by year:2000: $202,160; 2001: $444,864; 2002: $33,432; 2003: $3,320; 2004: $415,078; 2005: $303,443; 2006: $88,452.
Biggest contracts:
$444,864 with Army for Fire Fighting Equipment. Signed on 2001-02-15. Completion date: 2001-08-03.
$405,080, same as above.Signed on 2004-10-18. Completion date: 2005-05-31.
$218,120, same as above.Signed on 2005-08-25. Completion date: 2005-12-31.
$88,452, same as above.Signed on 2006-02-10. Completion date: 2006-07-13.
LENSCO CONSTRUCTION INC (1311 S W ADAMS ST; small business) : $22,123 in 3 contractsin 2001
$18,825 with Army for Maintenance, Repair or Alteration of Real Property -- Other Administrative Facilities and Service Buildings. Signed on 2001-02-05. Completion date: 2001-03-11.
$3,298 with Army for Construction of Structures and Facilities -- Highways, Roads, Streets, Bridges, and Railways (includes resurfacing). Signed on 2001-09-20. Completion date: 2000-11-06.
$0, same as above.Signed on 2001-09-20. Completion date: 2000-11-06.
BRADFIELDS, INC OF CENTRAL IL (2306 S W ADAMS STREET; small business)
$16,646 with Army for Electrical and Electronic assemblies, Boards, Cards, and Associated Hardware. Signed on 2003-05-06. Completion date: 2003-06-05.
HOLIDAY INN CITY CENTRE (500 N HAMILTON BLVD; small business) : $8,769 in 3 contractsfrom 2005 to 2006
$5,498 with Army for Lodging - Hotel/Motel. Signed on 2005-10-01. Completion date: 2005-10-05.
$2,870 with Army for Meat, Poultry, and Fish. Signed on 2006-02-16. Completion date: 2006-02-25.
$401 with Army for Lodging - Hotel/Motel. Signed on 2006-06-13. Completion date: 2006-06-03.
KIRBY RISK CORPORATION (316 SW WASHINGTON ST; small business)
$8,762 with U.S. Army Corps of Engineers - civil program financing only for Indoor and Outdoor Electric Lighting Fixtures. Signed on 2001-11-19. Completion date: 2002-01-07.
MEYER HEATING & AIR CONDITIONI (1300 SW WASHINGTON ST; small business)
$8,540 with U.S. Army Corps of Engineers - civil program financing only for Air Purification Equipment. Signed on 2002-01-04. Completion date: 2002-01-14.
PARADIGM SOFTWARE, L L C (3213 SOUTH WASHINGTON STRE; small business)
$7,605 with Navy for ADP Software. Signed on 2005-09-29. Completion date: 2005-10-28.
C & H REPAIR + SUPPLY CO, INC (2313 SW ADAMS ST)
$7,112 with Army for Miscellaneous Special Industry Machinery. Signed on 2005-06-30. Completion date: 2005-07-22.
RIVERMEN INC (201 SW JEFFERSON AVE; small business)
$3,668 with Army for Advertising Services. Signed on 2005-09-22. Completion date: 2005-12-13.
Top industries in this zip code by the number of employees in 2005:
2002 - 2018 National Fire Incident Reporting System (NFIRS) incidents
Based on the data from the years 2002 - 2018 the average number of fire incidents per year is 46. The highest number of fires - 173 took place in 2011, and the least - 3 in 2004. The data has a decreasing trend.
When looking into fire subcategories, the most incidents belonged to: Structure Fires (53.7%), and Outside Fires (24.2%).
Fire incident types reported to NFIRS in Zip Code 61602

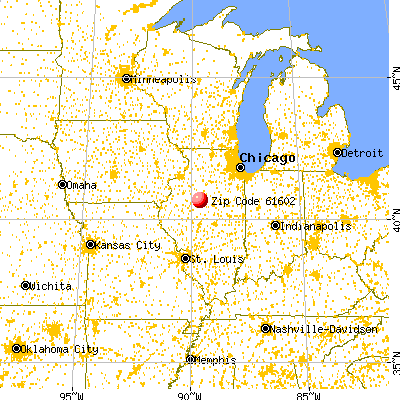


 Nearest zip codes: 61625, 61605, 61606, 61610, 61603, 61604.


 Based on the data from the years 2002 - 2018 the average number of fire incidents per year is 46. The highest number of fires - 173 took place in 2011, and the least - 3 in 2004. The data has a decreasing trend.
 When looking into fire subcategories, the most incidents belonged to: Structure Fires (53.7%), and Outside Fires (24.2%).