Peoria, Illinois
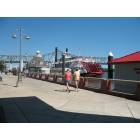
Peoria: river front paddle boat

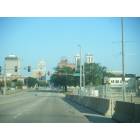
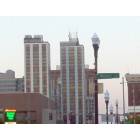
Peoria: Downtown Peoria Across the Illinois River

Peoria: Peoria's skyline at night
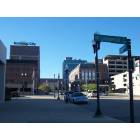
Peoria: Downtown Peoria

Peoria: Peoria Riverfront Park
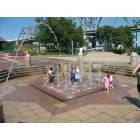
Peoria: river front fountain
Peoria: downtown peoria
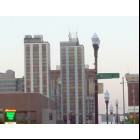
Peoria: Downtown Twin Towers

Peoria: downtown
Peoria: downtown

Peoria: Skyline From East Peoria
- see
15
more - add
your
Submit your own pictures of this city and show them to the world
- OSM Map
- General Map
- Google Map
- MSN Map
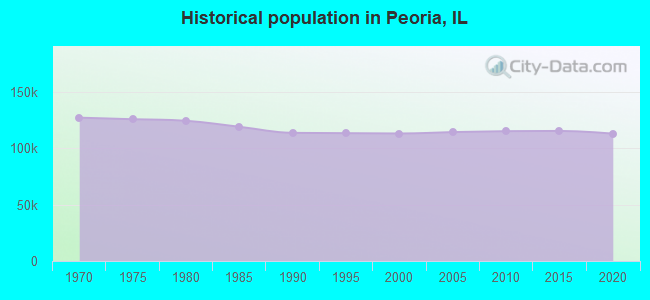
Population change since 2000: -1.7%
 |
| Males: 53,384 | |
| Females: 57,637 |
| Median resident age: | 35.4 years |
| Illinois median age: | 39.1 years |
Zip codes: 61528, 61602, 61603, 61606, 61614, 61615, 61616, 61625.
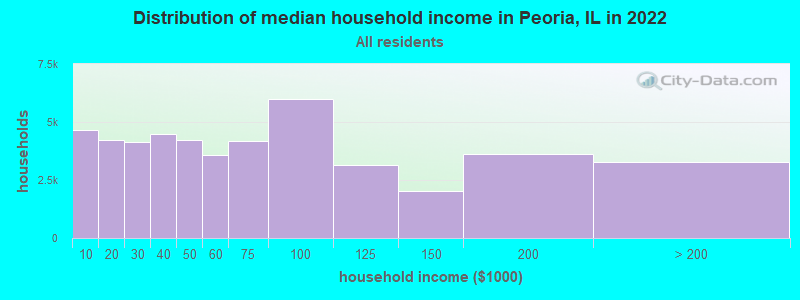
Peoria Zip Code Map| Peoria: | $55,955 |
| IL: | $76,708 |
Estimated per capita income in 2022: $37,725 (it was $20,512 in 2000)
Peoria city income, earnings, and wages data
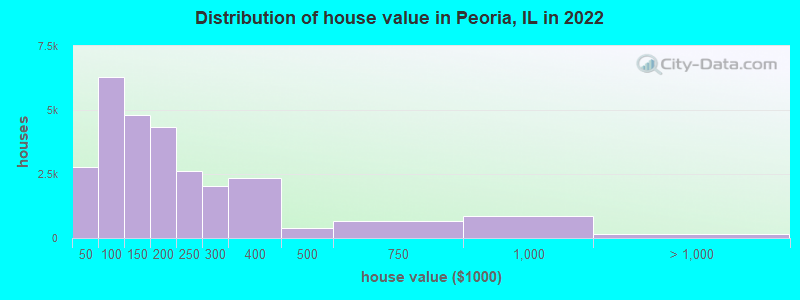
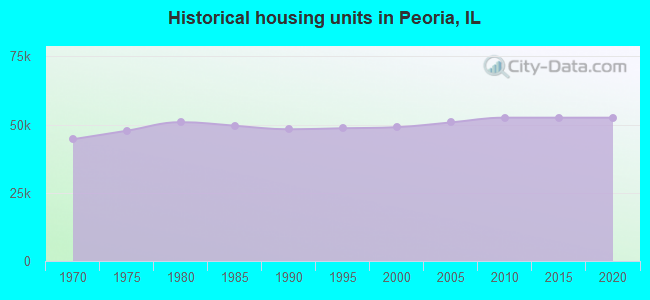
Estimated median house or condo value in 2022: $151,400 (it was $84,000 in 2000)
| Peoria: | $151,400 |
| IL: | $251,600 |
Mean prices in 2022: all housing units: $179,688; detached houses: $180,637; townhouses or other attached units: $247,353; in 2-unit structures: $161,021; in 3-to-4-unit structures: $170,689; in 5-or-more-unit structures: $106,281; mobile homes: $80,247
Median gross rent in 2022: $919.
(12.4% for White Non-Hispanic residents, 21.3% for Black residents, 25.4% for Hispanic or Latino residents, 42.8% for American Indian residents, 100.0% for Native Hawaiian and other Pacific Islander residents, 30.9% for other race residents, 32.1% for two or more races residents)
Detailed information about poverty and poor residents in Peoria, IL


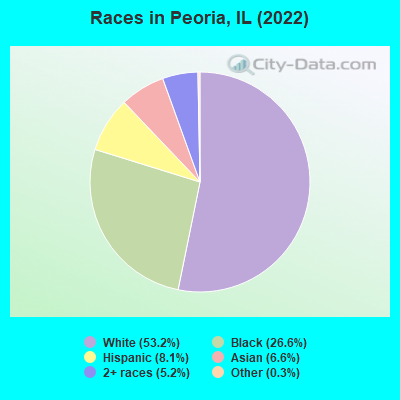
- 58,05653.2%White alone
- 29,10526.6%Black alone
- 8,8208.1%Hispanic
- 7,1686.6%Asian alone
- 5,6965.2%Two or more races
- 3140.3%Other race alone
- 620.06%American Indian alone
Races in Peoria detailed stats: ancestries, foreign born residents, place of birth
According to our research of Illinois and other state lists, there were 426 registered sex offenders living in Peoria, Illinois as of April 27, 2024.
The ratio of all residents to sex offenders in Peoria is 271 to 1.
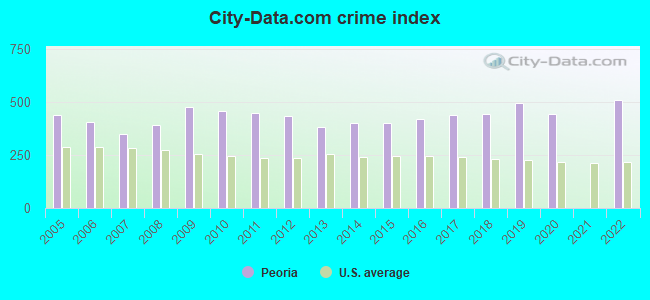
The City-Data.com crime index weighs serious crimes and violent crimes more heavily. Higher means more crime, U.S. average is 246.1. It adjusts for the number of visitors and daily workers commuting into cities.
- means the value is smaller than the state average.- means the value is about the same as the state average.
- means the value is bigger than the state average.
- means the value is much bigger than the state average.
Crime rate in Peoria detailed stats: murders, rapes, robberies, assaults, burglaries, thefts, arson
Full-time law enforcement employees in 2021, including police officers: 216 (196 officers - 171 male; 25 female).
| Officers per 1,000 residents here: | 1.80 |
| Illinois average: | 2.84 |
 Recent articles from our blog. Our writers, many of them Ph.D. graduates or candidates, create easy-to-read articles on a wide variety of topics.

 | PEORIA: advice needed (15 replies) |
| Most Desirable Private Schools in Peoria (14 replies) |
| Peoria/Chicago—where to live in between? (21 replies) |
| Peoria ideas (3-day trip) (3 replies) |
| Peoria: Moving to Peoria to Work at St. Francis Medical Center; Need Info/Advice (3 replies) |
| Peoria (0 replies) |
Latest news from Peoria, IL collected exclusively by city-data.com from local newspapers, TV, and radio stations
Ancestries: German (10.4%), Irish (6.1%), English (5.7%), American (4.2%), European (3.2%), African (3.1%).
Current Local Time: CST time zone
Incorporated on 01/13/1892
Elevation: 600 feet
Land area: 44.4 square miles.
Population density: 2,500 people per square mile (average).
10,303 residents are foreign born (5.5% Asia, 2.1% Latin America).
| This city: | 9.3% |
| Illinois: | 14.1% |
Median real estate property taxes paid for housing units with mortgages in 2022: $3,662 (2.4%)
Median real estate property taxes paid for housing units with no mortgage in 2022: $3,285 (2.3%)
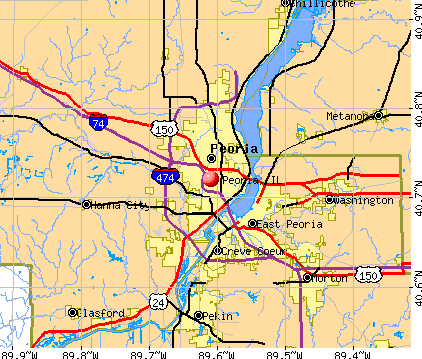
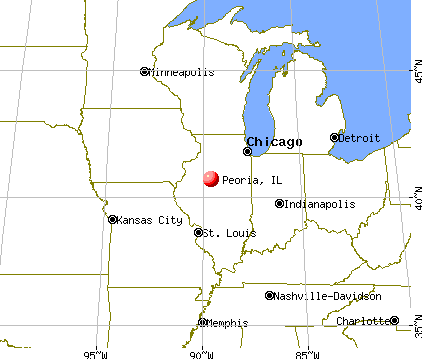
Nearest city with pop. 200,000+: Chicago, IL  (126.7 miles , pop. 2,896,016).
Nearest cities:
), ), )Latitude: 40.72 N, Longitude: 89.61 W
Daytime population change due to commuting: +23,364 (+21.4%)
Workers who live and work in this city: 34,516 (69.4%)
Area code: 309

Detailed articles:
- Peoria: Introduction
- Peoria Basic Facts
- Peoria: Communications
- Peoria: Convention Facilities
- Peoria: Economy
- Peoria: Education and Research
- Peoria: Geography and Climate
- Peoria: Health Care
- Peoria: History
- Peoria: Municipal Government
- Peoria: Population Profile
- Peoria: Recreation
- Peoria: Transportation
Peoria, Illinois accommodation & food services, waste management - Economy and Business Data
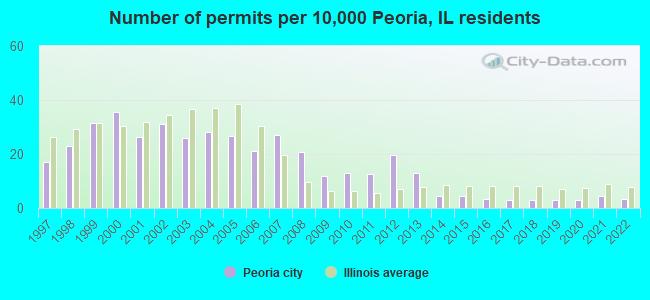
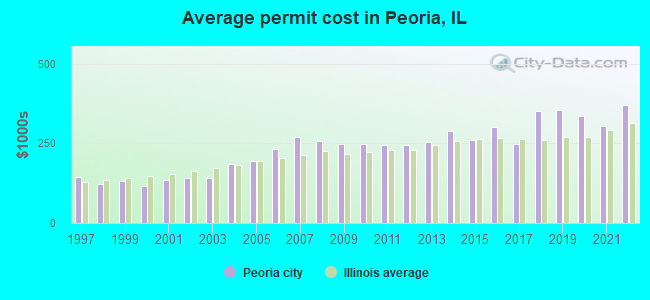
Single-family new house construction building permits:
- 2022: 39 buildings, average cost: $371,900
- 2021: 51 buildings, average cost: $305,100
- 2020: 35 buildings, average cost: $334,500
- 2019: 33 buildings, average cost: $355,000
- 2018: 32 buildings, average cost: $352,600
- 2017: 32 buildings, average cost: $247,000
- 2016: 39 buildings, average cost: $303,000
- 2015: 49 buildings, average cost: $262,000
- 2014: 51 buildings, average cost: $289,600
- 2013: 147 buildings, average cost: $253,700
- 2012: 220 buildings, average cost: $245,900
- 2011: 143 buildings, average cost: $243,900
- 2010: 146 buildings, average cost: $247,400
- 2009: 132 buildings, average cost: $246,800
- 2008: 233 buildings, average cost: $258,900
- 2007: 306 buildings, average cost: $269,000
- 2006: 240 buildings, average cost: $233,300
- 2005: 301 buildings, average cost: $194,400
- 2004: 318 buildings, average cost: $183,800
- 2003: 291 buildings, average cost: $142,400
- 2002: 352 buildings, average cost: $141,900
- 2001: 296 buildings, average cost: $134,500
- 2000: 401 buildings, average cost: $115,200
- 1999: 355 buildings, average cost: $131,600
- 1998: 258 buildings, average cost: $124,100
- 1997: 192 buildings, average cost: $143,900
| Here: | 5.6% |
| Illinois: | 4.2% |
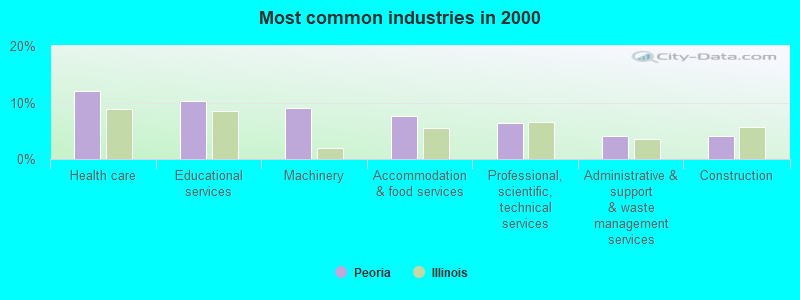
- Health care (12.0%)
- Educational services (10.3%)
- Machinery (9.1%)
- Accommodation & food services (7.6%)
- Professional, scientific, technical services (6.4%)
- Administrative & support & waste management services (4.1%)
- Construction (4.1%)
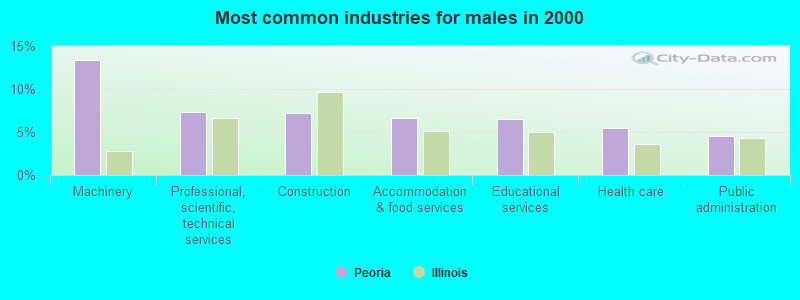
- Machinery (13.4%)
- Professional, scientific, technical services (7.3%)
- Construction (7.2%)
- Accommodation & food services (6.6%)
- Educational services (6.5%)
- Health care (5.4%)
- Public administration (4.5%)
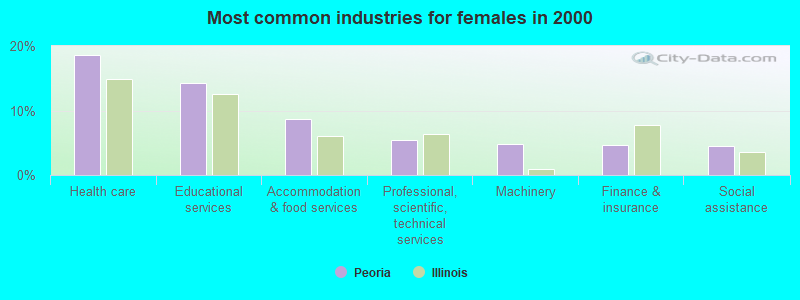
- Health care (18.6%)
- Educational services (14.3%)
- Accommodation & food services (8.7%)
- Professional, scientific, technical services (5.4%)
- Machinery (4.8%)
- Finance & insurance (4.7%)
- Social assistance (4.4%)
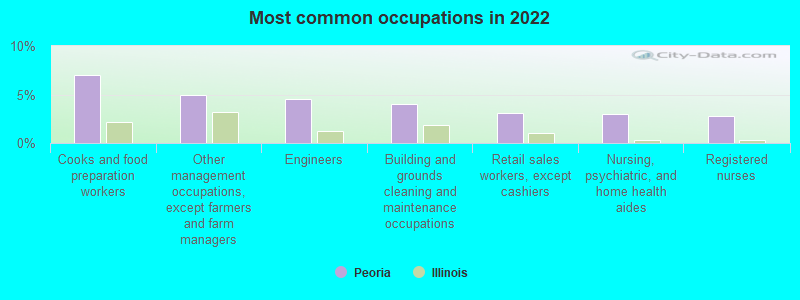
- Cooks and food preparation workers (7.0%)
- Other management occupations, except farmers and farm managers (5.0%)
- Engineers (4.5%)
- Building and grounds cleaning and maintenance occupations (4.0%)
- Retail sales workers, except cashiers (3.1%)
- Nursing, psychiatric, and home health aides (2.9%)
- Registered nurses (2.8%)
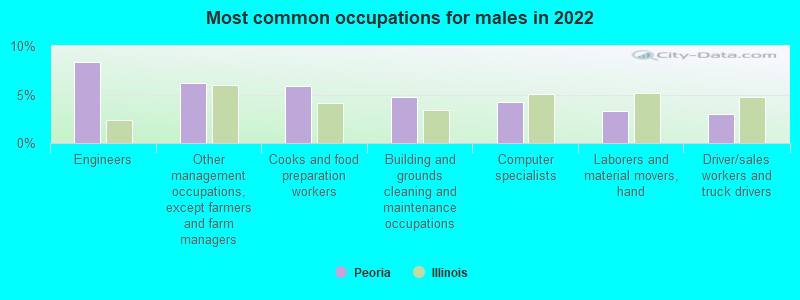
- Engineers (8.3%)
- Other management occupations, except farmers and farm managers (6.2%)
- Cooks and food preparation workers (5.8%)
- Building and grounds cleaning and maintenance occupations (4.7%)
- Computer specialists (4.2%)
- Laborers and material movers, hand (3.3%)
- Driver/sales workers and truck drivers (3.0%)

- Cooks and food preparation workers (8.1%)
- Nursing, psychiatric, and home health aides (5.4%)
- Registered nurses (5.1%)
- Other office and administrative support workers, including supervisors (3.9%)
- Other management occupations, except farmers and farm managers (3.8%)
- Waiters and waitresses (3.7%)
- Health technologists and technicians (3.6%)
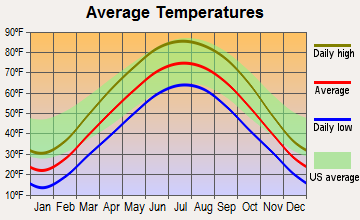
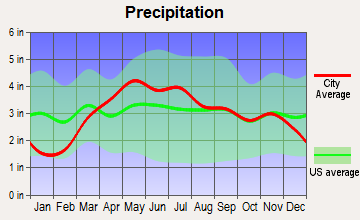
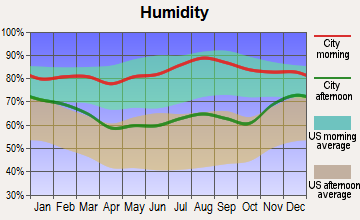
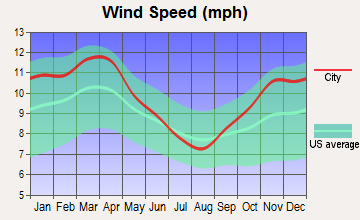
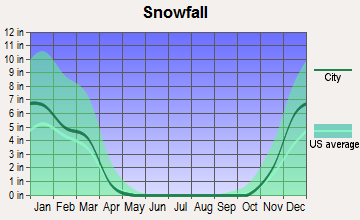
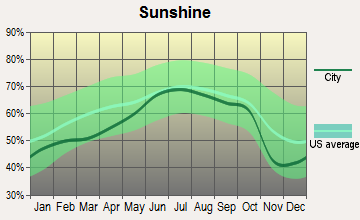
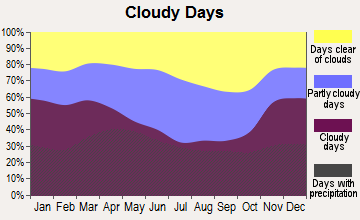
Average climate in Peoria, Illinois
Based on data reported by over 4,000 weather stations
|
|

(lower is better)
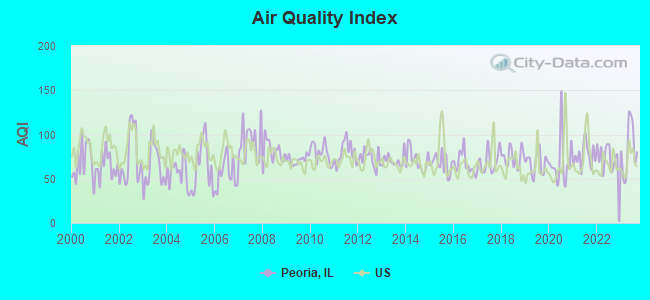
Air Quality Index (AQI) level in 2023 was 83.2. This is about average.
| City: | 83.2 |
| U.S.: | 72.6 |
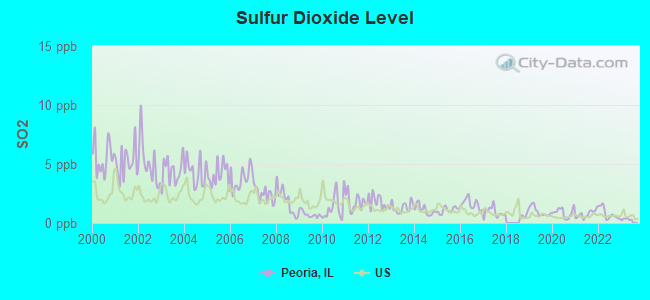
Sulfur Dioxide (SO2) [ppb] level in 2023 was 0.218. This is significantly better than average. Closest monitor was 1.1 miles away from the city center.
| City: | 0.218 |
| U.S.: | 1.515 |
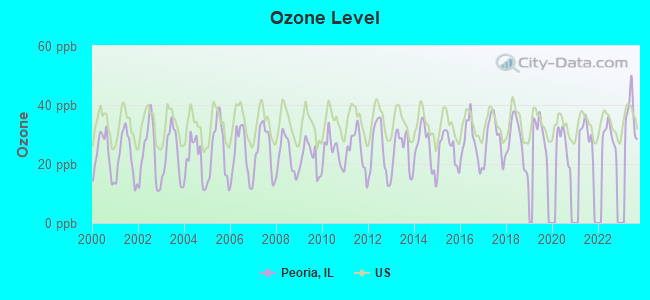
Ozone [ppb] level in 2023 was 36.9. This is about average. Closest monitor was 2.1 miles away from the city center.
| City: | 36.9 |
| U.S.: | 33.3 |
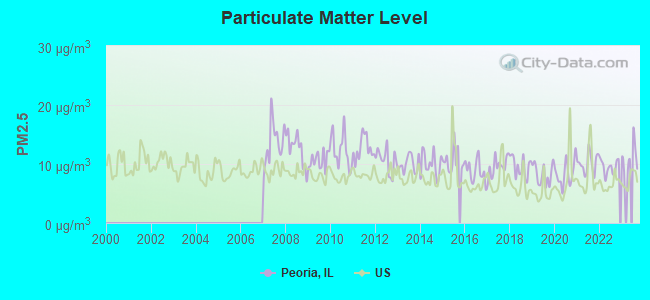
Particulate Matter (PM2.5) [µg/m3] level in 2023 was 11.1. This is worse than average. Closest monitor was 2.1 miles away from the city center.
| City: | 11.1 |
| U.S.: | 8.1 |
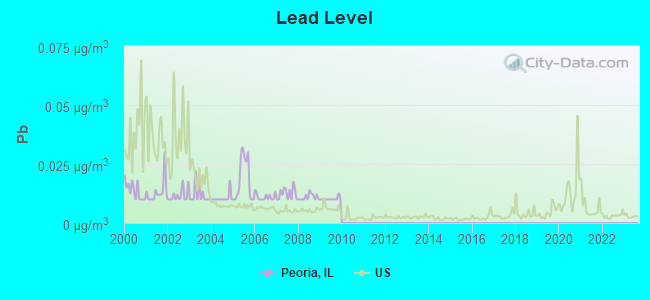
Lead (Pb) [µg/m3] level in 2009 was 0.0102. This is about average. Closest monitor was 1.7 miles away from the city center.
| City: | 0.0102 |
| U.S.: | 0.0093 |
Tornado activity:
Peoria-area historical tornado activity is slightly above Illinois state average. It is 86% greater than the overall U.S. average.
On 6/29/1976, a category F4 (max. wind speeds 207-260 mph) tornado 7.9 miles away from the Peoria city center caused between $50,000 and $500,000 in damages.
On 7/13/2004, a category F4 tornado 15.6 miles away from the city center injured 3 people.
Earthquake activity:
Peoria-area historical earthquake activity is significantly above Illinois state average. It is 131% greater than the overall U.S. average.On 4/18/2008 at 09:36:59, a magnitude 5.4 (5.1 MB, 4.8 MS, 5.4 MW, 5.2 MW, Class: Moderate, Intensity: VI - VII) earthquake occurred 181.8 miles away from the city center
On 6/10/1987 at 23:48:54, a magnitude 5.1 (4.9 MB, 4.4 MS, 4.6 MS, 5.1 LG) earthquake occurred 160.2 miles away from Peoria center
On 4/18/2008 at 09:36:59, a magnitude 5.2 (5.2 MW, Depth: 8.9 mi) earthquake occurred 181.9 miles away from the city center
On 6/18/2002 at 17:37:15, a magnitude 5.0 (4.3 MB, 4.6 MW, 5.0 LG) earthquake occurred 212.9 miles away from Peoria center
On 4/18/2008 at 15:14:16, a magnitude 4.8 (4.5 MB, 4.8 MW, 4.6 MW, Class: Light, Intensity: IV - V) earthquake occurred 181.5 miles away from the city center
On 6/28/2004 at 06:10:52, a magnitude 4.2 (4.2 MW, Depth: 6.2 mi) earthquake occurred 63.1 miles away from Peoria center
Magnitude types: regional Lg-wave magnitude (LG), body-wave magnitude (MB), surface-wave magnitude (MS), moment magnitude (MW)
Natural disasters:
The number of natural disasters in Peoria County (14) is near the US average (15).Major Disasters (Presidential) Declared: 8
Emergencies Declared: 5
Causes of natural disasters: Storms: 8, Floods: 7, Snows: 2, Snowstorms: 2, Winter Storms: 2, Blizzard: 1, Hurricane: 1, Tornado: 1, Wind: 1, Other: 1 (Note: some incidents may be assigned to more than one category).
Main business address for: CATERPILLAR INC (CONSTRUCTION MACHINERY & EQUIP), RLI CORP (FIRE, MARINE & CASUALTY INSURANCE).
Hospitals in Peoria:
- ANDOVER (4636 WEST ANDOVER)
- GEORGE A ZELLER MENTAL HLTH CTR (provides emergency services, 5407 NORTH UNIVERSITY AVE)
- HART HOUSE (905 NORTHEAST PERRY STREET)
- HARTRICK HOUSE (702 NORTHEAST MADISON STREET)
- LYONS COURT (4405 WEST LYONS COURT)
- METHODIST MED CTR OF IL HOSP S (221 NE GLEN OAK)
- METHODIST MEDICAL CENTER OF ILLINOIS (Voluntary non-profit - Other, 221 N E GLEN OAK AVE)
- OSF SAINT FRANCIS OUTPATIENT SURGERY CENTER (8800 ROUTE 91 NORTH)
- PROCTOR HOSPITAL (Voluntary non-profit - Private, 5409 N KNOXVILLE AVE)
- SAINT FRANCIS MEDICAL CENTER (Voluntary non-profit - Church, 530 NE GLEN OAK AVE)
Airports and heliports located in Peoria:
- General Downing - Peoria International Airport (PIA) (Runways: 2, Commercial Ops: 2,945, Air Taxi Ops: 14,691, Itinerant Ops: 11,190, Local Ops: 4,140, Military Ops: 6,707)
- Mount Hawley Auxiliary Airport (3MY) (Runways: 1, Air Taxi Ops: 300, Itinerant Ops: 8,000, Local Ops: 12,700)
- Osf Saint Francis Medical Center Heliport (LL37)
- Unity Point Health - Methodist Heliport (IL04)
- Unity Point Health - Proctor Heliport (2IS1)
Colleges/Universities in Peoria:
- Bradley University (Full-time enrollment: 5,152; Location: 1501 W Bradley Ave; Private, not-for-profit; Website: www.bradley.edu; Offers Doctor's degree)
- Methodist College (Full-time enrollment: 619; Location: 415 St. Mark Court; Private, not-for-profit; Website: www.methodistcol.edu)
- Saint Francis Medical Center College of Nursing (Full-time enrollment: 472; Location: 511 NE Greenleaf St; Private, not-for-profit; Website: www.sfmccon.edu/; Offers Doctor's degree)
- Midstate College (Full-time enrollment: 453; Location: 411 W Northmoor Road; Private, for-profit; Website: www.midstate.edu)
- Tricoci University of Beauty Culture-Peoria (Full-time enrollment: 149; Location: 602 W Glen Ave; Private, for-profit; Website: www.tricociuniversity.com)
- Regency Beauty Institute-Peoria (Full-time enrollment: 89; Location: 2601 West Lake Ave, Suite B-1A; Private, for-profit; Website: www.regency.edu)
Other colleges/universities with over 2000 students near Peoria:
- Illinois Central College (about 5 miles; East Peoria, IL; Full-time enrollment: 7,158)
- Heartland Community College (about 34 miles; Normal, IL; FT enrollment: 3,958)
- Illinois State University (about 36 miles; Normal, IL; FT enrollment: 18,804)
- Illinois Wesleyan University (about 37 miles; Bloomington, IL; FT enrollment: 2,323)
- Illinois Valley Community College (about 49 miles; Oglesby, IL; FT enrollment: 2,747)
- Western Illinois University (about 60 miles; Macomb, IL; FT enrollment: 10,755)
- Black Hawk College (about 69 miles; Moline, IL; FT enrollment: 5,086)
Biggest public high schools in Peoria:
- RICHWOODS HIGH SCHOOL (Students: 1,373, Location: 6301 N UNIVERSITY ST, Grades: 9-12)
- LIMESTONE COMMUNITY HIGH SCHOOL (Students: 1,133, Location: 4201 AIRPORT RD, Grades: 9-12)
- PEORIA HIGH SCHOOL (Students: 934, Location: 1615 N NORTH ST, Grades: 9-12)
- GREELEY ALTERNATIVE SCHOOL (Students: 81, Location: 1800 NE PERRY AVE, Grades: 6-12)
- DAY TREATMENT (Students: 75, Location: 1419 S FOLKERS AVE, Grades: 4-12)
- ROBERT A JAMIESON SCHOOL (Students: 74, Location: 2721 W RICHWOODS BLVD, Grades: PK-12)
- PEORIA CTY JVNL DET CTR 9-12 (Students: 41, Location: 223 N MAXWELL RD, Grades: 9-12)
- MANUAL ACADEMY (Location: 811 S GRISWOLD ST, Grades: 7-12)
- ROLLING ACRES MIDDLE SCHOOL (Location: 5617 N MERRIMAC AVE, Grades: 5-12)
- KNOXVILLE CENTER FOR STUDENT SUCCESS (Location: 2628 N KNOXVILLE AVE, Grades: 9-12)
Private high schools in Peoria:
- PEORIA CHRISTIAN SCHOOL (Students: 924, Location: 3506 N CALIFORNIA AVE, Grades: PK-12)
- PEORIA NOTRE DAME HIGH SCHOOL (Students: 790, Location: 5105 N SHERIDAN RD, Grades: 9-12)
- KIEFER SCHOOL (Students: 120, Location: 404 N E MADISON AVE, Grades: 2-12)
- ALETHEIA SCHOOL (Students: 36, Location: 7229 N KNOXVILLE AVE, Grades: PK-9)
- NEW LIFE CHRISTIAN ACADEMY (Students: 19, Location: 3510 W MALONE ST, Grades: 1-12)
Biggest public elementary/middle schools in Peoria:
- ROOSEVELT MAGNET SCHOOL (Students: 661, Location: 1704 W AIKEN AVE, Grades: KG-8)
- HINES PRIMARY SCHOOL (Students: 468, Location: 4603 N KNOXVILLE AVE, Grades: KG-4)
- NORTHMOOR PRIMARY SCHOOL (Students: 438, Location: 1819 W NORTHMOOR RD, Grades: PK-4)
- TREWYN K-8 SCHOOL (Students: 435, Location: 1419 S FOLKERS AVE, Grades: KG-8)
- WOODROW WILSON PRIMARY SCHOOL (Students: 415, Location: 1907 W FORREST HILL AVE, Grades: PK-4)
- FRANKLIN PRIMARY SCHOOL (Students: 410, Location: 807 W COLUMBIA TER, Grades: PK-5)
- KELLAR PRIMARY SCHOOL (Students: 404, Location: 6413 N MOUNT HAWLEY RD, Grades: KG-4)
- VON STEUBEN MIDDLE SCHOOL (Students: 399, Location: 801 E FORREST HILL AVE, Grades: 5-8)
- CHARLES A LINDBERGH MIDDLE SCHOOL (Students: 376, Location: 6327 N SHERIDAN RD, Grades: 5-8)
- WHITTIER PRIMARY SCHOOL (Students: 371, Location: 1619 W FREDONIA AVE, Grades: PK-4)
Biggest private elementary/middle schools in Peoria:
- ST VINCENT DE PAUL SCHOOL (Students: 510, Location: 6001 N UNIVERSITY ST, Grades: PK-8)
- ST PHILOMENA SCHOOL (Students: 421, Location: 3216 N EMERY AVE, Grades: PK-8)
- PEORIA ACADEMY (Students: 316, Location: 2711 W WILLOW KNOLLS DR, Grades: PK-8)
- HOLY FAMILY PARISH SCHOOL (Students: 208, Location: 2329 W RESERVOIR BLVD, Grades: PK-8)
- CONCORDIA LUTHERAN SCHOOL (Students: 194, Location: 2000 W GLEN AVE, Grades: KG-8)
- ST MARK SCHOOL (Students: 179, Location: 711 N UNDERHILL ST, Grades: PK-8)
- CHRIST LUTHERAN SCHOOL (Students: 178, Location: 1311 S FARADAY AVE, Grades: PK-8)
- DAARUL ULOOM (Students: 133, Location: 4125 W CHARTER OAK RD, Grades: PK-8)
- ST JUDE CATHOLIC SCHOOL (Students: 94, Location: 10811 N KNOXVILLE AVE, Grades: PK-4)
- MONTESSORI CHILDRENS HOUSE OF PEORIA (Students: 56, Location: 3601 N NORTH ST, Grades: PK-6)
User-submitted facts and corrections:
- The George A. Zeller Mental Health center has been defunct for several years. Illinois Central College is leasing the building currently as its ICC North Campus.
- GEORGE A ZELLER MENTAL HLTH CTR (5407 NORTH UNIVERSITY AVE) is no longer a health care facility. It has been closed and is a campus of Illinois Central College. added by PatrickJ13
- Limestone Community High School, on Garfield, Bartonville, Illinois.
- Betty Frieden (author of "The Feminine Mystique", and catalyst to the women's feminist movement) was born in Peoria, IL on February 4, 1921 added by Emily C
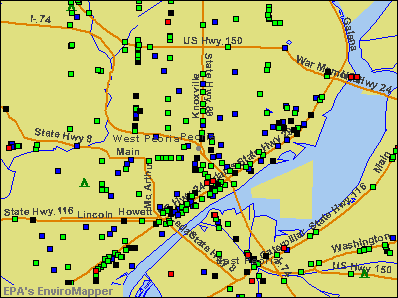
Points of interest:
Notable locations in Peoria: Leo Donovan Golf Course (A), Salvation Army Camp (B), Camp Wokanda Boy Scout Camp (C), Detweiller Marina (D), Detweiller Golf Course (E), George Luthy Memorial Botanical Garden (F), Glen Oak Pool (G), Madison Municipal Golf Course (H), Union Station (I), South Park Pool (J), Tanglewood Shopping Cente (K), Willow Knolls Country Club (L), Exposition Gardens (M), Newman Golf Course (N), Madison Park Golf Course (O), Newman Golf Course (P), Mount Hawley Country Club (Q), Northmoor Municipal Golf Course (R), Kellogg Golf Course (S), Iowa Junction (T). Display/hide their locations on the map
Shopping Centers: Campustown Shopping Center (1), Covington Square Shopping Center (2), Dominion Square Shopping Center (3), Evergreen Square Shopping Center (4), Forrest Hill Plaza Shopping Center (5), Fulton Plaza Shopping Center (6), Glen Plaza Shopping Center (7), Junction City Shopping Center (8), Metro Centre Shopping Center (9). Display/hide their locations on the map
Main business address in Peoria include: CATERPILLAR INC (A), RLI CORP (B). Display/hide their locations on the map
Churches in Peoria include: Olivet Church (A), First Baptist Church of Peoria (B), First Church of Christ Scientist (C), First Presbyterian Church (D), Abundant Life Church (E), All Nation Pentecostal Church (F), All Saints Greek Orthodox Church (G), Apostolic Christian Church (H), Apostolic Missionary Church (I). Display/hide their locations on the map
Cemeteries: Hawley Cemetery (1), Parkview Cemetery (2), Resurrection Cemetery (3), Springdale Cemetery (4), Swan Lake Memory Gardens (5). Display/hide their locations on the map
Reservoirs: Peoria Heights Reservoir (A), Charter Oak Village Lake (B), Charter Oak North Lake (C), Lake Lynnhurst (D). Display/hide their locations on the map
Creek: Kickapoo Creek (A). Display/hide its location on the map
Parks in Peoria include: Mount Hawley Park (1), Robinson Park (2), Detweiller Woods Nature Preserve (3), Forest Park Nature Preserve (4), Robinson Park Hill Prairies Nature Preserve (5), Peoria Stadium (6), Detweiller Park (7), Trewyn Park (8), Lindbergh Park (9). Display/hide their locations on the map
Tourist attractions: African American Hall of Fame Museum (309 South Dusable Street) (1), Daughters of the American Revolution-Peoria Chaptr (Museums; 611 Southwest Washington Street) (2), Glen Oak Zoo (Cultural Attractions- Events- & Facilities; 2218 North Prospect Road) (3), Lakeview Museum of Arts & Sciences (Planetariums; 1125 West Lake Avenue) (4), Amusement Devices of IL (Amusement & Theme Parks; 2606 North Knoxville Avenue) (5), Alexander Travel (Tours & Charters; 4700 North University Street Spc 66) (6). Display/hide their approximate locations on the map
Hotels: Courtyard Peoria (1928 West War Memorial Drive) (1), Best Western Signature Inn Peoria (4112 North Brandywine Drive) (2), Fairfield Inn Peoria (2002 West War Memorial Drive) (3), Hawthorne Inn (6906 North Stalworth Drive) (4), Four Seasons Mobile Home Community (1821 North Lancelot Place) (5), Avis Rent A Car D-T Holiday Inn City Center (500 Hamilton Boulevard Suite 4) (6), Health Solutions of North Peoria (5037 West American Prairie Drive) (7), Deluxe Motel (5712 North Knoxville Avenue) (8), Americinn - Peoria- Il (9106 N Lindbergh Dr) (9). Display/hide their approximate locations on the map
Courts: United States Government - Federal Courts-Central District- Official Court Repo (1500 Northeast Jefferson Avenue) (1), Peoria County - Chief Judge- Court Administrator (324 Main Street) (2), United States Government - Federal Courts-Central District- Bankruptcy C (100 Northeast Monroe Street) (3), Peoria County - Civil Process- Sheriff's Department- Court Security (324 Main Street) (4), Peoria County - Court Counseling (228 Northeast Jefrsn Avenue) (5), Peoria County - Chief Judge- Court Scheduling (324 Main Street) (6), Peoria County - Juvenile Court Services (324 Main Street) (7). Display/hide their approximate locations on the map
Birthplace of: Diane Ablonczy - Politician, Nancy Brinker - Founder and CEO of Susan G. Komen for the Cure, Betty Friedan - Activist, Richard Pryor - (born 1940), comedian, Ray LaHood - Congressman, Joe Girardi - Baseball player, Frank Wead - Naval aviator, Robert H. Michel - Recipient of the Purple Heart medal, Harry Frazee - Theatre manager, Wayne A. Downing - Retired four-star Army general.
Drinking water stations with addresses in Peoria and their reported violations in the past:
REST AREA I-74W MACKINAW DELLS (Population served: 975, Groundwater):Past health violations:REST AREA I74E MACKINAW DELLS (Population served: 975, Groundwater):Past monitoring violations:
- MCL, Monthly (TCR) - In OCT-2010, Contaminant: Coliform. Follow-up actions: St Compliance achieved (MAY-04-2010)
- One routine major monitoring violation
Past health violations:STREATOR BAPTIST CAMP -OFFICE WELL (Population served: 750, Groundwater):Past monitoring violations:
- MCL, Acute (TCR) - Between OCT-2010 and DEC-2010, Contaminant: Coliform. Follow-up actions: St Formal NOV issued (DEC-03-2010), St Site Visit (enforcement) (DEC-07-2010), St Compliance achieved (DEC-20-2011)
- Monitoring, Repeat Major (TCR) - Between JAN-2010 and MAR-2010, Contaminant: Coliform (TCR). Follow-up actions: St Compliance achieved (APR-26-2010)
Past health violations:NSPOA CAMPGROUND (Population served: 600, Groundwater):Past monitoring violations:
- MCL, Acute (TCR) - Between JAN-2006 and DEC-2006, Contaminant: Coliform. Follow-up actions: St Public Notif requested (SEP-08-2006), St Compliance achieved (JUN-04-2007)
- One regular monitoring violation
Past health violations:STARVED ROCK STATE PARK (94227) (Population served: 500, Groundwater):Past monitoring violations:
- MCL, Acute (TCR) - Between APR-2011 and JUN-2011, Contaminant: Coliform. Follow-up actions: St Public Notif requested (JUL-06-2011), St Compliance achieved (SEP-01-2012)
- MCL, Acute (TCR) - Between APR-2010 and JUN-2010, Contaminant: Coliform. Follow-up actions: St Compliance achieved (MAY-24-2011)
- One routine major monitoring violation
- 2 regular monitoring violations
Past health violations:ROLLING OAKS OFFICE WELL (Population served: 250, Groundwater):Past monitoring violations:
- MCL, Monthly (TCR) - In OCT-2007, Contaminant: Coliform. Follow-up actions: St Public Notif requested (NOV-16-2007), St Compliance achieved (JAN-13-2009)
- Monitoring, Repeat Major (TCR) - Between JAN-2010 and DEC-2010, Contaminant: Coliform (TCR)
- One minor monitoring violation
Past monitoring violations:ROLLING OAKS CAMPGROUND (113555) (Population served: 250, Groundwater):
- One routine major monitoring violation
- 2 regular monitoring violations
Past monitoring violations:LOST ARROW CAMPOMINIUM (Population served: 223, Groundwater):
- 4 routine major monitoring violations
- One regular monitoring violation
Past health violations:Past monitoring violations:
- MCL, Single Sample - Between JAN-2009 and DEC-2009, Contaminant: Nitrate. Follow-up actions: St Formal NOV issued (AUG-13-2009), St Compliance achieved (DEC-30-2010)
- One routine major monitoring violation
Drinking water stations with addresses in Peoria that have no violations reported:
- GRAND BEAR LODGE LLC #6 NORTH (Population served: 1,005, Primary Water Source Type: Groundwater)
- GLENWOOD FARMS (711) (Population served: 600, Primary Water Source Type: Groundwater)
- GRAND BEAR LODGE WELL #7 SOUTH (Population served: 400, Primary Water Source Type: Groundwater)
- LIVING SPRINGS CAMP (Population served: 250, Primary Water Source Type: Groundwater)
- ILLINI STATE PARK (Population served: 200, Primary Water Source Type: Groundwater)
- FISH N FUN CLUB (Population served: 150, Primary Water Source Type: Groundwater)
- HICKORY HILLS CAMPGROUND (Population served: 150, Primary Water Source Type: Groundwater)
- GRAND BEAR LODGE LLC #1 SOUTH (Population served: 120, Primary Water Source Type: Groundwater)
- GRAND BEAR LODGE LLC #2 SOUTH (Population served: 120, Primary Water Source Type: Groundwater)
- MILLPOINT CAMPGROUND (Population served: 100, Primary Water Source Type: Groundwater)
| This city: | 2.4 people |
| Illinois: | 2.6 people |
| This city: | 58.0% |
| Whole state: | 65.8% |
| This city: | 6.9% |
| Whole state: | 6.3% |
Likely homosexual households (counted as self-reported same-sex unmarried-partner households)
- Lesbian couples: 0.4% of all households
- Gay men: 0.4% of all households
People in group quarters in Peoria in 2010:
- 2,096 people in college/university student housing
- 1,109 people in nursing facilities/skilled-nursing facilities
- 200 people in correctional residential facilities
- 138 people in emergency and transitional shelters (with sleeping facilities) for people experiencing homelessness
- 121 people in other noninstitutional facilities
- 85 people in residential treatment centers for adults
- 73 people in group homes intended for adults
- 6 people in workers' group living quarters and job corps centers
- 4 people in group homes for juveniles (non-correctional)
People in group quarters in Peoria in 2000:
- 2,607 people in college dormitories (includes college quarters off campus)
- 1,261 people in nursing homes
- 478 people in other noninstitutional group quarters
- 245 people in other nonhousehold living situations
- 179 people in state prisons
- 166 people in homes for the mentally retarded
- 144 people in mental (psychiatric) hospitals or wards
- 77 people in other group homes
- 64 people in hospitals/wards and hospices for chronically ill
- 60 people in religious group quarters
- 56 people in hospitals or wards for drug/alcohol abuse
- 56 people in residential treatment centers for emotionally disturbed children
- 37 people in military hospitals or wards for chronically ill
- 27 people in other hospitals or wards for chronically ill
- 23 people in short-term care, detention or diagnostic centers for delinquent children
- 12 people in halfway houses
Banks with most branches in Peoria (2011 data):
- South Side Trust & Savings Bank of Peoria: 9 branches. Info updated 2006/11/03: Bank assets: $668.3 mil, Deposits: $535.4 mil, local headquarters, positive income, 14 total offices, Holding Company: Mid Illinois Bancorp, Inc.
- PNC Bank, National Association: 8 branches. Info updated 2012/03/20: Bank assets: $263,309.6 mil, Deposits: $197,343.0 mil, headquarters in Wilmington, DE, positive income, Commercial Lending Specialization, 3085 total offices, Holding Company: Pnc Financial Services Group, Inc., The
- JPMorgan Chase Bank, National Association: Peoria Main Branch, Knoxville Branch, Evergreen Square Krogers Branch, Sterling Plaza-Krogers Branch, Wisconsin Plaza Branch. Info updated 2011/11/10: Bank assets: $1,811,678.0 mil, Deposits: $1,190,738.0 mil, headquarters in Columbus, OH, positive income, International Specialization, 5577 total offices, Holding Company: Jpmorgan Chase & Co.
- Commerce Bank: Knoxville Avenue Facility, Northpoint Branch, Grand Prairie Branch, Peoria Main Branch. Info updated 2011/07/07: Bank assets: $20,493.6 mil, Deposits: $16,805.3 mil, headquarters in Kansas City, MO, positive income, 206 total offices, Holding Company: Commerce Bancshares, Inc.
- Busey Bank: Jefferson Avenue Branch, Sheridan Branch, Kumpf Branch, Route 91 Peoria Branch. Info updated 2010/01/25: Bank assets: $3,345.6 mil, Deposits: $2,767.4 mil, headquarters in Champaign, IL, positive income, Commercial Lending Specialization, 49 total offices, Holding Company: First Busey Corporation
- Heartland Bank and Trust Company: Allen Road Branch, Peoria Branch, Technology Plaza Branch, West War Memorial Branch. Info updated 2011/08/08: Bank assets: $1,943.8 mil, Deposits: $1,632.9 mil, headquarters in Bloomington, IL, positive income, Commercial Lending Specialization, 49 total offices, Holding Company: Heartland Bancorp, Inc.
- Associated Bank, National Association: Peoria Knoxville Branch, Peoria - Jefferson Branch, Peoria - Pioneer Parkway, Peoria - Brandywine Branch. Info updated 2008/09/12: Bank assets: $21,715.0 mil, Deposits: $15,244.4 mil, headquarters in Green Bay, WI, positive income, Commercial Lending Specialization, 282 total offices, Holding Company: Associated Banc-Corp
- FIRST MID-ILLINOIS BANK & TRUST, NATIONAL ASSOCIATION: Wardcliffe Branch, Adams Branch, Knoxville - Peoria Branch. Info updated 2010/09/16: Bank assets: $1,492.8 mil, Deposits: $1,192.9 mil, headquarters in Mattoon, IL, positive income, Commercial Lending Specialization, 37 total offices, Holding Company: First Mid-Illinois Bancshares, Inc.
- Heritage Bank of Central Illinois: Willow Knolls Branch at 3420 W Willow Knolls Drive, branch established on 1997/09/09; Peoria Branch at 3100 West Harmon Highway, branch established on 1964/10/14. Info updated 2006/11/03: Bank assets: $314.6 mil, Deposits: $242.0 mil, headquarters in Trivoli, IL, positive income, Commercial Lending Specialization, 6 total offices, Holding Company: Trivoli Bancorp, Inc.
- 12 other banks with 14 local branches
For population 15 years and over in Peoria:
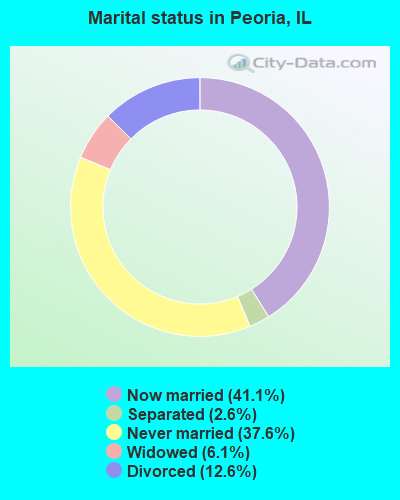
- Never married: 37.6%
- Now married: 41.1%
- Separated: 2.6%
- Widowed: 6.1%
- Divorced: 12.6%
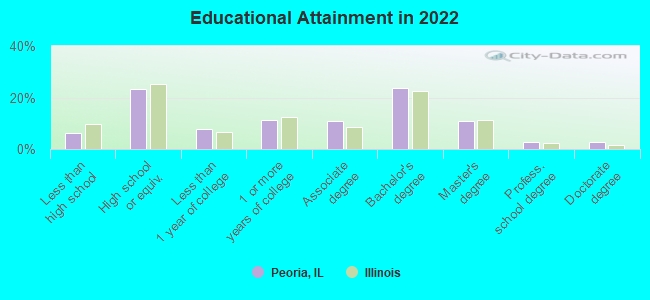
For population 25 years and over in Peoria:
- High school or higher: 93.6%
- Bachelor's degree or higher: 40.2%
- Graduate or professional degree: 16.5%
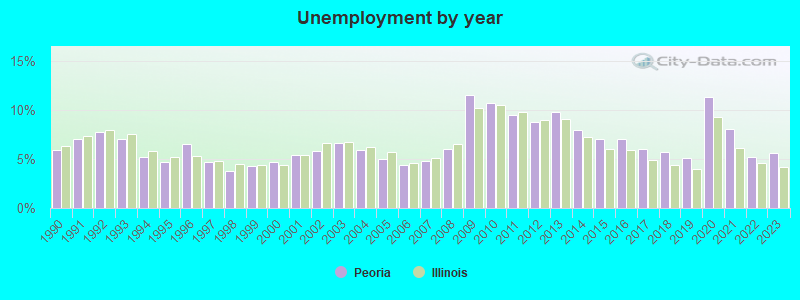
- Unemployed: 7.4%
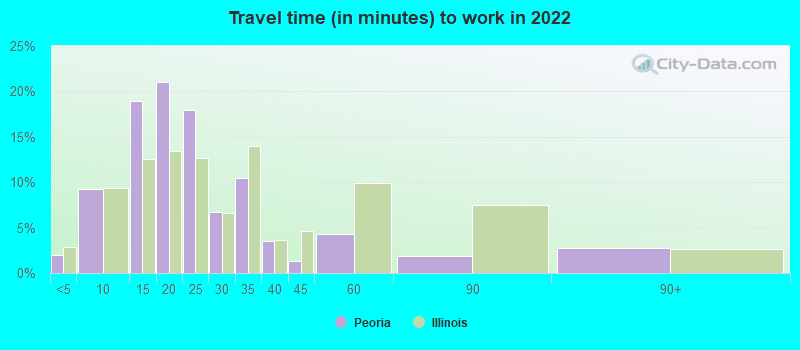
- Mean travel time to work (commute): 16.6 minutes

| Here: | 10.8 |
| Illinois average: | 12.5 |
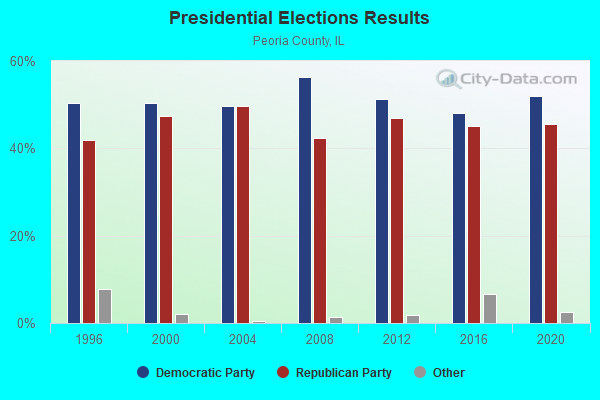

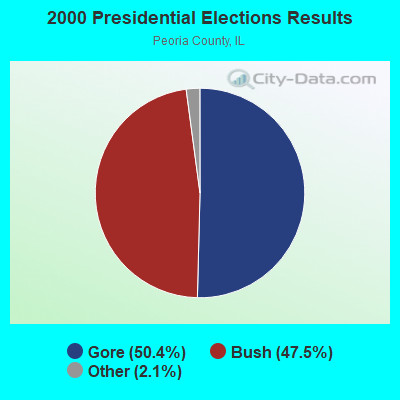


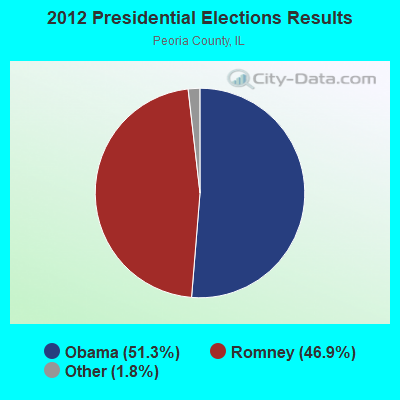
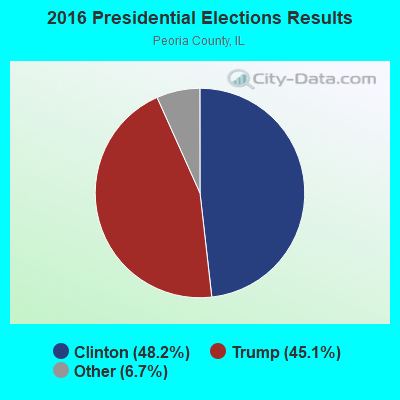
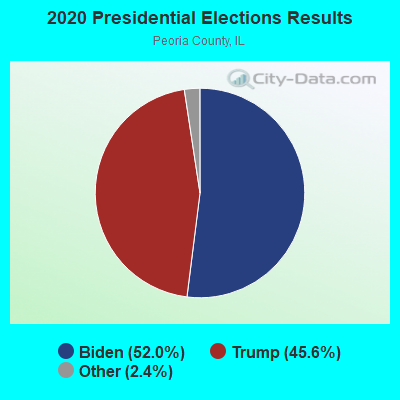
Graphs represent county-level data. Detailed 2008 Election Results
Neighborhoods in Peoria:
(Peoria, Illinois Neighborhood Map)- Altamont Park neighborhood
- Ancient Oaks neighborhood
- Arbor District neighborhood
- Armstrong Ellis neighborhood
- Averyville neighborhood
- Bevalon neighborhood
- Briardale neighborhood
- Chadwick Place neighborhood
- Charter Oak Village neighborhood
- Columbia Terrave North neighborhood
- Cottage District neighborhood
- Crab Orchard neighborhood
- Deerbrook neighborhood
- Detweiller Marina neighborhood
- Downtown neighborhood
- East Bluff NHS neighborhood
- East Bluff Serenity neighborhood
- East Bluff United neighborhood
- Edgewild neighborhood
- Fairfax Addition neighborhood
- Forrest Hill neighborhood
- Franklin School neighborhood
- Gale Avenue neighborhood
- Gift Area neighborhood
- Glen Oak Historic neighborhood
- Glen Oak Park neighborhood
- Glencrest neighborhood
- Goose Lake neighborhood
- Hamilton Park neighborhood
- Hawley Hills neighborhood
- Hawthorne Hills (Tanglewood) neighborhood
- Heart of Peoria neighborhood
- High Point neighborhood
- High Wine neighborhood
- I-74 neighborhood
- Idyllbrook neighborhood
- Joeanne Manor neighborhood
- Kellar Heights neighborhood
- Knoll Crest neighborhood
- Knollls neighborhood
- Lexington Ridge neighborhood
- Lincoln Park neighborhood
- Logan Park West neighborhood
- Lyndale Road neighborhood
- Lynnhurst neighborhood
- Madison Manor neighborhood
- Martin-Warren Southside neighborhood
- Moss Bradley neighborhood
- Near Northside neighborhood
- North Prospect neighborhood
- Northgate neighborhood
- Northmoor Knolls neighborhood
- Northmoore Hills neighborhood
- Oakbrook neighborhood
- Oakcliff neighborhood
- Olde Towne North neighborhood
- Olde Towne South neighborhood
- Orchard District neighborhood
- Parkview neighborhood
- Prospect Road neighborhood
- Randolph-Roanoke neighborhood
- Richwoods Knolls (Northmoor Estates) neighborhood
- Ridgewood Knolls neighborhood
- Rolling Acres neighborhood
- Sheridan Triange neighborhood
- Sherwood Forest neighborhood
- Skyline Drive neighborhood
- Spring Grove neighborhood
- Sunset Hills neighborhood
- University East neighborhood
- Uplands neighborhood
- Village Grande neighborhood
- Vinton Highlands neighborhood
- Wardcliffe neighborhood
- Warehouse District neighborhood
- West Central neighborhood
- West Main neighborhood
- West Meadows Place neighborhood
- West Park Knolls neighborhood
- Western Avenue Greenway neighborhood
- Williamsburg neighborhood
- Willow Knolls neighborhood
- Willow Lake Village neighborhood
- Windchime neighborhood
- Woodbrook Manor neighborhood
- Yorkshire Village neighborhood
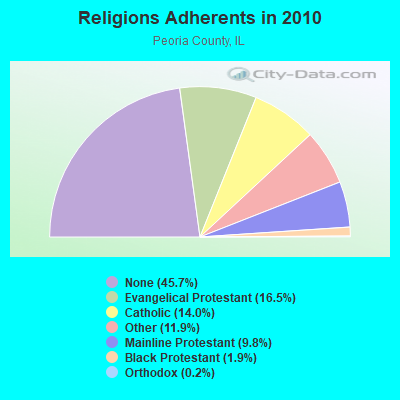
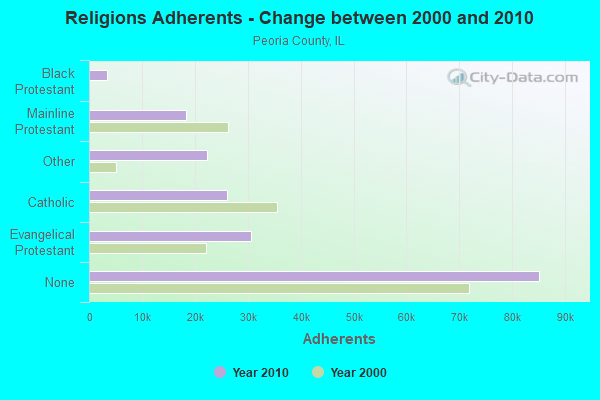
Religion statistics for Peoria, IL (based on Peoria County data)
| Religion | Adherents | Congregations |
|---|---|---|
| Evangelical Protestant | 30,685 | 123 |
| Catholic | 26,165 | 20 |
| Other | 22,276 | 16 |
| Mainline Protestant | 18,343 | 56 |
| Black Protestant | 3,482 | 15 |
| Orthodox | 396 | 2 |
| None | 85,147 | - |
Food Environment Statistics:
| This county: | 1.97 / 10,000 pop. |
| Illinois: | 2.24 / 10,000 pop. |
| This county: | 0.11 / 10,000 pop. |
| Illinois: | 0.08 / 10,000 pop. |
| This county: | 0.44 / 10,000 pop. |
| Illinois: | 0.75 / 10,000 pop. |
| This county: | 3.33 / 10,000 pop. |
| State: | 2.61 / 10,000 pop. |
| This county: | 8.69 / 10,000 pop. |
| Illinois: | 6.86 / 10,000 pop. |
| Peoria County: | 9.4% |
| Illinois: | 8.3% |
| This county: | 28.2% |
| State: | 25.2% |
| This county: | 13.9% |
| Illinois: | 14.5% |
Health and Nutrition:
| This city: | 50.8% |
| State: | 49.5% |
| This city: | 48.4% |
| State: | 47.2% |
| Here: | 28.7 |
| Illinois: | 28.6 |
| Peoria: | 19.2% |
| Illinois: | 20.5% |
| Peoria: | 11.3% |
| State: | 10.8% |
| Here: | 6.8 |
| State: | 6.8 |
| Peoria: | 33.5% |
| State: | 33.4% |
| This city: | 57.1% |
| Illinois: | 56.4% |
| Peoria: | 79.8% |
| State: | 79.9% |
More about Health and Nutrition of Peoria, IL Residents
| Local government employment and payroll (March 2022) | |||||
| Function | Full-time employees | Monthly full-time payroll | Average yearly full-time wage | Part-time employees | Monthly part-time payroll |
|---|---|---|---|---|---|
| Police Protection - Officers | 197 | $1,525,686 | $92,935 | 0 | $0 |
| Firefighters | 113 | $862,665 | $91,610 | 0 | $0 |
| Local Libraries | 67 | $299,702 | $53,678 | 18 | $13,304 |
| Other and Unallocable | 66 | $501,458 | $91,174 | 1 | $311 |
| Fire - Other | 59 | $450,951 | $91,719 | 0 | $0 |
| Streets and Highways | 45 | $306,091 | $81,624 | 20 | $28,521 |
| Financial Administration | 27 | $167,560 | $74,471 | 0 | $0 |
| Police - Other | 20 | $88,101 | $52,861 | 0 | $0 |
| Other Government Administration | 12 | $105,944 | $105,944 | 17 | $19,284 |
| Judicial and Legal | 7 | $33,280 | $57,051 | 0 | $0 |
| Parks and Recreation | 4 | $25,954 | $77,862 | 8 | $10,945 |
| Housing and Community Development (Local) | 3 | $29,235 | $116,940 | 0 | $0 |
| Totals for Government | 620 | $4,396,627 | $85,096 | 64 | $72,364 |
Peoria government finances - Expenditure in 2021 (per resident):
- Construction - Central Staff Services: $2,135,000 ($19.23)
General - Other: $1,644,000 ($14.81)
Police Protection: $116,000 ($1.04)
Regular Highways: $102,000 ($0.92)
Local Fire Protection: $29,000 ($0.26)
- Current Operations - Police Protection: $43,824,000 ($394.74)
Local Fire Protection: $34,756,000 ($313.06)
General - Other: $32,437,000 ($292.17)
Regular Highways: $22,811,000 ($205.47)
Central Staff Services: $11,169,000 ($100.60)
Libraries: $9,536,000 ($85.89)
- General - Interest on Debt: $6,358,000 ($57.27)
- Other Capital Outlay - Central Staff Services: $9,323,000 ($83.98)
Regular Highways: $4,090,000 ($36.84)
Sewerage: $1,926,000 ($17.35)
Solid Waste Management: $1,853,000 ($16.69)
Libraries: $968,000 ($8.72)
- Total Salaries and Wages: $65,520,000 ($590.16)
Peoria government finances - Revenue in 2021 (per resident):
- Charges - Other: $22,024,000 ($198.38)
Parks and Recreation: $14,995,000 ($135.06)
Solid Waste Management: $9,271,000 ($83.51)
Sewerage: $7,510,000 ($67.64)
Parking Facilities: $1,100,000 ($9.91)
- Federal Intergovernmental - General Local Government Support: $5,912,000 ($53.25)
Housing and Community Development: $2,477,000 ($22.31)
Other: $9,000 ($0.08)
- Miscellaneous - General Revenue - Other: $4,836,000 ($43.56)
Interest Earnings: $670,000 ($6.03)
- State Intergovernmental - General Local Government Support: $47,989,000 ($432.25)
Highways: $5,354,000 ($48.23)
- Tax - Property: $37,508,000 ($337.85)
General Sales and Gross Receipts: $21,999,000 ($198.15)
Public Utilities Sales: $10,206,000 ($91.93)
Other Selective Sales: $8,164,000 ($73.54)
Other License: $3,363,000 ($30.29)
Peoria government finances - Debt in 2021 (per resident):
- Long Term Debt - Beginning Outstanding - Unspecified Public Purpose: $179,682,000 ($1618.45)
Outstanding Unspecified Public Purpose: $161,838,000 ($1457.72)
Retired Unspecified Public Purpose: $37,504,000 ($337.81)
Issue, Unspecified Public Purpose: $19,660,000 ($177.08)
Peoria government finances - Cash and Securities in 2021 (per resident):
- Other Funds - Cash and Securities: $86,809,000 ($781.92)
| Businesses in Peoria, IL | ||||
| Name | Count | Name | Count | |
|---|---|---|---|---|
| ALDI | 2 | Kmart | 1 | |
| AT&T | 1 | Kohl's | 1 | |
| Abercrombie & Fitch | 1 | Kroger | 5 | |
| Ace Hardware | 2 | La-Z-Boy | 1 | |
| Advance Auto Parts | 1 | Lane Bryant | 1 | |
| Aeropostale | 2 | Lane Furniture | 3 | |
| AmericInn | 1 | LensCrafters | 1 | |
| American Eagle Outfitters | 2 | Little Caesars Pizza | 3 | |
| Ann Taylor | 1 | Long John Silver's | 1 | |
| Applebee's | 1 | Lowe's | 1 | |
| Arby's | 4 | Macy's | 1 | |
| Audi | 1 | Marriott | 3 | |
| AutoZone | 2 | Marshalls | 1 | |
| BMW | 1 | MasterBrand Cabinets | 9 | |
| Banana Republic | 1 | Maurices | 1 | |
| Barnes & Noble | 1 | Mazda | 1 | |
| Baskin-Robbins | 3 | McDonald's | 7 | |
| Bath & Body Works | 2 | Men's Wearhouse | 2 | |
| Baymont Inn | 1 | Menards | 1 | |
| Bed Bath & Beyond | 1 | Motherhood Maternity | 3 | |
| Blockbuster | 1 | New Balance | 3 | |
| Budget Car Rental | 1 | New York & Co | 1 | |
| Buffalo Wild Wings | 2 | Nike | 11 | |
| Burger King | 2 | Nissan | 1 | |
| Burlington Coat Factory | 1 | Office Depot | 1 | |
| CVS | 5 | OfficeMax | 1 | |
| Cache | 1 | Old Navy | 1 | |
| Caribou Coffee | 1 | Olive Garden | 1 | |
| Carson Pirie Scott | 2 | Pac Sun | 1 | |
| Casual Male XL | 1 | Panda Express | 1 | |
| Catherines | 1 | Panera Bread | 2 | |
| Charlotte Russe | 2 | Papa John's Pizza | 2 | |
| Chevrolet | 2 | Payless | 2 | |
| Chico's | 1 | Penske | 1 | |
| Chuck E. Cheese's | 1 | PetSmart | 1 | |
| Church's Chicken | 1 | Pier 1 Imports | 1 | |
| Circle K | 5 | Pizza Hut | 3 | |
| Clarks | 1 | Plato's Closet | 1 | |
| Cold Stone Creamery | 1 | Popeyes | 1 | |
| Coldwater Creek | 1 | Qdoba Mexican Grill | 1 | |
| Comfort Suites | 1 | Quiznos | 1 | |
| Curves | 1 | RadioShack | 3 | |
| DHL | 1 | Red Lobster | 1 | |
| Dairy Queen | 2 | Red Roof Inn | 1 | |
| Deb | 1 | Ruby Tuesday | 1 | |
| Decora Cabinetry | 1 | Ryder Rental & Truck Leasing | 1 | |
| Dennys | 1 | SAS Shoes | 2 | |
| Domino's Pizza | 2 | SONIC Drive-In | 1 | |
| DressBarn | 1 | Sam's Club | 1 | |
| Dressbarn | 1 | Sears | 2 | |
| Dunkin Donuts | 4 | Sephora | 1 | |
| Eddie Bauer | 1 | Shoe Carnival | 1 | |
| Express | 1 | Sleep Inn | 1 | |
| Extended Stay America | 1 | Soma Intimates | 1 | |
| Famous Footwear | 2 | Spencer Gifts | 1 | |
| FedEx | 22 | Sprint Nextel | 4 | |
| Finish Line | 1 | Starbucks | 6 | |
| Firestone Complete Auto Care | 1 | Steak 'n Shake | 4 | |
| Foot Locker | 1 | Subway | 10 | |
| Ford | 1 | Super 8 | 1 | |
| GNC | 4 | T-Mobile | 6 | |
| GameStop | 3 | T.G.I. Driday's | 1 | |
| Gap | 1 | T.J.Maxx | 1 | |
| Gymboree | 1 | Taco Bell | 3 | |
| H&R Block | 4 | Talbots | 1 | |
| Hardee's | 3 | Target | 1 | |
| Hilton | 1 | Toyota | 1 | |
| Hobby Lobby | 1 | Toys"R"Us | 2 | |
| Holiday Inn | 3 | U-Haul | 2 | |
| Hollister Co. | 1 | U.S. Cellular | 10 | |
| Home Depot | 1 | UPS | 26 | |
| HomeTown Buffet | 1 | Vans | 4 | |
| Honda | 1 | Verizon Wireless | 2 | |
| Hot Topic | 1 | Victoria's Secret | 1 | |
| Hyundai | 1 | Volkswagen | 1 | |
| IHOP | 1 | Walgreens | 5 | |
| JCPenney | 1 | Walmart | 2 | |
| Jimmy John's | 2 | Wendy's | 1 | |
| JoS. A. Bank | 1 | Wet Seal | 1 | |
| Jones New York | 7 | Wingate | 1 | |
| Journeys | 1 | World Gym | 1 | |
| Justice | 2 | YMCA | 1 | |
| KFC | 3 | |||
Strongest AM radio stations in Peoria:
- WWFS (1290 AM; 5 kW; PEORIA, IL; Owner: MONTEREY LICENSES, LLC)
- WVEL (1140 AM; daytime; 5 kW; PEKIN, IL)
- WPEO (1020 AM; daytime; 1 kW; PEORIA, IL)
- WMBD (1470 AM; 5 kW; PEORIA, IL; Owner: MONTEREY LICENSES, LLC)
- WOAM (1350 AM; 1 kW; PEORIA, IL; Owner: KELLY COMMUNICATIONS, INC.)
- WSCR (670 AM; 50 kW; CHICAGO, IL; Owner: INFINITY BROADCASTING OPERATIONS, INC.)
- WLS (890 AM; 50 kW; CHICAGO, IL; Owner: WLS, INC.)
- WGN (720 AM; 50 kW; CHICAGO, IL; Owner: WGN CONTINENTAL BROADCASTING CO.)
- WBBM (780 AM; 50 kW; CHICAGO, IL; Owner: INFINITY BROADCASTING OPERATIONS, INC.)
- WYLL (1160 AM; 50 kW; CHICAGO, IL; Owner: SCA LICENSE CORPORATION)
- WMVP (1000 AM; 50 kW; CHICAGO, IL; Owner: ABC, INC.)
- WTMJ (620 AM; 50 kW; MILWAUKEE, WI; Owner: JOURNAL BROADCAST CORPORATION)
- KXEN (1010 AM; 50 kW; FESTUS-ST. LOUIS, MO; Owner: BDJ RADIO ENTERPRISES, LLC)
Strongest FM radio stations in Peoria:
- W278AE (103.5 FM; PEORIA, IL; Owner: ILLINOIS STATE UNIVERSITY)
- WIXO (99.9 FM; BARTONVILLE, IL; Owner: REGENT BROADCASTING OF PEORIA, INC.)
- WSWT (106.9 FM; PEORIA, IL; Owner: MONTEREY LICENSES, LLC)
- WCBU (89.9 FM; PEORIA, IL; Owner: BRADLEY UNIVERSITY)
- WBNH (88.5 FM; PEKIN, IL; Owner: CENTRAL ILLINOIS RADIO FELLOWSHIP, INC.)
- WXMP (105.7 FM; PEORIA, IL; Owner: AAA ENTERTAINMENT LICENSING LLC)
- WPBG (93.3 FM; PEORIA, IL; Owner: MONTEREY LICENSES, LLC)
- WGLO (95.5 FM; PEKIN, IL; Owner: REGENT BROADCASTING OF PEORIA, INC.)
- WXCL (104.9 FM; PEKIN, IL; Owner: AAA ENTERTAINMENT LICENSING LLC)
- WFYR (97.3 FM; ELMWOOD, IL; Owner: REGENT BROADCASTING OF PEORIA, INC.)
- WPPY (101.1 FM; GLASFORD, IL; Owner: REGENT BROADCASTING OF PEORIA, INC.)
- WZPW (92.3 FM; PEORIA, IL; Owner: B&G BROADCASTING, INC.)
- WCIC (91.5 FM; PEKIN, IL; Owner: ILLINOIS BIBLE INSTITUTE, INC.)
- WPMJ (94.3 FM; CHILLICOTHE, IL; Owner: KELLY COMMUNICATIONS, INC.)
- WDQX (102.3 FM; MORTON, IL; Owner: AAA ENTERTAINMENT LICENSING LLC)
- WWCT (96.5 FM; FARMINGTON, IL; Owner: AAA ENTERTAINMENT LICENSING LLC)
- WRVP (98.5 FM; EUREKA, IL; Owner: REGENT BROADCASTING OF PEORIA, INC.)
- WBYS-FM (107.9 FM; CANTON, IL; Owner: WPW BROADCASTING, INC.)
TV broadcast stations around Peoria:
- W67CW (Channel 67; PEORIA, IL; Owner: M.C. PRODUCTIONS)
- WHOI (Channel 19; PEORIA, IL; Owner: CHELSEY BROADCASTING COMPANY OF PEORIA, LLC)
- WTVP (Channel 47; PEORIA, IL; Owner: ILLINOIS VALLEY PUB TELECOMM CORP)
- WEEK-TV (Channel 25; PEORIA, IL; Owner: WEEK-TV LICENSE, INC.)
- WAOE (Channel 59; PEORIA, IL; Owner: FOUR SEASONS PEORIA, LLC)
- WMBD-TV (Channel 31; PEORIA, IL; Owner: NEXSTAR BROADCASTING OF PEORIA, L.L.C.)
- WYZZ-TV (Channel 43; BLOOMINGTON, IL; Owner: WYZZ LICENSEE, INC.)
- W41BO (Channel 41; PEORIA, IL; Owner: TRINITY BROADCASTING NETWORK)
- National Bridge Inventory (NBI) Statistics
- 203Number of bridges
- 3,901ft / 1,189mTotal length
- $72,193,000Total costs
- 2,661,885Total average daily traffic
- 197,549Total average daily truck traffic
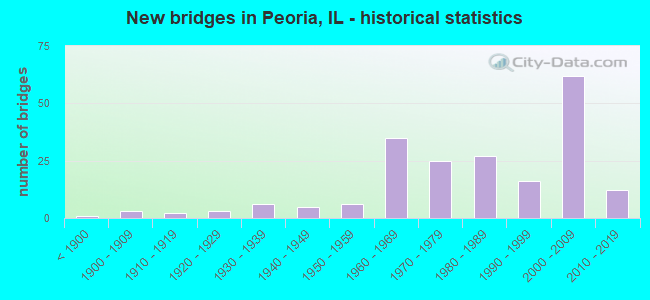
- New bridges - historical statistics
- 1Before 1900
- 31900-1909
- 21910-1919
- 31920-1929
- 61930-1939
- 51940-1949
- 61950-1959
- 351960-1969
- 251970-1979
- 271980-1989
- 161990-1999
- 622000-2009
- 122010-2019
FCC Registered Antenna Towers: 382 (See the full list of FCC Registered Antenna Towers)
FCC Registered Commercial Land Mobile Towers: 12 (See the full list of FCC Registered Commercial Land Mobile Towers in Peoria, IL)
FCC Registered Private Land Mobile Towers: 3 (See the full list of FCC Registered Private Land Mobile Towers)
FCC Registered Broadcast Land Mobile Towers: 105 (See the full list of FCC Registered Broadcast Land Mobile Towers)
FCC Registered Microwave Towers: 147 (See the full list of FCC Registered Microwave Towers in this town)
FCC Registered Paging Towers: 18 (See the full list of FCC Registered Paging Towers)
FCC Registered Maritime Coast & Aviation Ground Towers: 23 (See the full list of FCC Registered Maritime Coast & Aviation Ground Towers)
FCC Registered Amateur Radio Licenses: 459 (See the full list of FCC Registered Amateur Radio Licenses in Peoria)
FAA Registered Aircraft Manufacturers and Dealers: 2 (See the full list of FAA Registered Manufacturers and Dealers in Peoria)
FAA Registered Aircraft: 87 (See the full list of FAA Registered Aircraft)
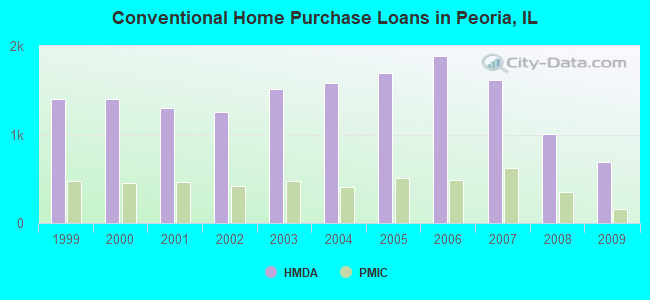
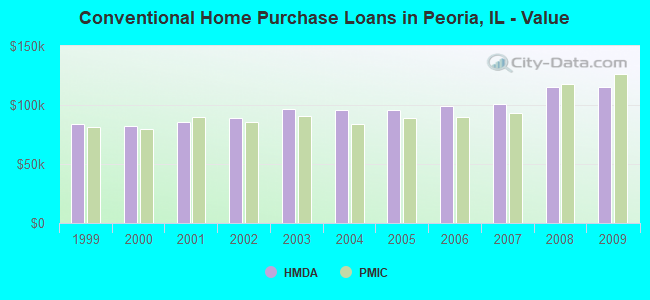
| Home Mortgage Disclosure Act Aggregated Statistics For Year 2009 (Based on 29 full and 3 partial tracts) | ||||||||||||||
| A) FHA, FSA/RHS & VA Home Purchase Loans | B) Conventional Home Purchase Loans | C) Refinancings | D) Home Improvement Loans | E) Loans on Dwellings For 5+ Families | F) Non-occupant Loans on < 5 Family Dwellings (A B C & D) | G) Loans On Manufactured Home Dwelling (A B C & D) | ||||||||
|---|---|---|---|---|---|---|---|---|---|---|---|---|---|---|
| Number | Average Value | Number | Average Value | Number | Average Value | Number | Average Value | Number | Average Value | Number | Average Value | Number | Average Value | |
| LOANS ORIGINATED | 420 | $101,839 | 688 | $114,959 | 2,069 | $126,876 | 115 | $40,239 | 17 | $428,097 | 286 | $70,568 | 1 | $92,930 |
| APPLICATIONS APPROVED, NOT ACCEPTED | 14 | $78,742 | 24 | $132,479 | 141 | $109,160 | 16 | $71,946 | 0 | $0 | 16 | $68,329 | 0 | $0 |
| APPLICATIONS DENIED | 32 | $87,356 | 59 | $92,629 | 476 | $101,989 | 124 | $27,690 | 2 | $800,000 | 43 | $72,148 | 1 | $6,330 |
| APPLICATIONS WITHDRAWN | 25 | $97,978 | 51 | $124,122 | 356 | $117,127 | 18 | $62,042 | 1 | $224,000 | 18 | $63,292 | 0 | $0 |
| FILES CLOSED FOR INCOMPLETENESS | 6 | $71,398 | 6 | $153,753 | 59 | $125,101 | 4 | $51,000 | 0 | $0 | 2 | $86,645 | 0 | $0 |
Detailed mortgage data for all 32 tracts in Peoria, IL
| Private Mortgage Insurance Companies Aggregated Statistics For Year 2009 (Based on 22 full and 3 partial tracts) | ||||||
| A) Conventional Home Purchase Loans | B) Refinancings | C) Non-occupant Loans on < 5 Family Dwellings (A & B) | ||||
|---|---|---|---|---|---|---|
| Number | Average Value | Number | Average Value | Number | Average Value | |
| LOANS ORIGINATED | 158 | $126,021 | 154 | $136,416 | 0 | $0 |
| APPLICATIONS APPROVED, NOT ACCEPTED | 27 | $129,890 | 27 | $142,036 | 1 | $151,000 |
| APPLICATIONS DENIED | 21 | $107,183 | 16 | $134,029 | 0 | $0 |
| APPLICATIONS WITHDRAWN | 4 | $89,030 | 10 | $164,735 | 0 | $0 |
| FILES CLOSED FOR INCOMPLETENESS | 1 | $45,000 | 0 | $0 | 1 | $45,000 |
2002 - 2018 National Fire Incident Reporting System (NFIRS) incidents
- Fire incident types reported to NFIRS in Peoria, IL
- 4,88850.7%Structure Fires
- 3,01531.3%Outside Fires
- 1,42814.8%Mobile Property/Vehicle Fires
- 3153.3%Other
 According to the data from the years 2002 - 2018 the average number of fires per year is 567. The highest number of reported fires - 790 took place in 2005, and the least - 55 in 2002. The data has an increasing trend.
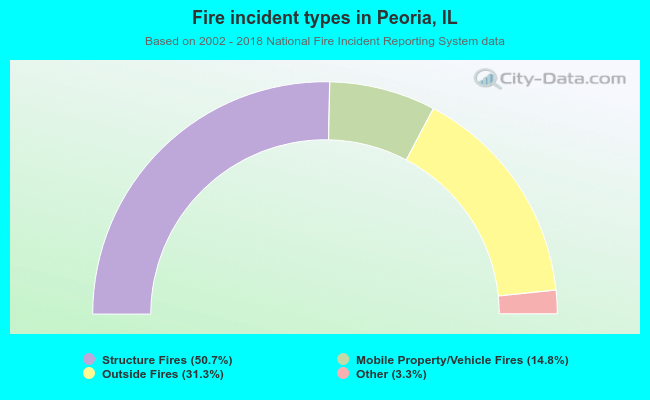 When looking into fire subcategories, the most incidents belonged to: Structure Fires (50.7%), and Outside Fires (31.3%).
Fire-safe hotels and motels in Peoria, Illinois:
- Peoria Marriott Pere Marquette, 501 Main St, Peoria, Illinois 61602 , Phone: (309) 637-6500, Fax: (309) 672-2744
- Manor Motor Lodge, 1500 N Knoxville, Peoria, Illinois 61603 , Phone: (309) 688-4194
- Quality Inn, 4112 N Brandywine, Peoria, Illinois 61614 , Phone: (309) 685-2556, Fax: (309) 685-2556
- Baymont Inn and Suites Peoria, 2002 W War Memorial Dr, Peoria, Illinois 61614 , Phone: (309) 686-7600, Fax: (309) 686-0686
- Sunshine Inn, 2726 W Lake, Peoria, Illinois 61615 , Phone: (309) 688-7000
- Red Roof Inn Peoria, 4031 N War Memorial Dr, Peoria, Illinois 61614 , Phone: (309) 685-3911, Fax: (309) 685-3941
- Ho Jo Inn Peoria, 202 Ne Washington St, Peoria, Illinois 61602 , Phone: (309) 676-8961
- Comfort Suites Peoria, 1812 W War Memorial Dr, Peoria, Illinois 61614 , Phone: (309) 688-3800
- 14 other hotels and motels
| Most common first names in Peoria, IL among deceased individuals | ||
| Name | Count | Lived (average) |
|---|---|---|
| John | 1,322 | 75.0 years |
| Mary | 1,238 | 79.4 years |
| William | 1,192 | 74.3 years |
| Robert | 984 | 71.4 years |
| James | 902 | 71.5 years |
| Charles | 767 | 74.8 years |
| George | 675 | 75.8 years |
| Helen | 561 | 80.0 years |
| Dorothy | 545 | 78.5 years |
| Margaret | 539 | 81.1 years |
| Most common last names in Peoria, IL among deceased individuals | ||
| Last name | Count | Lived (average) |
|---|---|---|
| Smith | 552 | 73.9 years |
| Johnson | 444 | 75.2 years |
| Miller | 354 | 76.9 years |
| Williams | 323 | 71.5 years |
| Brown | 295 | 72.5 years |
| Jones | 254 | 74.2 years |
| Davis | 233 | 75.9 years |
| Anderson | 228 | 78.1 years |
| White | 182 | 75.1 years |
| Thomas | 155 | 72.8 years |
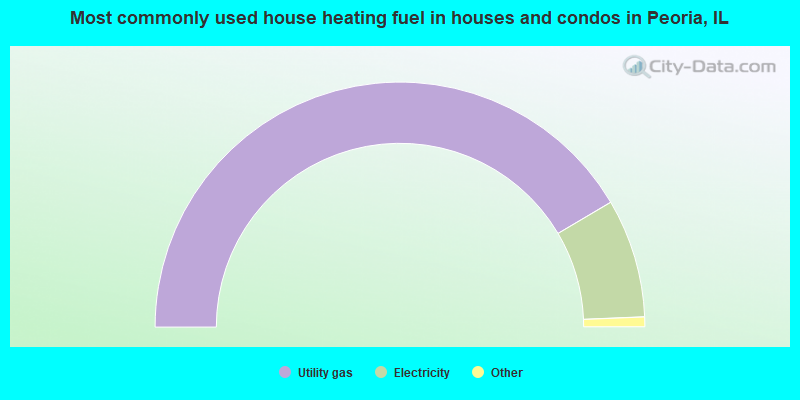
- 83.0%Utility gas
- 15.7%Electricity
- 0.8%Bottled, tank, or LP gas
- 0.4%No fuel used
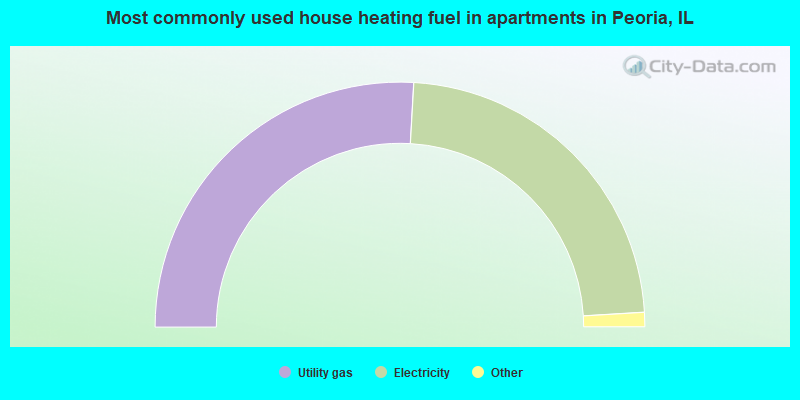
- 51.8%Utility gas
- 46.3%Electricity
- 0.9%No fuel used
- 0.5%Bottled, tank, or LP gas
- 0.3%Other fuel
- 0.1%Fuel oil, kerosene, etc.
Peoria compared to Illinois state average:
- Median house value below state average.
- Unemployed percentage below state average.
- Black race population percentage above state average.
- Hispanic race population percentage below state average.
- Median age below state average.
- Foreign-born population percentage below state average.
- Length of stay since moving in below state average.
- Percentage of population with a bachelor's degree or higher above state average.
Peoria on our top lists:
- #12 on the list of "Top 101 cities with largest percentage of females in industries: health care and social assistance (population 50,000+)"
- #20 on the list of "Top 101 cities with largest percentage of males in occupations: architecture and engineering occupations (population 50,000+)"
- #20 on the list of "Top 101 cities with the largest wind speed differences during a year (population 50,000+)"
- #21 on the list of "Top 101 cities with the largest percentage of people in military hospitals or wards for chronically ill (population 1,000+)"
- #23 on the list of "Top 101 cities with largest percentage of males in occupations: community and social service occupations (population 50,000+)"
- #34 on the list of "Top 101 cities with the largest racial income disparity between any two races with at least 2,000 householders"
- #55 on the list of "Top 101 cities with the largest temperature differences during a year (population 50,000+)"
- #58 on the list of "Top 101 cities with largest percentage of females in occupations: health technologists and technicians (population 50,000+)"
- #64 on the list of "Top 101 cities with largest percentage of males in industries: health care and social assistance (population 50,000+)"
- #65 on the list of "Top 101 cities with the most people born in the same U.S. state as the city (population 50,000+)"
- #69 on the list of "Top 101 cities with the highest number of arson incidents per 100,000 residents, excludes tourist destinations and others with a lot of outsiders visiting based on city industries data (population 50,000+)"
- #69 on the list of "Top 101 cities with the highest average snowfall in a year (population 50,000+)"
- #69 on the list of "Top 101 cities with largest percentage of males in industries: manufacturing (population 50,000+)"
- #72 on the list of "Top 101 cities with the largest percentage of elementary and middle school students in private schools (5,000+ students)"
- #78 on the list of "Top 101 cities with the coldest winters (population 50,000+)"
- #81 on the list of "Top 101 cities with the largest house values disparities (population 50,000+)"
- #86 on the list of "Top 101 cities with the highest average humidity (population 50,000+)"
- #88 on the list of "Top 101 cities with the most local government spending on current operations of parking facilities per resident (population 10,000+)"
- #91 on the list of "Top 101 cities with the lowest daily low temperatures (population 50,000+)"
- #97 on the list of "Top 101 cities with the highest number of robberies per 100,000 residents, excludes tourist destinations and others with a lot of outsiders visiting based on city industries data (population 50,000+)"
- #46 (61528) on the list of "Top 101 zip codes with the largest percentage of taxpayers reporting taxable interest in 2012 (pop 1,000+)"
- #22 on the list of "Top 101 counties with the lowest percentage of residents relocating from foreign countries between 2010 and 2011"
- #44 on the list of "Top 101 counties with the highest Sulfur Oxides Annual air pollution readings in 2012 (µg/m3)"
- #48 on the list of "Top 101 counties with the largest increase in the number of births per 1000 residents 2000-2006 to 2007-2013 (pop 50,000+)"
- #97 on the list of "Top 101 counties with the lowest percentage of residents relocating to foreign countries in 2011"

|
|
Total of 2176 patent applications in 2008-2024.