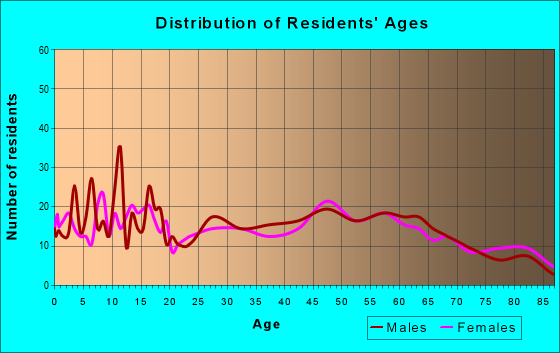
Estimated zip code population in 2022: 2,473 Zip code population in 2010: 2,544 Zip code population in 2000: 2,789
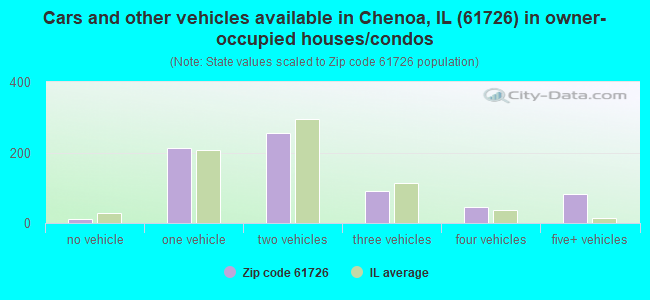
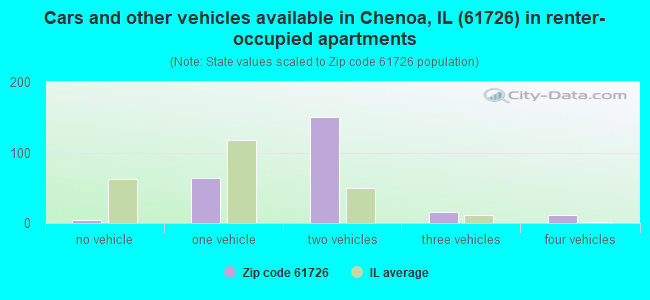
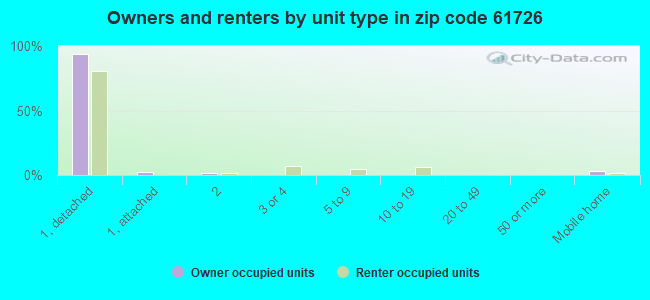
Houses and condos: 1,118 Renter-occupied apartments: 256
% of renters here:
27%
State:
33%
March 2022 cost of living index in zip code 61726: 84.3 (less than average, U.S. average is 100)
Land area: 91.4 sq. mi. Water area: 0.2 sq. mi.
Population density: 27 people per square mile
(very low).
OSM Map
General Map
Google Map
MSN Map
OSM Map
General Map
Google Map
MSN Map
OSM Map
General Map
Google Map
MSN Map
OSM Map
General Map
Google Map
MSN Map
Please wait while loading the map...
Real estate property taxes paid for housing units in 2022:
This zip code:
2.0% ($2,853)
Illinois:
2.0% ($4,912)
Median real estate property taxes paid for housing units with mortgages in 2022: $3,041 (2.0%) Median real estate property taxes paid for housing units with no mortgage in 2022: $2,639 (2.1%)
Business Search- 14 Million verified businesses
Males: 1,188
(48.1%)
Females: 1,284
(51.9%)
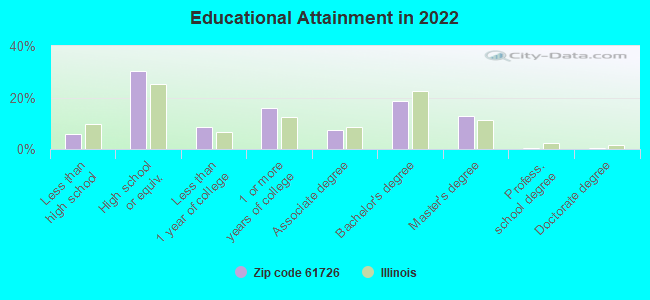
For population 25 years and over in 61726:
High school or higher: 93.7%
Bachelor's degree or higher: 32.0%
Graduate or professional degree: 13.4%
Unemployed: 4.1%
Mean travel time to work (commute): 20.4 minutes
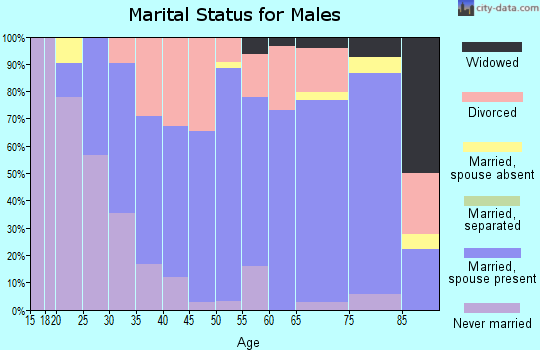
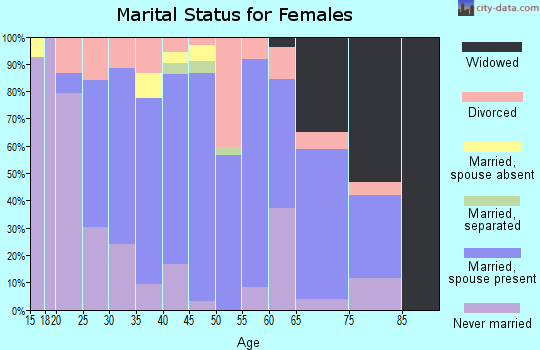
For population 15 years and over in 61726:
Never married: 27.4%
Now married: 61.2%
Separated: 0.7%
Widowed: 4.6%
Divorced: 6.2%
Zip code 61726 compared to state average:
Median house value below state average.
Black race population percentage significantly below state average.
Hispanic race population percentage significantly below state average.
Foreign-born population percentage significantly below state average.
Averages for the 2020 tax year for zip code 61726, filed in 2021:
Average Adjusted Gross Income (AGI) in 2020: $59,612 (Individual Income Tax Returns)
Here:
$59,612
State:
$82,626
Salary/wage: $46,046 (reported on 83.2% of returns)
Here:
$46,046
State:
$66,640
(% of AGI for various income ranges: 1156.1% for AGIs below $25k, 3393.3% for AGIs $25k-50k, 6046.9% for AGIs $50k-75k, 8150.0% for AGIs $75k-100k, 13436.4% for AGIs $100k-200k)
Taxable interest for individuals: $824 (reported on 38.7% of returns)
This zip code:
$824
Illinois:
$2,376
(% of AGI for various income ranges: 15.7% for AGIs below $25k, 18.5% for AGIs $25k-50k, 18.5% for AGIs $50k-75k, 72.5% for AGIs $75k-100k, 144.5% for AGIs $100k-200k)
Ordinary dividends: $3,124 (reported on 17.6% of returns)
Here:
$3,124
State:
$9,061
(% of AGI for various income ranges: 18.6% for AGIs below $25k, 20.4% for AGIs $25k-50k, 21.5% for AGIs $50k-75k, 97.5% for AGIs $75k-100k, 402.7% for AGIs $100k-200k)
Net capital gain/loss in AGI: +$5,524 (reported on 14.3% of returns)
Here:
+$5,524
State:
+$31,684
(% of AGI for various income ranges: 6.1% for AGIs below $25k, 37.0% for AGIs $25k-50k, 272.5% for AGIs $75k-100k, 549.1% for AGIs $100k-200k)
Profit/loss from business: +$7,231 (reported on 13.4% of returns)
Here:
+$7,231
State:
+$12,175
(% of AGI for various income ranges: 51.1% for AGIs below $25k, 85.6% for AGIs $25k-50k, 156.2% for AGIs $50k-75k, 236.2% for AGIs $75k-100k, 355.5% for AGIs $100k-200k)
Taxable individual retirement arrangement distribution: $12,658 (reported on 10.1% of returns)
61726:
$12,658
Illinois:
$21,613
(% of AGI for various income ranges: 47.9% for AGIs below $25k, 74.8% for AGIs $25k-50k, 336.2% for AGIs $50k-75k, 678.2% for AGIs $100k-200k)
Total itemized deductions: $35,275 (reported on 3.4% of returns)
Here:
$35,275
State:
$34,948
(% of AGI for various income ranges: 1763.8% for AGIs $75k-100k)
Charity contributions: $8,133 (reported on 2.5% of returns)
Here:
$8,133
State:
$13,122
(% of AGI for various income ranges: 305.0% for AGIs $75k-100k)
Taxes paid: $5,850 (reported on 3.4% of returns)
61726:
$5,850
State:
$8,563
(% of AGI for various income ranges: 292.5% for AGIs $75k-100k)
Earned income credit: $2,041 (reported on 14.3% of returns)
Here:
$2,041
State:
$2,311
(% of AGI for various income ranges: 77.1% for AGIs below $25k, 48.5% for AGIs $25k-50k)
Percentage of individuals using paid preparers for their 2020 taxes: 98.3%
Here:
98%
State:
93%
(% for various income ranges: 97.3% for AGIs below $25k, 97.0% for AGIs $25k-50k, 100.0% for AGIs $50k-75k, 100.0% for AGIs $75k-100k, 100.0% for AGIs $100k-200k, 100.0% for AGIs over 200k)
Averages for the 2012 tax year for zip code 61726, filed in 2013:
Average Adjusted Gross Income (AGI) in 2012: $53,452 (Individual Income Tax Returns)
Here:
$53,452
State:
$68,058
Salary/wage: $39,092 (reported on 82.9% of returns)
Here:
$39,092
State:
$55,396
(% of AGI for various income ranges: 70.2% for AGIs below $25k, 80.4% for AGIs $25k-50k, 70.1% for AGIs $50k-75k, 71.1% for AGIs $75k-100k, 57.0% for AGIs $100k-200k, 16.6% for AGIs over 200k)
Taxable interest for individuals: $1,074 (reported on 38.8% of returns)
This zip code:
$1,074
Illinois:
$1,969
(% of AGI for various income ranges: 1.4% for AGIs below $25k, 0.3% for AGIs $25k-50k, 0.7% for AGIs $50k-75k, 0.5% for AGIs $75k-100k, 1.0% for AGIs $100k-200k, 0.8% for AGIs over 200k)
Ordinary dividends: $2,312 (reported on 19.4% of returns)
Here:
$2,312
State:
$7,786
(% of AGI for various income ranges: 0.8% for AGIs below $25k, 0.3% for AGIs $25k-50k, 0.8% for AGIs $50k-75k, 0.5% for AGIs $75k-100k, 1.8% for AGIs $100k-200k)
Net capital gain/loss in AGI: +$3,538 (reported on 12.4% of returns)
Here:
+$3,538
State:
+$22,183
(% of AGI for various income ranges: 0.5% for AGIs $25k-50k, 0.5% for AGIs $50k-75k, 2.6% for AGIs $100k-200k)
Profit/loss from business: +$10,065 (reported on 13.2% of returns)
Here:
+$10,065
State:
+$12,903
(% of AGI for various income ranges: 3.6% for AGIs below $25k, 0.9% for AGIs $25k-50k, 2.8% for AGIs $50k-75k, 0.9% for AGIs $75k-100k, 4.9% for AGIs $100k-200k)
Taxable individual retirement arrangement distribution: $10,746 (reported on 10.1% of returns)
61726:
$10,746
Illinois:
$17,929
(% of AGI for various income ranges: 3.1% for AGIs below $25k, 2.2% for AGIs $25k-50k, 3.6% for AGIs $50k-75k, 2.7% for AGIs $100k-200k)
Self-employment retirement plans: $28,050 (reported on 1.6% of returns)
61726:
$28,050
Illinois:
$24,666
Total itemized deductions: $17,509 (19% of AGI, reported on 27.1% of returns)
Here:
$17,509
State:
$26,433
Here:
18.6% of AGI
State:
19.2% of AGI
(% of AGI for various income ranges: 8.1% for AGIs below $25k, 8.1% for AGIs $25k-50k, 9.3% for AGIs $50k-75k, 7.2% for AGIs $75k-100k, 11.2% for AGIs $100k-200k, 6.8% for AGIs over 200k)
Charity contributions: $3,171 (reported on 18.6% of returns)
Here:
$3,171
State:
$4,525
(% of AGI for various income ranges: 0.7% for AGIs $25k-50k, 0.6% for AGIs $50k-75k, 0.6% for AGIs $75k-100k, 2.1% for AGIs $100k-200k, 1.4% for AGIs over 200k)
Taxes paid: $7,485 (reported on 26.4% of returns)
61726:
$7,485
State:
$11,968
(% of AGI for various income ranges: 1.8% for AGIs below $25k, 2.4% for AGIs $25k-50k, 3.1% for AGIs $50k-75k, 3.1% for AGIs $75k-100k, 5.1% for AGIs $100k-200k, 4.9% for AGIs over 200k)
Earned income credit: $2,038 (reported on 16.3% of returns)
Here:
$2,038
State:
$2,349
(% of AGI for various income ranges: 5.1% for AGIs below $25k, 1.2% for AGIs $25k-50k)
Percentage of individuals using paid preparers for their 2012 taxes: 59.7%
Here:
60%
State:
57%
(% for various income ranges: 54.2% for AGIs below $25k, 53.3% for AGIs $25k-50k, 66.7% for AGIs $50k-75k, 66.7% for AGIs $75k-100k, 66.7% for AGIs $100k-200k, 100.0% for AGIs over 200k)
Averages for the 2004 tax year for zip code 61726, filed in 2005:
Average Adjusted Gross Income (AGI) in 2004: $40,366 (Individual Income Tax Returns)
Here:
$40,366
State:
$54,625
Salary/wage: $34,588 (reported on 85.4% of returns)
Here:
$34,588
State:
$46,811
(% of AGI for various income ranges: 116.6% for AGIs below $10k, 70.3% for AGIs $10k-25k, 79.0% for AGIs $25k-50k, 79.6% for AGIs $50k-75k, 76.5% for AGIs $75k-100k, 51.4% for AGIs over 100k)
Taxable interest for individuals: $1,473 (reported on 50.7% of returns)
This zip code:
$1,473
Illinois:
$2,101
(% of AGI for various income ranges: 7.0% for AGIs below $10k, 5.6% for AGIs $10k-25k, 1.7% for AGIs $25k-50k, 0.7% for AGIs $50k-75k, 1.3% for AGIs $75k-100k, 2.0% for AGIs over 100k)
Taxable dividends: $1,334 (reported on 23.2% of returns)
Here:
$1,334
State:
$4,306
(% of AGI for various income ranges: 2.2% for AGIs below $10k, 0.8% for AGIs $10k-25k, 0.6% for AGIs $25k-50k, 0.4% for AGIs $50k-75k, 0.4% for AGIs $75k-100k, 1.7% for AGIs over 100k)
Net capital gain/loss: +$2,577 (reported on 14.6% of returns)
Here:
+$2,577
State:
+$17,321
(% of AGI for various income ranges: 0.7% for AGIs below $10k, -0.5% for AGIs $10k-25k, 0.3% for AGIs $25k-50k, 0.2% for AGIs $50k-75k, 1.7% for AGIs $75k-100k, 2.5% for AGIs over 100k)
Profit/loss from business: +$11,353 (reported on 14.2% of returns)
Here:
+$11,353
State:
+$11,771
(% of AGI for various income ranges: 5.4% for AGIs below $10k, -0.1% for AGIs $10k-25k, 2.3% for AGIs $25k-50k, 1.8% for AGIs $50k-75k, 2.1% for AGIs $75k-100k, 12.9% for AGIs over 100k)
Profit/loss from farming: +$15,237 (reported on 6.9% of returns)
Here:
+$15,237
State:
+$2,327
(% of AGI for various income ranges: 1.8% for AGIs $10k-25k, 2.7% for AGIs $25k-50k, 3.1% for AGIs $50k-75k, 5.9% for AGIs $75k-100k, -1.2% for AGIs over 100k)
IRA payment deduction: $2,467 (reported on 2.2% of returns)
61726:
$2,467
Illinois:
$3,087
Self-employed pension: $13,650 (reported on 1.5% of returns)
Here:
$13,650
Illinois:
$16,965
Total itemized deductions: $14,667 (22% of AGI, reported on 26.7% of returns)
Here:
$14,667
State:
$20,239
Here:
22.0% of AGI
State:
19.5% of AGI
(% of AGI for various income ranges: 17.7% for AGIs below $10k, 11.7% for AGIs $10k-25k, 9.5% for AGIs $25k-50k, 8.2% for AGIs $50k-75k, 10.2% for AGIs $75k-100k, 9.6% for AGIs over 100k)
Charity contributions deductions: $2,427 (3% of AGI, reported on 19.9% of returns)
Here:
$2,427
State:
$3,719
Here:
3.4% of AGI
State:
3.4% of AGI
(% of AGI for various income ranges: 1.4% for AGIs $10k-25k, 0.9% for AGIs $25k-50k, 0.9% for AGIs $50k-75k, 1.4% for AGIs $75k-100k, 1.7% for AGIs over 100k)
Total tax: $5,473 (reported on 76.1% of returns)
61726:
$5,473
State:
$9,882
(% of AGI for various income ranges: 2.2% for AGIs below $10k, 3.9% for AGIs $10k-25k, 7.3% for AGIs $25k-50k, 9.5% for AGIs $50k-75k, 11.5% for AGIs $75k-100k, 17.7% for AGIs over 100k)
Earned income credit: $1,611 (reported on 11.1% of returns)
Here:
$1,611
State:
$1,788
Percentage of individuals using paid preparers for their 2004 taxes: 65.3%
Here:
65%
State:
61%
(% for various income ranges: 53.9% for AGIs below $10k, 64.0% for AGIs $10k-25k, 69.4% for AGIs $25k-50k, 64.8% for AGIs $50k-75k, 73.2% for AGIs $75k-100k, 79.2% for AGIs over 100k)
Likely homosexual households (counted as self-reported same-sex unmarried-partner households)
Lesbian couples: 0.0% of all households
Gay men: 0.4% of all households
Household received Food Stamps/SNAP in the past 12 months: 76 Household did not receive Food Stamps/SNAP in the past 12 months: 869
Women who had a birth in the past 12 months: 38 (33 now married, 4 unmarried) Women who did not have a birth in the past 12 months: 527 (286 now married, 237 unmarried)
Housing units in zip code 61726 with a mortgage: 440 (18 second mortgage, 13 both second mortgage and home equity loan) Houses without a mortgage: 8
Median monthly owner costs for units with a mortgage: $1,093 Median monthly owner costs for units without a mortgage: $494
Residents with income below the poverty level in 2022:
This zip code:
14.2%
Whole state:
11.9%
Residents with income below 50% of the poverty level in 2022:
This zip code:
2.2%
Whole state:
5.7%
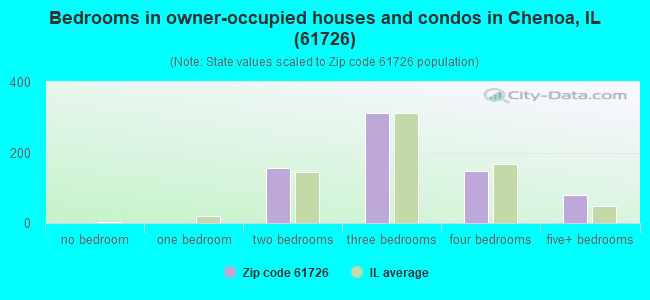
Median number of rooms in houses and condos:
Here:
7.4
State:
6.4
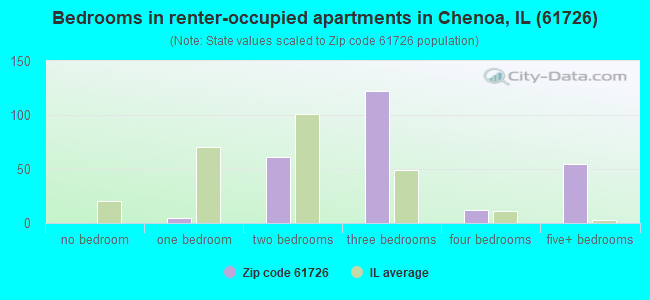
Median number of rooms in apartments:
Here:
5.7
State:
4.1
Notable locations in this zip code not listed on our city pages
Notable locations in zip code 61726: Ballard (A), Chenoa Fire Protection District (B), Chenoa City Hall (C), Chenoa Ambulance Service (D), Chenoa Public Library (E). Display/hide their locations on the map
Churches in zip code 61726 include: Chenoa Baptist Church (A), Presbyterian Church of Chenoa (B), Saint Josephs Catholic Church (C), Saint Pauls Evangelical Lutheran Church (D), Trinity Lutheran Church (E), Saint Pauls Church (F). Display/hide their locations on the map
Size of family households: 335 2-persons, 159 3-persons, 98 4-persons, 97 5-persons, 22 6-persons, 2 7-or-more-persons
Size of nonfamily households: 195 1-person, 32 2-persons, 3 5-persons
410 married couples with children.
155 single-parent households (12 men, 143 women).
97.6% of residents of 61726 zip code speak English at home.
0.9% of residents speak Spanish at home (100% very well).
0.5% of residents speak other Indo-European language at home (69% very well, 31% well).
0.2% of residents speak Asian or Pacific Island language at home (100% very well).
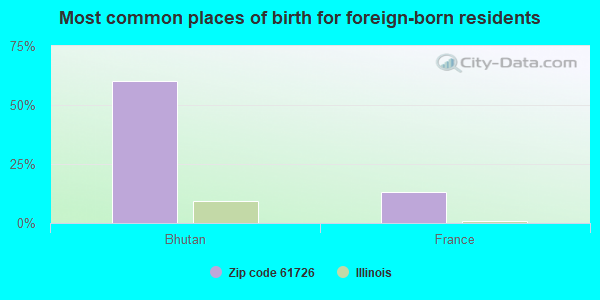
Foreign born population: 15 (0.6%) (100.0% of them are naturalized citizens)
This zip code:
0.6%
Whole state:
14.4%
60%Bhutan
13%France
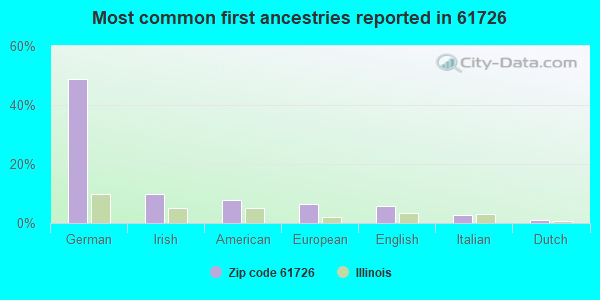
49%German
10%Irish
8%American
6%European
6%English
3%Italian
1%Dutch
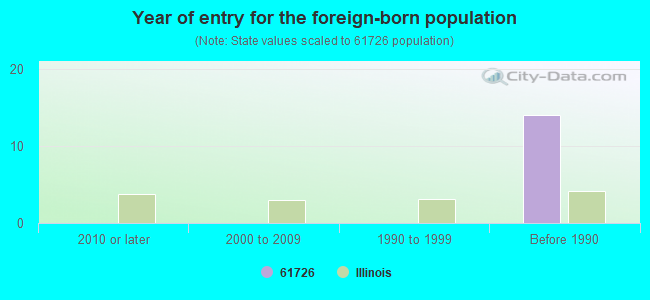
Year of entry for the foreign-born population
02010 or later
02000 to 2009
01990 to 1999
14Before 1990
Facilities with environmental interests located in this zip code:
PRAIRIE CENTRAL COOPERATIVE INC (33559 HAZEL STREET in WESTON, IL)
STATE MASTER (Illinois EPA Project) - AIR PROGRAM STATE MASTER (Illinois EPA Project) - SOLID WASTE PROGRAM AIR MINOR (AIRS/AFS) (Integrated Compliance Information System) - ICIS-05-1999-0576, FORMAL ENFORCEMENT ACTION, ICIS-05-1998-0771, CRITERIA AND HAZARDOUS AIR POLLUTANT INVENTORY (Inventory of air pollution sources) Business SIC classification: GRAIN AND FIELD BEANS; PETROLEUM BULK STATIONS AND TERMINALS
MEADOWS MENNONITE HOME (24588 CHURCH STREET in CHENOA, IL)
STATE MASTER (Illinois EPA Project) - DRINKING WATER PROGRAM STATE MASTER (Illinois EPA Project) - National Pollutant Discharge Elimination System Permit National Pollutant Discharge Elimination System NON-MAJOR (Tracking pollutant discharge elimination systems) - permit Business SIC classification: SKILLED NURSING CARE FACILITIES Alternative names: MEADOWS MENNONITE RETIREMENT, MEADOWS MENNONITE RETIREMENT C
MCLEAN COUNTY SERVICE CO (W SCOTT ST in CHENOA, IL)
STATE MASTER (Illinois EPA Project) - SOLID WASTE PROGRAM, AIR PROGRAM AIR MINOR (AIRS/AFS) ENFORCEMENT/COMPLIANCE ACTIVITY (Integrated Compliance Information System) (Resource Conservation and Recovery Act (tracking hazardous waste)) Business SIC classification: PETROLEUM BULK STATIONS AND TERMINALS Organizations: MCLEAN COUNTY SERVICE COMPANY (CONTACT/OWNER)
Alternative names: MCLEAN COUNTY SERVICE COMPANY CHENOA
CHENOA STP (R.R. #1 in CHENOA, IL)
STATE MASTER (Illinois EPA Project) - National Pollutant Discharge Elimination System Permit, National Pollutant Discharge Elimination System NON-MAJOR (Tracking pollutant discharge elimination systems) - permit National Pollutant Discharge Elimination System NON-MAJOR (Tracking pollutant discharge elimination systems) - permit Business SIC classification: SEWERAGE SYSTEMS Alternative names: CHENOA, CITY OF, CHENOA STP, CITY OF
MCLEAN COUNTY SERVICE CO (202 E LOCUST ST in CHENOA, IL)
STATE MASTER (Illinois EPA Project) - AIR PROGRAM AIR MINOR (AIRS/AFS) CRITERIA AND HAZARDOUS AIR POLLUTANT INVENTORY (Inventory of air pollution sources) Business SIC classification: FERTILIZERS, MIXING ONLY; NONCLASSIFIABLE ESTABLISHMENTS Alternative names: --------------------------------------------------
PRAIRIE CENTRAL COOPERATIVE INC (MAIN ST in MEADOWS, IL)
STATE MASTER (Illinois EPA Project) - AIR PROGRAM AIR MINOR (AIRS/AFS) CRITERIA AND HAZARDOUS AIR POLLUTANT INVENTORY (Inventory of air pollution sources) Business SIC classification: GRAIN AND FIELD BEANS
CHENOA MILLING CO INC (MILL ST in CHENOA, IL)
STATE MASTER (Illinois EPA Project) - AIR PROGRAM AIR MINOR (AIRS/AFS) Business SIC classification: NONCLASSIFIABLE ESTABLISHMENTS
CHENOA SANDBLASTING (101 1/2 N MOORHEAD ST in CHENOA, IL)
STATE MASTER (Illinois EPA Project) - AIR PROGRAM AIR MINOR (AIRS/AFS) Business SIC classification: NONCLASSIFIABLE ESTABLISHMENTS
CHENOA HIGH SCHOOL (700 S DIVISION ST in CHENOA, IL)
(Geographic Names Information System) (National Center for Education Statistics) - STATE ID-1706400900002 Organizations: CHENOA C U SCHOOL DISTRICT 9 (SCHOOL DISTRICT)
CHENOA ELEM SCHOOL (203 S SECOND AVE in CHENOA, IL)
(National Center for Education Statistics) - STATE ID-1706400902001 Organizations: CHENOA C U SCHOOL DISTRICT 9 (SCHOOL DISTRICT)
ILDOT BRG NO 057 0071 (US 24 OVER ROOKS CRREK in CHENOA, IL)
Large Quantity Generators, more that 1000 kg of hazardous waste/month (Resource Conservation and Recovery Act (tracking hazardous waste)) - notification
MYERS INCORPORATED WESTON PLANT (31340 N - 3260 E RD in CHENOA, IL)
ENFORCEMENT/COMPLIANCE ACTIVITY (Integrated Compliance Information System)
Housing units lacking complete plumbing facilities: 5.7% Housing units lacking complete kitchen facilities: 5.8%
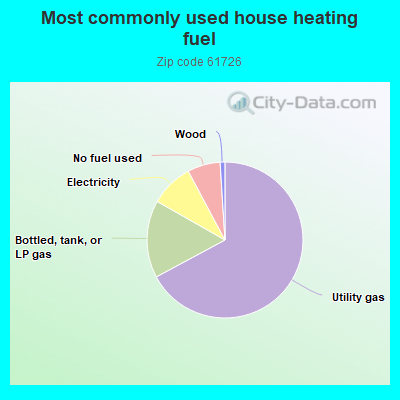
67.3%Utility gas
16.1%Bottled, tank, or LP gas
9.0%Electricity
6.8%No fuel used
1.0%Wood
Population in 1990: 2,898.
Place of birth for U.S.-born residents:
This state: 2,063
Northeast: 8
Midwest: 194
South: 144
West: 35
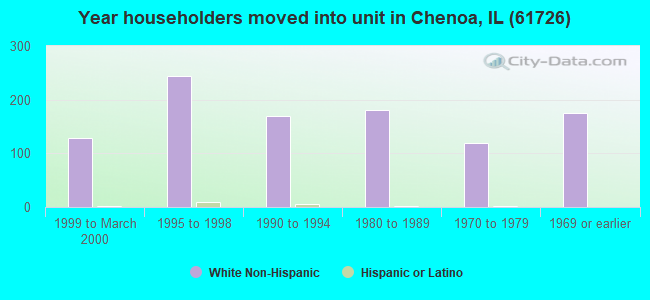
65% of the 61726 zip code residents lived in the same house 5 years ago. Out of people who lived in different houses, 54% lived in this county. Out of people who lived in different counties, 50% lived in Illinois.
93% of the 61726 zip code residents lived in the same house 1 year ago. Out of people who lived in different houses, 55% moved from this county. Out of people who lived in different houses, 38% moved from different county within same state. Out of people who lived in different houses, 7% moved from different state.
Private vs. public school enrollment:
Students in private schools in grades 1 to 8 (elementary and middle school): 7
Here:
2.8%
Illinois:
13.3%
Students in private schools in grades 9 to 12 (high school): 5
Here:
2.7%
Illinois:
9.9%
Students in private undergraduate colleges: 14
Here:
17.9%
Illinois:
27.4%
Occupation by median earnings in the past 12 months ($)
120,065Health diagnosing and treating practitioners and other technical occupations
98,153Management occupations
68,379Construction and extraction occupations
65,539Law enforcement workers including supervisors
58,701Business and financial operations occupations
56,148Computer and mathematical occupations
Top industries in this zip code by the number of employees in 2005:
Detailed PMIC statistics for the following Tracts:0057.00
2002 - 2018 National Fire Incident Reporting System (NFIRS) incidents
Based on the data from the years 2002 - 2018 the average number of fire incidents per year is 14. The highest number of fires - 34 took place in 2012, and the least - 0 in 2003. The data has a decreasing trend.
When looking into fire subcategories, the most incidents belonged to: Structure Fires (43.0%), and Outside Fires (36.7%).
Fire incident types reported to NFIRS in Zip Code 61726


 Nearest zip codes: 61753, 61764, 61743, 61739, 61728, 61744.


 Based on the data from the years 2002 - 2018 the average number of fire incidents per year is 14. The highest number of fires - 34 took place in 2012, and the least - 0 in 2003. The data has a decreasing trend.
 When looking into fire subcategories, the most incidents belonged to: Structure Fires (43.0%), and Outside Fires (36.7%).