Estimated zip code population in 2022: 4,601 Zip code population in 2010: 5,101 Zip code population in 2000: 5,163
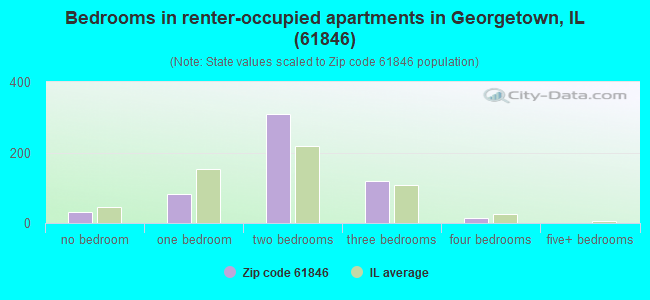
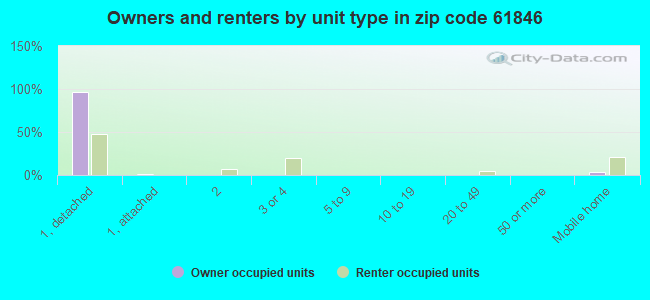
Houses and condos: 2,276 Renter-occupied apartments: 556
% of renters here:
27%
State:
33%
March 2022 cost of living index in zip code 61846: 80.5 (low, U.S. average is 100)
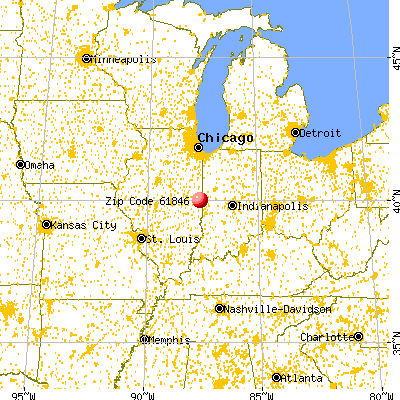
Land area: 43.7 sq. mi. Water area: 0.1 sq. mi.
Population density: 105 people per square mile
(very low).
OSM Map
General Map
Google Map
MSN Map
OSM Map
General Map
Google Map
MSN Map
OSM Map
General Map
Google Map
MSN Map
OSM Map
General Map
Google Map
MSN Map
Please wait while loading the map...
Real estate property taxes paid for housing units in 2022:
This zip code:
1.6% ($1,282)
Illinois:
2.0% ($4,912)
Median real estate property taxes paid for housing units with mortgages in 2022: $1,323 (1.6%) Median real estate property taxes paid for housing units with no mortgage in 2022: $1,242 (1.5%)
Business Search- 14 Million verified businesses
Males: 2,488
(54.1%)
Females: 2,113
(45.9%)
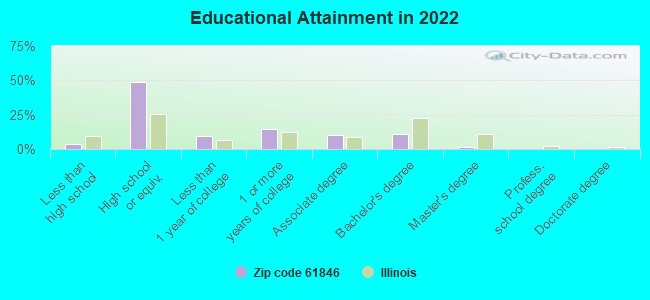
For population 25 years and over in 61846:
High school or higher: 95.5%
Bachelor's degree or higher: 13.4%
Graduate or professional degree: 2.3%
Unemployed: 3.5%
Mean travel time to work (commute): 28.8 minutes
For population 15 years and over in 61846:
Never married: 28.9%
Now married: 45.6%
Separated: 2.0%
Widowed: 5.0%
Divorced: 18.5%
Zip code 61846 compared to state average:
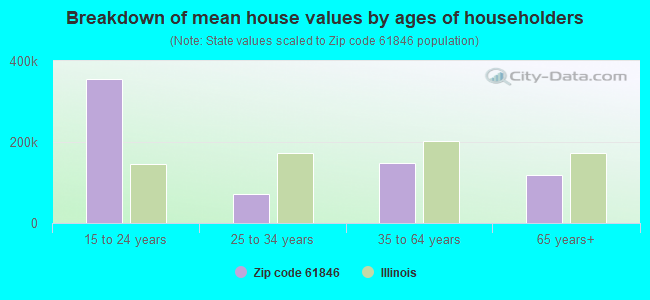
Median house value significantly below state average.
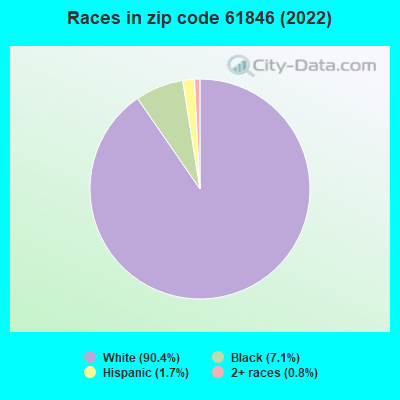
Black race population percentage below state average.
Hispanic race population percentage significantly below state average.
Foreign-born population percentage significantly below state average.
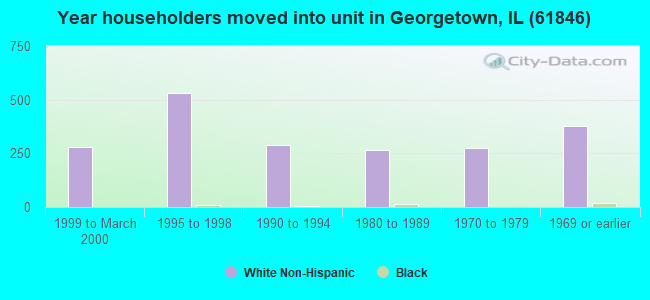
Length of stay since moving in significantly above state average.
Percentage of population with a bachelor's degree or higher significantly below state average.
Averages for the 2020 tax year for zip code 61846, filed in 2021:
Average Adjusted Gross Income (AGI) in 2020: $46,333 (Individual Income Tax Returns)
Here:
$46,333
State:
$82,626
Salary/wage: $40,787 (reported on 79.3% of returns)
Here:
$40,787
State:
$66,640
(% of AGI for various income ranges: 1026.6% for AGIs below $25k, 3154.1% for AGIs $25k-50k, 5453.8% for AGIs $50k-75k, 9265.0% for AGIs $75k-100k, 17520.9% for AGIs $100k-200k)
Taxable interest for individuals: $756 (reported on 27.4% of returns)
This zip code:
$756
Illinois:
$2,376
(% of AGI for various income ranges: 8.7% for AGIs below $25k, 7.0% for AGIs $25k-50k, 28.8% for AGIs $50k-75k, 52.9% for AGIs $75k-100k, 178.2% for AGIs $100k-200k)
Ordinary dividends: $2,426 (reported on 11.1% of returns)
Here:
$2,426
State:
$9,061
(% of AGI for various income ranges: 12.9% for AGIs below $25k, 16.3% for AGIs $25k-50k, 57.3% for AGIs $50k-75k, 70.0% for AGIs $75k-100k, 141.8% for AGIs $100k-200k)
Net capital gain/loss in AGI: +$3,167 (reported on 8.7% of returns)
Here:
+$3,167
State:
+$31,684
(% of AGI for various income ranges: 5.9% for AGIs $25k-50k, 20.0% for AGIs $50k-75k, 107.9% for AGIs $75k-100k, 310.0% for AGIs $100k-200k)
Profit/loss from business: +$8,091 (reported on 11.1% of returns)
Here:
+$8,091
State:
+$12,175
(% of AGI for various income ranges: 65.3% for AGIs below $25k, 96.7% for AGIs $25k-50k, 18.8% for AGIs $50k-75k, 253.6% for AGIs $75k-100k, 551.8% for AGIs $100k-200k)
Taxable individual retirement arrangement distribution: $13,535 (reported on 8.2% of returns)
61846:
$13,535
Illinois:
$21,613
(% of AGI for various income ranges: 39.2% for AGIs below $25k, 83.3% for AGIs $25k-50k, 278.5% for AGIs $50k-75k, 864.5% for AGIs $100k-200k)
Total itemized deductions: $30,500 (reported on 1.0% of returns)
Here:
$30,500
State:
$34,948
(% of AGI for various income ranges: 234.6% for AGIs $50k-75k)
Taxes paid: $6,000 (reported on 1.0% of returns)
61846:
$6,000
State:
$8,563
(% of AGI for various income ranges: 26.1% for AGIs $25k-50k)
Earned income credit: $2,265 (reported on 20.7% of returns)
Here:
$2,265
State:
$2,311
(% of AGI for various income ranges: 103.9% for AGIs below $25k, 71.7% for AGIs $25k-50k)
Percentage of individuals using paid preparers for their 2020 taxes: 96.2%
Here:
96%
State:
93%
(% for various income ranges: 96.2% for AGIs below $25k, 96.4% for AGIs $25k-50k, 97.1% for AGIs $50k-75k, 95.0% for AGIs $75k-100k, 94.4% for AGIs $100k-200k, 100.0% for AGIs over 200k)
Averages for the 2012 tax year for zip code 61846, filed in 2013:
Average Adjusted Gross Income (AGI) in 2012: $40,291 (Individual Income Tax Returns)
Here:
$40,291
State:
$68,058
Salary/wage: $34,868 (reported on 84.1% of returns)
Here:
$34,868
State:
$55,396
(% of AGI for various income ranges: 71.4% for AGIs below $25k, 78.8% for AGIs $25k-50k, 76.1% for AGIs $50k-75k, 73.5% for AGIs $75k-100k, 63.5% for AGIs $100k-200k)
Taxable interest for individuals: $716 (reported on 27.7% of returns)
This zip code:
$716
Illinois:
$1,969
(% of AGI for various income ranges: 0.9% for AGIs below $25k, 0.2% for AGIs $25k-50k, 0.6% for AGIs $50k-75k, 0.3% for AGIs $75k-100k, 0.5% for AGIs $100k-200k)
Ordinary dividends: $1,932 (reported on 12.7% of returns)
Here:
$1,932
State:
$7,786
(% of AGI for various income ranges: 0.7% for AGIs below $25k, 0.4% for AGIs $25k-50k, 0.5% for AGIs $50k-75k, 0.2% for AGIs $75k-100k, 1.2% for AGIs $100k-200k)
Net capital gain/loss in AGI: +$650 (reported on 8.2% of returns)
Here:
+$650
State:
+$22,183
(% of AGI for various income ranges: 0.2% for AGIs $25k-50k, 0.6% for AGIs $75k-100k)
Profit/loss from business: +$5,904 (reported on 12.3% of returns)
Here:
+$5,904
State:
+$12,903
(% of AGI for various income ranges: 5.5% for AGIs below $25k, 1.1% for AGIs $25k-50k, 1.7% for AGIs $50k-75k, 1.9% for AGIs $75k-100k, 0.5% for AGIs $100k-200k)
Taxable individual retirement arrangement distribution: $10,779 (reported on 8.6% of returns)
61846:
$10,779
Illinois:
$17,929
(% of AGI for various income ranges: 2.4% for AGIs below $25k, 2.2% for AGIs $25k-50k, 1.8% for AGIs $50k-75k, 1.6% for AGIs $75k-100k, 3.4% for AGIs $100k-200k)
Total itemized deductions: $16,333 (21% of AGI, reported on 15.0% of returns)
Here:
$16,333
State:
$26,433
Here:
20.9% of AGI
State:
19.2% of AGI
(% of AGI for various income ranges: 4.2% for AGIs below $25k, 3.4% for AGIs $25k-50k, 6.3% for AGIs $50k-75k, 7.0% for AGIs $75k-100k, 8.8% for AGIs $100k-200k)
Charity contributions: $3,263 (reported on 8.6% of returns)
Here:
$3,263
State:
$4,525
(% of AGI for various income ranges: 0.5% for AGIs $25k-50k, 0.7% for AGIs $50k-75k, 0.8% for AGIs $75k-100k, 1.2% for AGIs $100k-200k)
Taxes paid: $5,575 (reported on 14.5% of returns)
61846:
$5,575
State:
$11,968
(% of AGI for various income ranges: 0.3% for AGIs below $25k, 0.8% for AGIs $25k-50k, 1.9% for AGIs $50k-75k, 2.7% for AGIs $75k-100k, 3.8% for AGIs $100k-200k)
Earned income credit: $2,323 (reported on 24.1% of returns)
Here:
$2,323
State:
$2,349
(% of AGI for various income ranges: 8.6% for AGIs below $25k, 1.3% for AGIs $25k-50k)
Percentage of individuals using paid preparers for their 2012 taxes: 65.0%
Here:
65%
State:
57%
(% for various income ranges: 60.0% for AGIs below $25k, 63.2% for AGIs $25k-50k, 72.2% for AGIs $50k-75k, 70.6% for AGIs $75k-100k, 80.0% for AGIs $100k-200k)
Averages for the 2004 tax year for zip code 61846, filed in 2005:
Average Adjusted Gross Income (AGI) in 2004: $33,576 (Individual Income Tax Returns)
Here:
$33,576
State:
$54,625
Salary/wage: $30,618 (reported on 85.8% of returns)
Here:
$30,618
State:
$46,811
(% of AGI for various income ranges: 81.0% for AGIs below $10k, 69.8% for AGIs $10k-25k, 83.0% for AGIs $25k-50k, 82.8% for AGIs $50k-75k, 84.7% for AGIs $75k-100k, 53.0% for AGIs over 100k)
Taxable interest for individuals: $1,066 (reported on 41.0% of returns)
This zip code:
$1,066
Illinois:
$2,101
(% of AGI for various income ranges: 3.3% for AGIs below $10k, 2.7% for AGIs $10k-25k, 1.2% for AGIs $25k-50k, 0.7% for AGIs $50k-75k, 0.5% for AGIs $75k-100k, 1.7% for AGIs over 100k)
Taxable dividends: $1,013 (reported on 17.4% of returns)
Here:
$1,013
State:
$4,306
(% of AGI for various income ranges: 1.3% for AGIs below $10k, 0.7% for AGIs $10k-25k, 0.3% for AGIs $25k-50k, 0.5% for AGIs $50k-75k, 0.2% for AGIs $75k-100k, 1.2% for AGIs over 100k)
Net capital gain/loss: +$2,709 (reported on 10.5% of returns)
Here:
+$2,709
State:
+$17,321
(% of AGI for various income ranges: -1.1% for AGIs below $10k, 0.1% for AGIs $10k-25k, 0.2% for AGIs $25k-50k, 0.0% for AGIs $50k-75k, 2.0% for AGIs $75k-100k, 4.9% for AGIs over 100k)
Profit/loss from business: +$3,877 (reported on 11.7% of returns)
Here:
+$3,877
State:
+$11,771
(% of AGI for various income ranges: 4.1% for AGIs below $10k, 1.7% for AGIs $10k-25k, 1.3% for AGIs $25k-50k, 2.0% for AGIs $50k-75k, 0.1% for AGIs $75k-100k, 0.2% for AGIs over 100k)
Profit/loss from farming: +$667 (reported on 1.9% of returns)
Here:
+$667
State:
+$2,327
IRA payment deduction: $2,128 (reported on 1.8% of returns)
61846:
$2,128
Illinois:
$3,087
Total itemized deductions: $12,733 (21% of AGI, reported on 12.6% of returns)
Here:
$12,733
State:
$20,239
Here:
20.6% of AGI
State:
19.5% of AGI
(% of AGI for various income ranges: 3.1% for AGIs $10k-25k, 4.7% for AGIs $25k-50k, 5.0% for AGIs $50k-75k, 6.4% for AGIs $75k-100k, 5.9% for AGIs over 100k)
Charity contributions deductions: $2,181 (3% of AGI, reported on 10.0% of returns)
Here:
$2,181
State:
$3,719
Here:
3.3% of AGI
State:
3.4% of AGI
(% of AGI for various income ranges: 0.1% for AGIs $10k-25k, 0.4% for AGIs $25k-50k, 0.8% for AGIs $50k-75k, 1.0% for AGIs $75k-100k, 1.3% for AGIs over 100k)
Total tax: $3,880 (reported on 72.9% of returns)
61846:
$3,880
State:
$9,882
(% of AGI for various income ranges: 1.6% for AGIs below $10k, 3.6% for AGIs $10k-25k, 6.5% for AGIs $25k-50k, 9.0% for AGIs $50k-75k, 11.2% for AGIs $75k-100k, 17.2% for AGIs over 100k)
Earned income credit: $1,608 (reported on 20.3% of returns)
Here:
$1,608
State:
$1,788
Percentage of individuals using paid preparers for their 2004 taxes: 69.4%
Here:
69%
State:
61%
(% for various income ranges: 64.1% for AGIs below $10k, 69.3% for AGIs $10k-25k, 71.0% for AGIs $25k-50k, 71.7% for AGIs $50k-75k, 71.5% for AGIs $75k-100k, 78.9% for AGIs over 100k)
Likely homosexual households (counted as self-reported same-sex unmarried-partner households)
Lesbian couples: 0.4% of all households
Gay men: 0.0% of all households
Household received Food Stamps/SNAP in the past 12 months: 220 Household did not receive Food Stamps/SNAP in the past 12 months: 1,834
Women who had a birth in the past 12 months: 22 (0 now married, 22 unmarried) Women who did not have a birth in the past 12 months: 746 (252 now married, 495 unmarried)
Housing units in zip code 61846 with a mortgage: 604 (16 second mortgage, 10 both second mortgage and home equity loan) Houses without a mortgage: 24
Median monthly owner costs for units with a mortgage: $1,001 Median monthly owner costs for units without a mortgage: $450
Residents with income below the poverty level in 2022:
This zip code:
11.4%
Whole state:
11.9%
Residents with income below 50% of the poverty level in 2022:
This zip code:
6.7%
Whole state:
5.7%
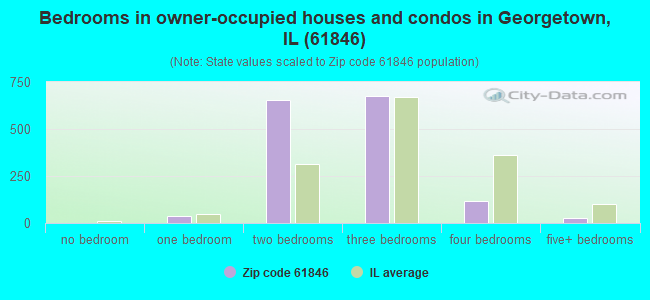
Median number of rooms in houses and condos:
Here:
5.9
State:
6.4
Median number of rooms in apartments:
Here:
4.5
State:
4.1
Notable locations in this zip code not listed on our city pages
Notable locations in zip code 61846: Cherokee Hills Camp (A), Camp Assurance (B), Georgetown Fire Protection District (C), Georgetown Ambulance Service (D), Georgetown Public Library (E), Georgetown Village Hall (F). Display/hide their locations on the map
Churches in zip code 61846 include: Pleasant Mound Church of Christ (A), Bethel Baptist Church (B), First Baptist Church (C), First Church of Christ (D), Georgetown Church of the Nazarene (E), Georgetown Friends Church (F), Georgetown United Methodist Church (G), Holiness Mission Church (H), Saint James Christian Methodist Episcopal Church (I). Display/hide their locations on the map
Cemeteries: Whitlock Cemetery (1), Bock Cemetery (2), McKendree Cemetery (3), Pleasant Mount Cemetery (4), Elwood Church Cemetery (5), Sharon Cemetery (6), Forest Park Cemetery (7). Display/hide their locations on the map
Parks in zip code 61846 include: Doris Westfall Prairie Restoration Nature Preserve (1), Forest Glen Seep Nature Preserve (2), Howards Hollow Seep Nature Preserve (3), Russell M Duffin Nature Preserve (4), Forest Glen Preserve (5), Public Square (6). Display/hide their locations on the map
In group quarters: 5 (-1 institutionalized population)
Size of family households: 714 2-persons, 149 3-persons, 366 4-persons, 29 5-persons, 31 6-persons
Size of nonfamily households: 630 1-person, 137 2-persons, 16 4-persons
434 married couples with children.
301 single-parent households (145 men, 156 women).
99.4% of residents of 61846 zip code speak English at home.
0.2% of residents speak Spanish at home (100% very well).
0.2% of residents speak other Indo-European language at home (100% very well).
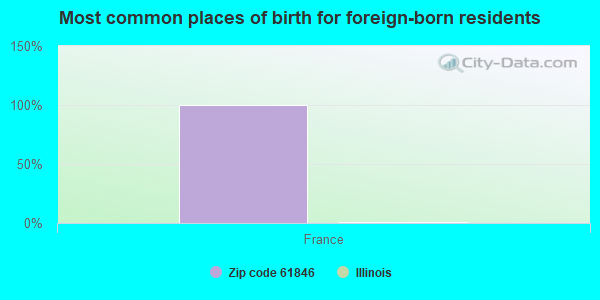
Foreign born population: 3 (0.1%) (100.0% of them are naturalized citizens)
This zip code:
0.1%
Whole state:
14.4%
100%France
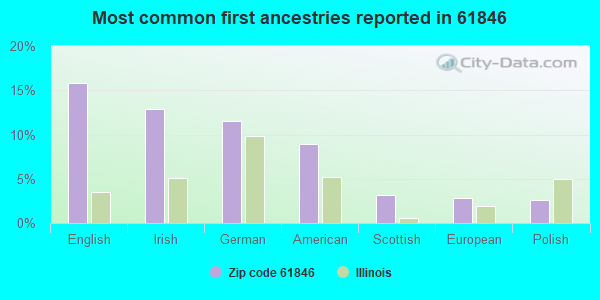
16%English
13%Irish
11%German
9%American
3%Scottish
3%European
3%Polish
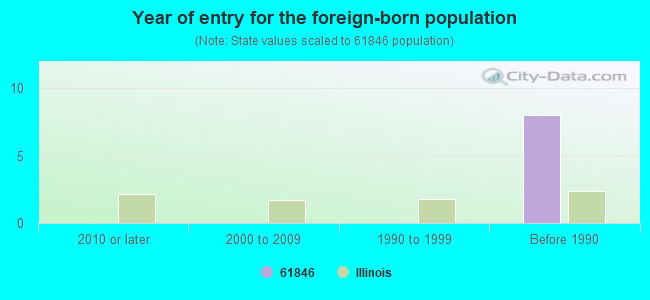
Year of entry for the foreign-born population
02010 or later
02000 to 2009
01990 to 1999
8Before 1990
Facilities with environmental interests located in this zip code:
ICM GRAIN CO (609 W W ST in GEORGETOWN, IL)
STATE MASTER (Illinois EPA Project) - AIR PROGRAM AIR MINOR (AIRS/AFS) Business SIC classification: GRAIN AND FIELD BEANS
ILLINI FS INC (WEST W ST AND MORGAN AVE in GEORGETOWN, IL)
STATE MASTER (Illinois EPA Project) - AIR PROGRAM AIR MINOR (AIRS/AFS) CRITERIA AND HAZARDOUS AIR POLLUTANT INVENTORY (Inventory of air pollution sources) Business SIC classification: PETROLEUM BULK STATIONS AND TERMINALS
RIOLA MINE - VERMILION GROVE PORTAL (STATE HWY 1 in GEORGETOWN, IL)
STATE MASTER (Illinois EPA Project) - AIR PROGRAM AIR MINOR (AIRS/AFS) CRITERIA AND HAZARDOUS AIR POLLUTANT INVENTORY (Inventory of air pollution sources) Business SIC classification: BITUMINOUS COAL UNDERGROUND MINING Alternative names: VERMILION GROVE MINE
NOGGLE OIL CO (MORGAN ST in GEORGETOWN, IL)
STATE MASTER (Illinois EPA Project) - AIR PROGRAM AIR MINOR (AIRS/AFS) Business SIC classification: PETROLEUM BULK STATIONS AND TERMINALS
RUSTY BERRY (106 E 11TH ST in GEORGETOWN, IL)
STATE MASTER (Illinois EPA Project) - AIR PROGRAM AIR MINOR (AIRS/AFS) Business SIC classification: NONCLASSIFIABLE ESTABLISHMENTS
MARY MILLER JUNIOR HIGH SCHOOL (414 W WEST ST in GEORGETOWN, IL)
(Geographic Names Information System) (National Center for Education Statistics) - STATE ID-5409200401003 Organizations: GEORGETOWN-RIDGE FARM C U D 4 (SCHOOL DISTRICT)
PINE CREST ELEMENTARY SCHOOL (505 KENNEDY DR in GEORGETOWN, IL)
(Geographic Names Information System) (National Center for Education Statistics) - STATE ID-5409200402002 Organizations: GEORGETOWN-RIDGE FARM C U D 4 (SCHOOL DISTRICT)
ALLISON TRUCKING, INC. (750 NORTH, 1250 EAST in GEORGETOWN, IL)
National Pollutant Discharge Elimination System NON-MAJOR (Tracking pollutant discharge elimination systems) - permit
AMOCO PIPELINE CO. N DIV - HUMRICK STAT. (RURAL in GEORGETOWN, IL)
AIR MINOR (AIRS/AFS) CRITERIA AND HAZARDOUS AIR POLLUTANT INVENTORY (Inventory of air pollution sources) Business SIC classification: REFINED PETROLEUM PIPELINES
HESS TRUCKING (203 EAST WEST STREET in GEORGETOWN, IL)
National Pollutant Discharge Elimination System NON-MAJOR (Tracking pollutant discharge elimination systems) - permit
ALPHEN LLC (PO BOX 19 in GEORGETOWN, IL)
COMPLIANCE ACTIVITY (Tracking inspections of insecticide, fungicide, and rodenticide, and toxic substances)
Housing units lacking complete plumbing facilities: 0.8% Housing units lacking complete kitchen facilities: 2.5%
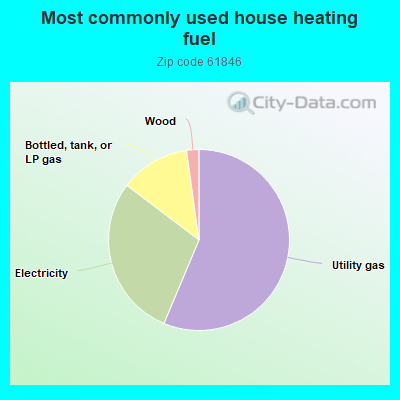
56.4%Utility gas
29.0%Electricity
12.5%Bottled, tank, or LP gas
2.2%Wood
Population in 1990: 4,534. Population change in the 1990s: +629 (+13.9%).
Place of birth for U.S.-born residents:
This state: 3,818
Northeast: 135
Midwest: 312
South: 176
West: 132
63% of the 61846 zip code residents lived in the same house 5 years ago. Out of people who lived in different houses, 72% lived in this county. Out of people who lived in different counties, 50% lived in Illinois.
93% of the 61846 zip code residents lived in the same house 1 year ago. Out of people who lived in different houses, 75% moved from this county. Out of people who lived in different houses, 1% moved from different county within same state. Out of people who lived in different houses, 21% moved from different state.
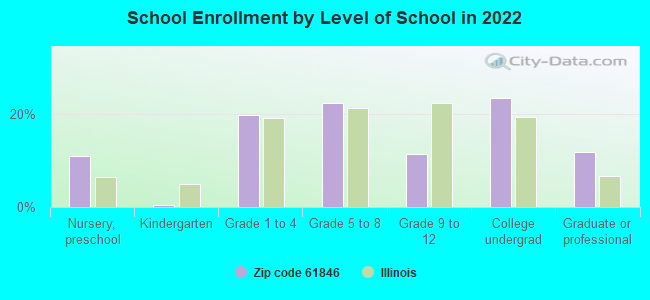
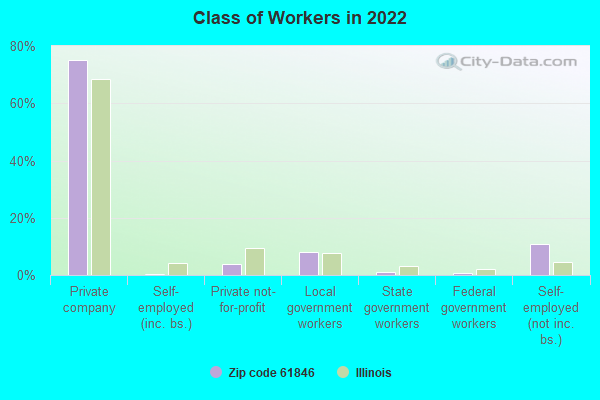
Private vs. public school enrollment:
Students in private schools in grades 1 to 8 (elementary and middle school): 147
Here:
36.9%
Illinois:
13.3%
Students in private schools in grades 9 to 12 (high school): 23
Here:
22.6%
Illinois:
9.9%
Students in private undergraduate colleges:
Here:
0.4%
Illinois:
27.4%
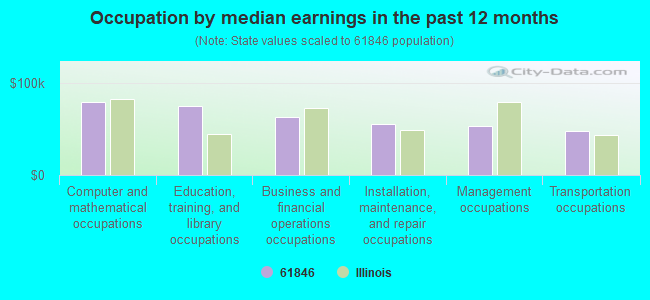
Occupation by median earnings in the past 12 months ($)
78,555Computer and mathematical occupations
74,286Education, training, and library occupations
62,324Business and financial operations occupations
55,344Installation, maintenance, and repair occupations
52,548Management occupations
47,793Transportation occupations
Top industries in this zip code by the number of employees in 2005:
Administrative and Support and Waste Management and Remediation Services: All Other Support Services (20-49 employees: 1 establishment)
Accommodation and Food Services: Limited-Service Restaurants (10-19: 2, 1-4: 1)
Construction: New Single-Family Housing Construction (except Operative Builders) (10-19: 1, 5-9: 1, 1-4: 1)
Finance and Insurance: Commercial Banking (10-19: 1, 5-9: 1)
Professional, Scientific, and Technical Services: Tax Preparation Services (10-19: 1)
Construction: Plumbing, Heating, and Air-Conditioning Contractors (5-9: 1, 1-4: 2)
People in group quarters in 2010:
68 people in workers' group living quarters and job corps centers
Fatal accident statistics in 2011:
Fatal accident count: 1
Vehicles involved in fatal accidents: 2
Fatal accidents caused by drunken drivers: 0
Fatalities: 1
Persons involved in fatal accidents: 7
Pedestrians involved in fatal accidents: 0
Home Mortgage Disclosure Act Aggregated Statistics For Year 2009 (Based on 4 partial tracts)
A) FHA, FSA/RHS & VA Home Purchase Loans
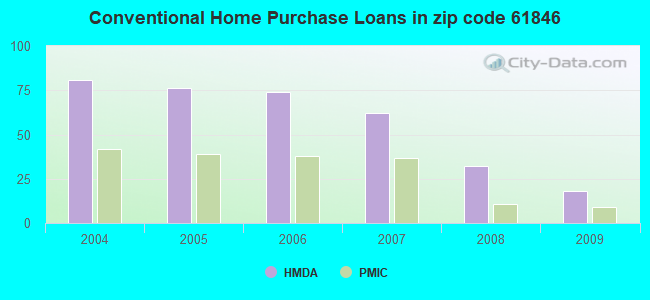
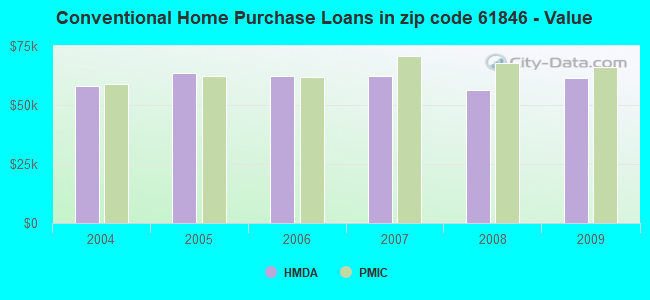
B) Conventional Home Purchase Loans
C) Refinancings
D) Home Improvement Loans
F) Non-occupant Loans on < 5 Family Dwellings (A B C & D)
G) Loans On Manufactured Home Dwelling (A B C & D)
Number
Average Value
Number
Average Value
Number
Average Value
Number
Average Value
Number
Average Value
Number
Average Value
LOANS ORIGINATED
24
$68,120
18
$61,323
102
$70,708
10
$29,435
19
$30,825
10
$77,697
APPLICATIONS APPROVED, NOT ACCEPTED
0
$0
3
$59,157
2
$58,175
0
$0
1
$18,130
0
$0
APPLICATIONS DENIED
6
$64,112
5
$46,764
45
$85,259
6
$12,960
3
$35,450
2
$135,245
APPLICATIONS WITHDRAWN
4
$73,492
5
$33,424
27
$65,405
2
$55,970
2
$30,745
2
$29,165
FILES CLOSED FOR INCOMPLETENESS
0
$0
0
$0
4
$71,890
1
$92,030
0
$0
0
$0
Aggregated Statistics For Year 2008 (Based on 4 partial tracts)
A) FHA, FSA/RHS & VA Home Purchase Loans
B) Conventional Home Purchase Loans
C) Refinancings
D) Home Improvement Loans
E) Loans on Dwellings For 5+ Families
F) Non-occupant Loans on < 5 Family Dwellings (A B C & D)
G) Loans On Manufactured Home Dwelling (A B C & D)
Number
Average Value
Number
Average Value
Number
Average Value
Number
Average Value
Number
Average Value
Number
Average Value
Number
Average Value
LOANS ORIGINATED
25
$57,856
32
$56,505
80
$58,178
19
$28,211
2
$299,555
37
$41,939
8
$40,834
APPLICATIONS APPROVED, NOT ACCEPTED
2
$54,395
0
$0
9
$108,956
1
$5,580
0
$0
0
$0
0
$0
APPLICATIONS DENIED
12
$57,131
7
$56,027
71
$77,566
21
$45,704
2
$315,320
2
$78,060
6
$73,360
APPLICATIONS WITHDRAWN
0
$0
0
$0
18
$69,666
4
$37,095
0
$0
0
$0
0
$0
FILES CLOSED FOR INCOMPLETENESS
2
$78,040
2
$34,685
2
$31,530
0
$0
0
$0
0
$0
0
$0
Aggregated Statistics For Year 2007 (Based on 4 partial tracts)
A) FHA, FSA/RHS & VA Home Purchase Loans
B) Conventional Home Purchase Loans
C) Refinancings
D) Home Improvement Loans
F) Non-occupant Loans on < 5 Family Dwellings (A B C & D)
G) Loans On Manufactured Home Dwelling (A B C & D)
Number
Average Value
Number
Average Value
Number
Average Value
Number
Average Value
Number
Average Value
Number
Average Value
LOANS ORIGINATED
23
$75,454
62
$62,315
80
$58,410
25
$30,212
20
$34,748
7
$97,170
APPLICATIONS APPROVED, NOT ACCEPTED
0
$0
11
$55,467
15
$58,505
9
$30,752
5
$23,650
0
$0
APPLICATIONS DENIED
8
$67,354
20
$63,829
81
$68,011
45
$43,281
3
$29,430
3
$63,200
APPLICATIONS WITHDRAWN
2
$29,955
1
$160,360
29
$70,455
2
$64,805
0
$0
0
$0
FILES CLOSED FOR INCOMPLETENESS
1
$41,130
1
$82,270
8
$64,919
0
$0
0
$0
0
$0
Aggregated Statistics For Year 2006 (Based on 4 partial tracts)
A) FHA, FSA/RHS & VA Home Purchase Loans
B) Conventional Home Purchase Loans
C) Refinancings
D) Home Improvement Loans
E) Loans on Dwellings For 5+ Families
F) Non-occupant Loans on < 5 Family Dwellings (A B C & D)
G) Loans On Manufactured Home Dwelling (A B C & D)
Number
Average Value
Number
Average Value
Number
Average Value
Number
Average Value
Number
Average Value
Number
Average Value
Number
Average Value
LOANS ORIGINATED
28
$56,090
74
$62,387
89
$60,092
29
$21,447
0
$0
27
$36,832
8
$51,782
APPLICATIONS APPROVED, NOT ACCEPTED
0
$0
6
$46,510
18
$57,040
3
$32,003
0
$0
2
$22,860
2
$47,300
APPLICATIONS DENIED
0
$0
17
$50,961
73
$59,459
34
$41,140
0
$0
9
$38,403
6
$55,258
APPLICATIONS WITHDRAWN
1
$108,070
11
$43,404
27
$62,039
2
$40,245
2
$197,075
3
$17,483
0
$0
FILES CLOSED FOR INCOMPLETENESS
0
$0
5
$64,112
17
$101,147
0
$0
0
$0
4
$85,740
0
$0
Aggregated Statistics For Year 2005 (Based on 4 partial tracts)
A) FHA, FSA/RHS & VA Home Purchase Loans
B) Conventional Home Purchase Loans
C) Refinancings
D) Home Improvement Loans
E) Loans on Dwellings For 5+ Families
F) Non-occupant Loans on < 5 Family Dwellings (A B C & D)
G) Loans On Manufactured Home Dwelling (A B C & D)
Number
Average Value
Number
Average Value
Number
Average Value
Number
Average Value
Number
Average Value
Number
Average Value
Number
Average Value
LOANS ORIGINATED
27
$61,213
76
$63,439
87
$59,790
26
$32,702
1
$184,760
26
$39,095
7
$60,547
APPLICATIONS APPROVED, NOT ACCEPTED
0
$0
10
$63,445
22
$44,366
2
$11,825
0
$0
4
$82,732
0
$0
APPLICATIONS DENIED
2
$26,015
37
$52,852
83
$62,590
43
$41,291
0
$0
15
$47,193
7
$46,079
APPLICATIONS WITHDRAWN
0
$0
8
$81,436
41
$82,546
6
$20,953
0
$0
1
$172,210
0
$0
FILES CLOSED FOR INCOMPLETENESS
0
$0
0
$0
18
$71,407
0
$0
0
$0
0
$0
0
$0
Aggregated Statistics For Year 2004 (Based on 4 partial tracts)
A) FHA, FSA/RHS & VA Home Purchase Loans
B) Conventional Home Purchase Loans
C) Refinancings
D) Home Improvement Loans
E) Loans on Dwellings For 5+ Families
F) Non-occupant Loans on < 5 Family Dwellings (A B C & D)
G) Loans On Manufactured Home Dwelling (A B C & D)
Detailed PMIC statistics for the following Tracts:0110.00
, 0111.00
2002 - 2018 National Fire Incident Reporting System (NFIRS) incidents
Based on the data from the years 2002 - 2018 the average number of fires per year is 36. The highest number of reported fires - 53 took place in 2018, and the least - 5 in 2003. The data has an increasing trend.
When looking into fire subcategories, the most incidents belonged to: Structure Fires (45.9%), and Outside Fires (31.8%).
Fire incident types reported to NFIRS in Zip Code 61846


 Nearest zip codes: 61883, 61870, 61817, 61833, 61850, 47974.


 Based on the data from the years 2002 - 2018 the average number of fires per year is 36. The highest number of reported fires - 53 took place in 2018, and the least - 5 in 2003. The data has an increasing trend.
 When looking into fire subcategories, the most incidents belonged to: Structure Fires (45.9%), and Outside Fires (31.8%).