Estimated zip code population in 2022: 4,351 Zip code population in 2010: 4,438 Zip code population in 2000: 4,622
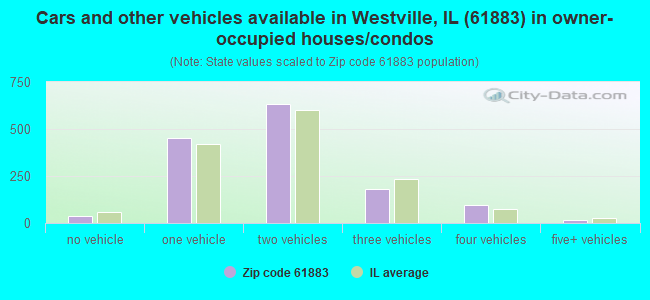
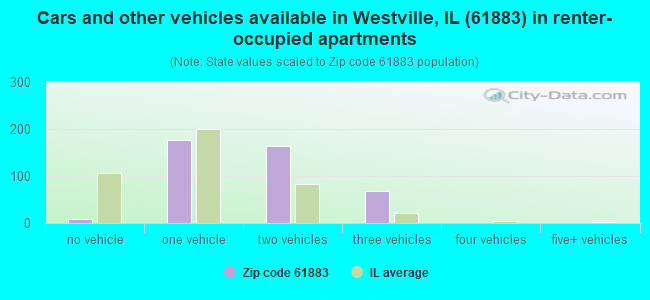
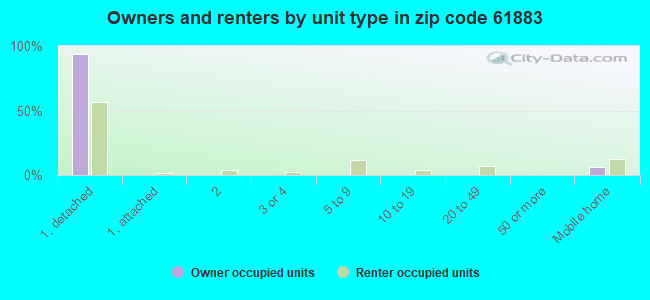
Houses and condos: 1,955 Renter-occupied apartments: 425
% of renters here:
23%
State:
33%
March 2022 cost of living index in zip code 61883: 80.9 (low, U.S. average is 100)
Land area: 21.3 sq. mi. Water area: 0.0 sq. mi.
Population density: 204 people per square mile
(very low).
OSM Map
General Map
Google Map
MSN Map
OSM Map
General Map
Google Map
MSN Map
OSM Map
General Map
Google Map
MSN Map
OSM Map
General Map
Google Map
MSN Map
Please wait while loading the map...
Real estate property taxes paid for housing units in 2022:
This zip code:
1.9% ($1,885)
Illinois:
2.0% ($4,912)
Median real estate property taxes paid for housing units with mortgages in 2022: $1,983 (1.8%) Median real estate property taxes paid for housing units with no mortgage in 2022: $1,612 (1.8%)
Business Search- 14 Million verified businesses
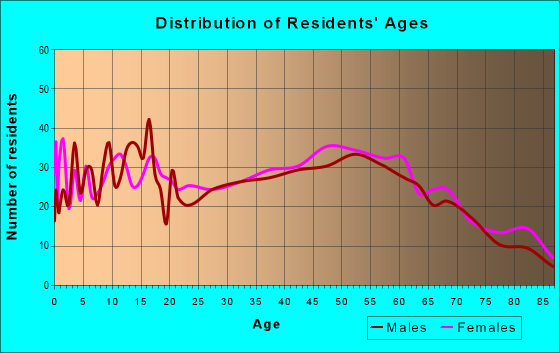
Males: 2,041
(46.9%)
Females: 2,309
(53.1%)
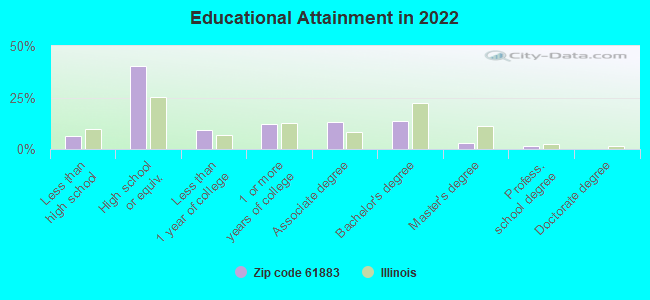
For population 25 years and over in 61883:
High school or higher: 92.5%
Bachelor's degree or higher: 18.2%
Graduate or professional degree: 4.7%
Unemployed: 3.0%
Mean travel time to work (commute): 18.1 minutes
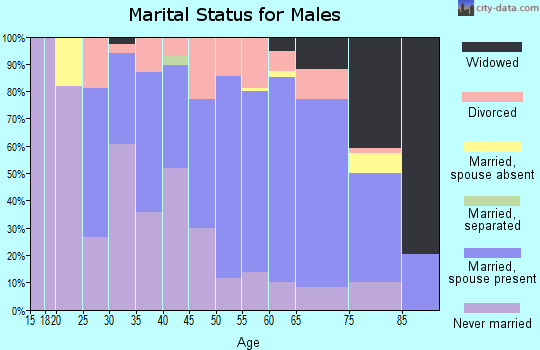
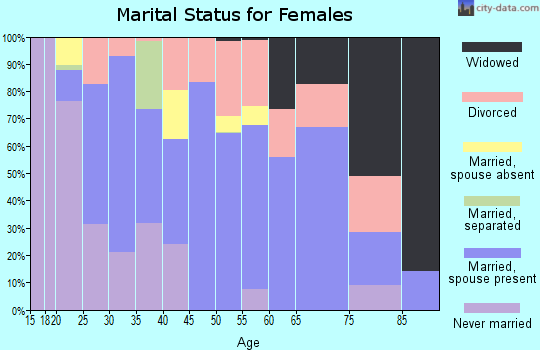
For population 15 years and over in 61883:
Never married: 27.2%
Now married: 53.2%
Separated: 1.8%
Widowed: 5.1%
Divorced: 12.7%
Zip code 61883 compared to state average:
Median house value significantly below state average.
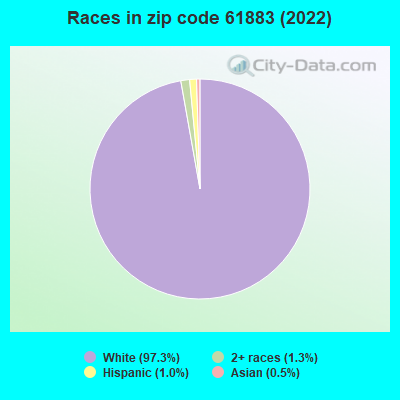
Black race population percentage significantly below state average.
Hispanic race population percentage significantly below state average.
Foreign-born population percentage significantly below state average.
Length of stay since moving in significantly above state average.
Number of college students significantly below state average.
Percentage of population with a bachelor's degree or higher below state average.
Averages for the 2020 tax year for zip code 61883, filed in 2021:
Average Adjusted Gross Income (AGI) in 2020: $47,779 (Individual Income Tax Returns)
Here:
$47,779
State:
$82,626
Salary/wage: $43,590 (reported on 79.8% of returns)
Here:
$43,590
State:
$66,640
(% of AGI for various income ranges: 965.5% for AGIs below $25k, 3165.6% for AGIs $25k-50k, 5576.1% for AGIs $50k-75k, 8049.5% for AGIs $75k-100k, 13605.0% for AGIs $100k-200k)
Taxable interest for individuals: $568 (reported on 31.0% of returns)
This zip code:
$568
Illinois:
$2,376
(% of AGI for various income ranges: 15.9% for AGIs below $25k, 15.2% for AGIs $25k-50k, 31.1% for AGIs $50k-75k, 36.3% for AGIs $75k-100k, 31.9% for AGIs $100k-200k)
Ordinary dividends: $2,172 (reported on 11.7% of returns)
Here:
$2,172
State:
$9,061
(% of AGI for various income ranges: 12.8% for AGIs below $25k, 12.6% for AGIs $25k-50k, 33.6% for AGIs $50k-75k, 40.0% for AGIs $75k-100k, 147.5% for AGIs $100k-200k)
Net capital gain/loss in AGI: +$9,189 (reported on 8.9% of returns)
Here:
+$9,189
State:
+$31,684
(% of AGI for various income ranges: 16.4% for AGIs below $25k, 12.4% for AGIs $25k-50k, 67.1% for AGIs $50k-75k, 98.4% for AGIs $75k-100k, 758.8% for AGIs $100k-200k)
Profit/loss from business: +$6,535 (reported on 10.8% of returns)
Here:
+$6,535
State:
+$12,175
(% of AGI for various income ranges: 88.3% for AGIs below $25k, 75.6% for AGIs $25k-50k, 142.5% for AGIs $50k-75k, 37.9% for AGIs $75k-100k, 88.8% for AGIs $100k-200k)
Taxable individual retirement arrangement distribution: $15,100 (reported on 8.0% of returns)
61883:
$15,100
Illinois:
$21,613
(% of AGI for various income ranges: 48.8% for AGIs below $25k, 89.6% for AGIs $25k-50k, 142.1% for AGIs $50k-75k, 231.6% for AGIs $75k-100k, 623.8% for AGIs $100k-200k)
Total itemized deductions: $23,400 (reported on 0.9% of returns)
Here:
$23,400
State:
$34,948
(% of AGI for various income ranges: 80.7% for AGIs below $25k)
Taxes paid: $4,100 (reported on 0.9% of returns)
61883:
$4,100
State:
$8,563
(% of AGI for various income ranges: 14.1% for AGIs below $25k)
Earned income credit: $2,256 (reported on 20.2% of returns)
Here:
$2,256
State:
$2,311
(% of AGI for various income ranges: 106.7% for AGIs below $25k, 70.2% for AGIs $25k-50k)
Percentage of individuals using paid preparers for their 2020 taxes: 96.2%
Here:
96%
State:
93%
(% for various income ranges: 93.4% for AGIs below $25k, 98.3% for AGIs $25k-50k, 100.0% for AGIs $50k-75k, 95.7% for AGIs $75k-100k, 95.5% for AGIs $100k-200k)
Averages for the 2012 tax year for zip code 61883, filed in 2013:
Average Adjusted Gross Income (AGI) in 2012: $39,899 (Individual Income Tax Returns)
Here:
$39,899
State:
$68,058
Salary/wage: $36,670 (reported on 83.4% of returns)
Here:
$36,670
State:
$55,396
(% of AGI for various income ranges: 67.3% for AGIs below $25k, 77.5% for AGIs $25k-50k, 77.4% for AGIs $50k-75k, 80.7% for AGIs $75k-100k, 77.2% for AGIs $100k-200k)
Taxable interest for individuals: $845 (reported on 30.3% of returns)
This zip code:
$845
Illinois:
$1,969
(% of AGI for various income ranges: 1.7% for AGIs below $25k, 0.8% for AGIs $25k-50k, 0.5% for AGIs $50k-75k, 0.4% for AGIs $75k-100k, 0.2% for AGIs $100k-200k)
Ordinary dividends: $1,640 (reported on 14.2% of returns)
Here:
$1,640
State:
$7,786
(% of AGI for various income ranges: 0.6% for AGIs below $25k, 0.4% for AGIs $25k-50k, 0.7% for AGIs $50k-75k, 0.4% for AGIs $75k-100k, 0.8% for AGIs $100k-200k)
Net capital gain/loss in AGI: +$6 (reported on 7.6% of returns)
Here:
+$6
State:
+$22,183
(% of AGI for various income ranges: )
Profit/loss from business: +$5,429 (reported on 11.4% of returns)
Here:
+$5,429
State:
+$12,903
(% of AGI for various income ranges: 4.2% for AGIs below $25k, 1.7% for AGIs $25k-50k, 0.6% for AGIs $50k-75k, 2.1% for AGIs $75k-100k)
Taxable individual retirement arrangement distribution: $9,180 (reported on 9.5% of returns)
61883:
$9,180
Illinois:
$17,929
(% of AGI for various income ranges: 2.9% for AGIs below $25k, 2.1% for AGIs $25k-50k, 1.8% for AGIs $50k-75k, 4.2% for AGIs $75k-100k)
Total itemized deductions: $15,750 (21% of AGI, reported on 13.3% of returns)
Here:
$15,750
State:
$26,433
Here:
21.1% of AGI
State:
19.2% of AGI
(% of AGI for various income ranges: 5.2% for AGIs $25k-50k, 5.5% for AGIs $50k-75k, 5.8% for AGIs $75k-100k, 8.2% for AGIs $100k-200k)
Charity contributions: $2,573 (reported on 7.1% of returns)
Here:
$2,573
State:
$4,525
(% of AGI for various income ranges: 0.4% for AGIs $25k-50k, 0.7% for AGIs $50k-75k, 0.5% for AGIs $75k-100k, 0.7% for AGIs $100k-200k)
Taxes paid: $5,441 (reported on 12.8% of returns)
61883:
$5,441
State:
$11,968
(% of AGI for various income ranges: 1.0% for AGIs $25k-50k, 1.6% for AGIs $50k-75k, 2.0% for AGIs $75k-100k, 3.9% for AGIs $100k-200k)
Earned income credit: $2,367 (reported on 19.9% of returns)
Here:
$2,367
State:
$2,349
(% of AGI for various income ranges: 7.1% for AGIs below $25k, 0.9% for AGIs $25k-50k)
Percentage of individuals using paid preparers for their 2012 taxes: 68.7%
Here:
69%
State:
57%
(% for various income ranges: 65.2% for AGIs below $25k, 71.2% for AGIs $25k-50k, 69.7% for AGIs $50k-75k, 72.2% for AGIs $75k-100k, 75.0% for AGIs $100k-200k)
Averages for the 2004 tax year for zip code 61883, filed in 2005:
Average Adjusted Gross Income (AGI) in 2004: $32,284 (Individual Income Tax Returns)
Here:
$32,284
State:
$54,625
Salary/wage: $30,110 (reported on 85.7% of returns)
Here:
$30,110
State:
$46,811
(% of AGI for various income ranges: 101.1% for AGIs below $10k, 69.9% for AGIs $10k-25k, 80.3% for AGIs $25k-50k, 86.0% for AGIs $50k-75k, 82.8% for AGIs $75k-100k, 66.4% for AGIs over 100k)
Taxable interest for individuals: $1,246 (reported on 43.8% of returns)
This zip code:
$1,246
Illinois:
$2,101
(% of AGI for various income ranges: 5.5% for AGIs below $10k, 3.4% for AGIs $10k-25k, 1.6% for AGIs $25k-50k, 1.3% for AGIs $50k-75k, 0.8% for AGIs $75k-100k, 0.6% for AGIs over 100k)
Taxable dividends: $993 (reported on 18.5% of returns)
Here:
$993
State:
$4,306
(% of AGI for various income ranges: 1.6% for AGIs below $10k, 0.9% for AGIs $10k-25k, 0.6% for AGIs $25k-50k, 0.4% for AGIs $50k-75k, 0.4% for AGIs $75k-100k, 0.5% for AGIs over 100k)
Net capital gain/loss: +$1,340 (reported on 9.8% of returns)
Here:
+$1,340
State:
+$17,321
(% of AGI for various income ranges: -0.9% for AGIs below $10k, 0.4% for AGIs $10k-25k, -0.0% for AGIs $25k-50k, 0.1% for AGIs $50k-75k, 0.5% for AGIs $75k-100k, 3.0% for AGIs over 100k)
Profit/loss from business: +$2,635 (reported on 11.0% of returns)
Here:
+$2,635
State:
+$11,771
(% of AGI for various income ranges: 0.5% for AGIs below $10k, 2.3% for AGIs $10k-25k, 0.7% for AGIs $25k-50k, 0.8% for AGIs $50k-75k, 0.7% for AGIs $75k-100k)
Profit/loss from farming: +$250 (reported on 0.9% of returns)
Here:
+$250
State:
+$2,327
IRA payment deduction: $2,833 (reported on 1.6% of returns)
61883:
$2,833
Illinois:
$3,087
Total itemized deductions: $13,543 (22% of AGI, reported on 12.1% of returns)
Here:
$13,543
State:
$20,239
Here:
22.3% of AGI
State:
19.5% of AGI
(% of AGI for various income ranges: 4.2% for AGIs $10k-25k, 4.7% for AGIs $25k-50k, 5.1% for AGIs $50k-75k, 6.0% for AGIs $75k-100k, 7.4% for AGIs over 100k)
Charity contributions deductions: $1,701 (3% of AGI, reported on 9.0% of returns)
Here:
$1,701
State:
$3,719
Here:
2.6% of AGI
State:
3.4% of AGI
(% of AGI for various income ranges: 0.2% for AGIs $10k-25k, 0.2% for AGIs $25k-50k, 0.6% for AGIs $50k-75k, 0.5% for AGIs $75k-100k, 1.3% for AGIs over 100k)
Total tax: $3,723 (reported on 71.8% of returns)
61883:
$3,723
State:
$9,882
(% of AGI for various income ranges: 2.3% for AGIs below $10k, 3.7% for AGIs $10k-25k, 6.8% for AGIs $25k-50k, 9.0% for AGIs $50k-75k, 10.8% for AGIs $75k-100k, 16.4% for AGIs over 100k)
Earned income credit: $1,687 (reported on 17.6% of returns)
Here:
$1,687
State:
$1,788
Percentage of individuals using paid preparers for their 2004 taxes: 70.1%
Here:
70%
State:
61%
(% for various income ranges: 62.4% for AGIs below $10k, 71.2% for AGIs $10k-25k, 72.2% for AGIs $25k-50k, 73.8% for AGIs $50k-75k, 76.0% for AGIs $75k-100k, 60.9% for AGIs over 100k)
Likely homosexual households (counted as self-reported same-sex unmarried-partner households)
Lesbian couples: 0.0% of all households
Gay men: 0.2% of all households
Household received Food Stamps/SNAP in the past 12 months: 175 Household did not receive Food Stamps/SNAP in the past 12 months: 1,647
Women who had a birth in the past 12 months: 95 (33 now married, 62 unmarried) Women who did not have a birth in the past 12 months: 915 (510 now married, 399 unmarried)
Housing units in zip code 61883 with a mortgage: 653 (27 second mortgage, 27 both second mortgage and home equity loan) Median monthly owner costs for units with a mortgage: $960 Median monthly owner costs for units without a mortgage: $436
Residents with income below the poverty level in 2022:
This zip code:
8.6%
Whole state:
11.9%
Residents with income below 50% of the poverty level in 2022:
This zip code:
6.3%
Whole state:
5.7%
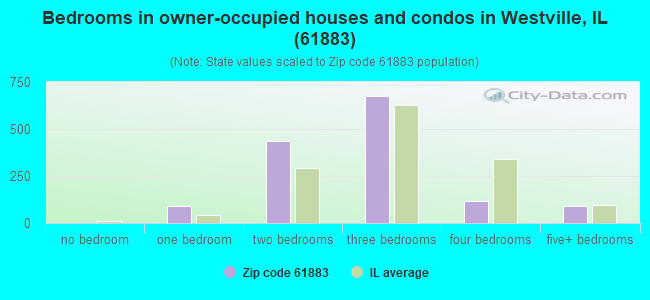
Median number of rooms in houses and condos:
Here:
5.7
State:
6.4
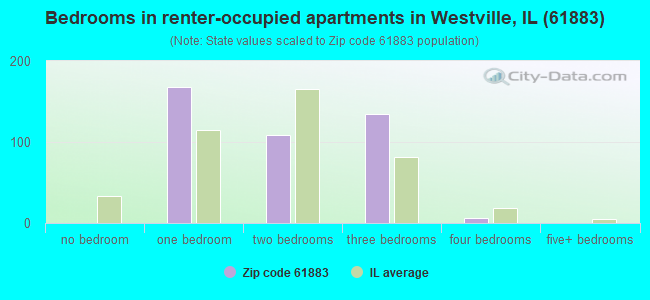
Median number of rooms in apartments:
Here:
4.1
State:
4.1
Notable locations in this zip code not listed on our city pages
Churches in zip code 61883 include: Fairview United Methodist Church (A), New Start Gospel Center (B), Saint Marys Church (C), Saints Peter and Paul Catholic Church (D), Trinity United Church of Christ (E), Westville First Church of Christ (F). Display/hide their locations on the map
Cemeteries: Lithuanian Cemetery (1), Locket Cemetery (2), Saints Peter and Paul Cemetery (3), Sandusky Cemetery (4), Dukes Cemetery (5). Display/hide their locations on the map
Size of family households: 556 2-persons, 294 3-persons, 188 4-persons, 57 5-persons, 90 6-persons
Size of nonfamily households: 578 1-person, 52 2-persons, 12 3-persons
545 married couples with children.
373 single-parent households (70 men, 303 women).
97.0% of residents of 61883 zip code speak English at home.
1.4% of residents speak Spanish at home (28% very well, 72% not well).
0.7% of residents speak other Indo-European language at home (100% very well).
0.1% of residents speak Asian or Pacific Island language at home (100% not well).
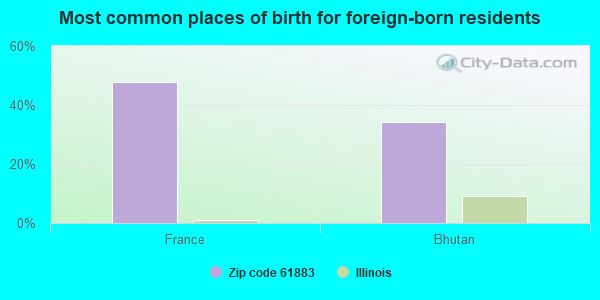
Foreign born population: 44 (1.0%) (34.3% of them are naturalized citizens)
This zip code:
1.0%
Whole state:
14.4%
48%France
34%Bhutan
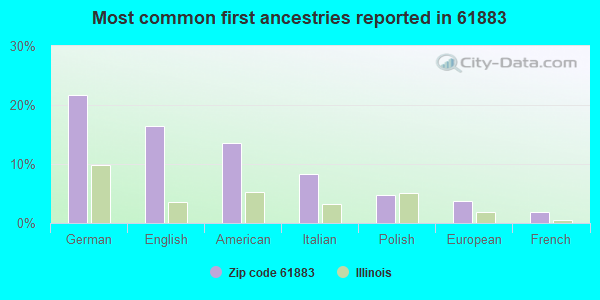
22%German
16%English
14%American
8%Italian
5%Polish
4%European
2%French
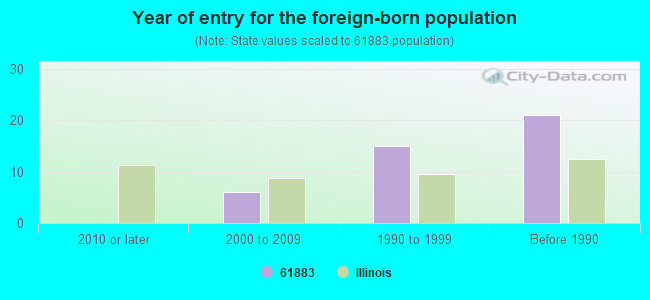
Year of entry for the foreign-born population
02010 or later
62000 to 2009
151990 to 1999
21Before 1990
Facilities with environmental interests located in this zip code:
INTERSTATE HEAT TREATING INC (2603 GEORGETOWN RD in WESTVILLE, IL)
STATE MASTER (Illinois EPA Project) - SOLID WASTE PROGRAM, HAZARDOUS WASTE PROGRAM, SCRAP TIRE MANAGEMENT SUPERFUND (Superfund database) Large Quantity Generators, more that 1000 kg of hazardous waste/month (Resource Conservation and Recovery Act (tracking hazardous waste)) Business NAICS classification: METAL HEAT TREATING. Organizations: HENRY RUSH (CONTACT/OPERATOR)
Alternative names: TMF CENTER INC
MAYFLOWER CONTRACT SERVICES (125 ELLSWORTH in WESTVILLE, IL)
STATE MASTER (Illinois EPA Project) - SOLID WASTE PROGRAM National Pollutant Discharge Elimination System NON-MAJOR (Tracking pollutant discharge elimination systems) - permit
MARATHON ASHLAND PETROLEUM (202 S STATE in WESTVILLE, IL)
STATE MASTER (Illinois EPA Project) - SOLID WASTE PROGRAM, (Resource Conservation and Recovery Act (tracking hazardous waste))
CRONKHITE IND INC (233 S STATE ST in WESTVILLE, IL)
STATE MASTER (Illinois EPA Project) - HAZARDOUS WASTE PROGRAM (Resource Conservation and Recovery Act (tracking hazardous waste)) Organizations: CRONKHITE CYNTHIA (CONTACT/OWNER)
O NEIL BROTHERS/DIV OF MACC OF ILL INC (LYONS ROAD,0.3 MILE W OF RTE 1 in WESTVILLE, IL)
STATE MASTER (Illinois EPA Project) - AIR PROGRAM AIR MINOR (AIRS/AFS) Business SIC classification: NONCLASSIFIABLE ESTABLISHMENTS Alternative names: O'NEIL BROTHERS/DIV OF MACC OF ILL INC
RIPPON, EDWARD-VERMILION ILL (1004 SOUTH ST in WESTVILLE, IL)
STATE MASTER (Illinois EPA Project) - HAZARDOUS WASTE PROGRAM TRANSPORTER (Resource Conservation and Recovery Act (tracking hazardous waste)) Organizations: RIPPON EDWARD (CONTACT/OWNER)
Alternative names: RIPPON EDWARD VERMILION ILLINOIS
JUDITH GIACOMA ELEM SCHOOL (200 S WALNUT ST in WESTVILLE, IL)
(National Center for Education Statistics) - STATE ID-5409200202001 Organizations: WESTVILLE C U SCHOOL DIST 2 (SCHOOL DISTRICT)
MC MILLAN ELEM SCHOOL (2534 GEORGETOWN RD in WESTVILLE, IL)
(National Center for Education Statistics) - STATE ID-5409200202002 Organizations: WESTVILLE C U SCHOOL DIST 2 (SCHOOL DISTRICT)
MIDDLEFORK SCHOOL (2534 GEORGETOWN RD in WESTVILLE, IL)
(National Center for Education Statistics) - STATE ID-5400000009302 Organizations: VERMILLION ROE (SCHOOL DISTRICT)
ILLICO INDEPENDENT OIL CO (1717 N STATE ST in WESTVILLE, IL)
Small Quantity Generators, between 100 kg and 1000 kg of hazardous waste/month (Resource Conservation and Recovery Act (tracking hazardous waste)) - notification
LAIDLAW MAYFLOWER (1000 N STATE ST in WESTVILLE, IL)
Conditionally Exempt Small Quantity Generators, less than 100 kg/month of hazardous waste (Resource Conservation and Recovery Act (tracking hazardous waste)) - notification Organizations: WESTVILLE CUSD NO 2 (CONTACT/OWNER)
CVS 6924 (111 N STATE ST in WESTVILLE, IL)
Small Quantity Generators, between 100 kg and 1000 kg of hazardous waste/month (Resource Conservation and Recovery Act (tracking hazardous waste)) - notification Organizations: CVS INC (CONTACT/OWNER)
Housing units lacking complete plumbing facilities: 1.4% Housing units lacking complete kitchen facilities: 2.2%
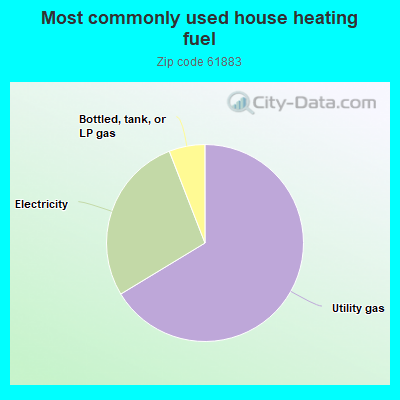
66.4%Utility gas
27.8%Electricity
5.9%Bottled, tank, or LP gas
Population in 1990: 4,398. Population change in the 1990s: +224 (+5.1%).
Place of birth for U.S.-born residents:
This state: 3,933
Northeast: 11
Midwest: 171
South: 85
West: 84
67% of the 61883 zip code residents lived in the same house 5 years ago. Out of people who lived in different houses, 83% lived in this county. Out of people who lived in different counties, 50% lived in Illinois.
93% of the 61883 zip code residents lived in the same house 1 year ago. Out of people who lived in different houses, 90% moved from this county. Out of people who lived in different houses, 3% moved from different county within same state. Out of people who lived in different houses, 0% moved from different state.
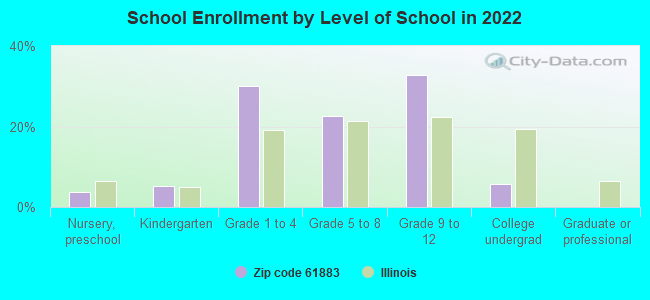
Private vs. public school enrollment:
Students in private schools in grades 1 to 8 (elementary and middle school):
Here:
0.0%
Illinois:
13.3%
Students in private schools in grades 9 to 12 (high school):
Here:
0.0%
Illinois:
9.9%
Students in private undergraduate colleges: 2
Here:
4.9%
Illinois:
27.4%
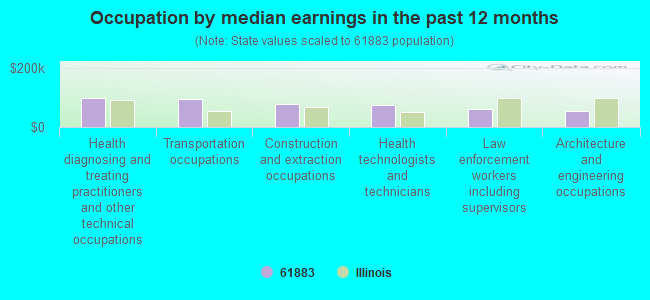
Occupation by median earnings in the past 12 months ($)
98,805Health diagnosing and treating practitioners and other technical occupations
93,347Transportation occupations
75,925Construction and extraction occupations
73,909Health technologists and technicians
61,748Law enforcement workers including supervisors
52,763Architecture and engineering occupations
Companies with federal contracts located in this zip code:
ELAINE (SUE) ELLIS (1711 S STATE ST in WESTVILLE, IL; small business) : $23,350 in 7 contractsfrom 2003 to 2004
Contracts for Landscaping/Groundskeeping Services, Snow Removal/Salt Service (also spreading aggregate or other snow melting material), Trash/Garbage Collection Services - Including Portable Sanitation Services by Army Signed by year:2000: $0; 2001: $0; 2002: $0; 2003: $14,220; 2004: $9,130; 2005: $0; 2006: $0.
Biggest contracts:
$9,130 with Army for Landscaping/Groundskeeping Services. Signed on 2004-03-14. Completion date: 2004-03-31.
$8,440, same as above.Signed on 2003-03-06. Completion date: 2004-03-31.
$3,440 with Army for Snow Removal/Salt Service (also spreading aggregate or other snow melting material). Signed on 2003-11-01. Completion date: 2004-10-31.
$2,340 with Army for Trash/Garbage Collection Services - Including Portable Sanitation Services. Signed on 2003-02-27. Completion date: 2004-03-31.
Top industries in this zip code by the number of employees in 2005:
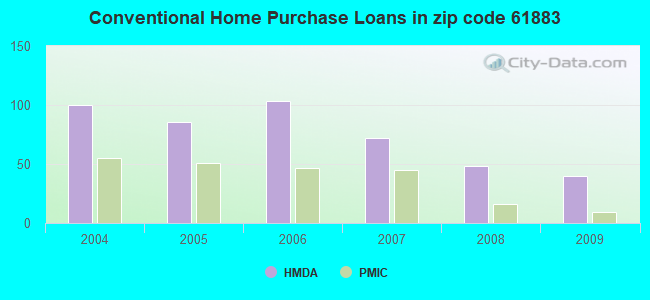
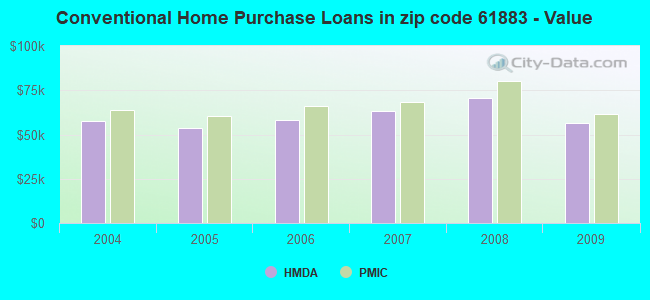
Detailed PMIC statistics for the following Tracts:0106.00
, 0110.00
2002 - 2018 National Fire Incident Reporting System (NFIRS) incidents
Based on the data from the years 2002 - 2018 the average number of fire incidents per year is 32. The highest number of fire incidents - 48 took place in 2005, and the least - 10 in 2004. The data has a rising trend.
When looking into fire subcategories, the most incidents belonged to: Structure Fires (48.0%), and Outside Fires (31.6%).
Fire incident types reported to NFIRS in Zip Code 61883


 Nearest zip codes: 61833, 61846, 61817, 61832, 61834, 61870.


 Based on the data from the years 2002 - 2018 the average number of fire incidents per year is 32. The highest number of fire incidents - 48 took place in 2005, and the least - 10 in 2004. The data has a rising trend.
 When looking into fire subcategories, the most incidents belonged to: Structure Fires (48.0%), and Outside Fires (31.6%).