Estimated zip code population in 2022: 930 Zip code population in 2010: 1,185 Zip code population in 2000: 1,287
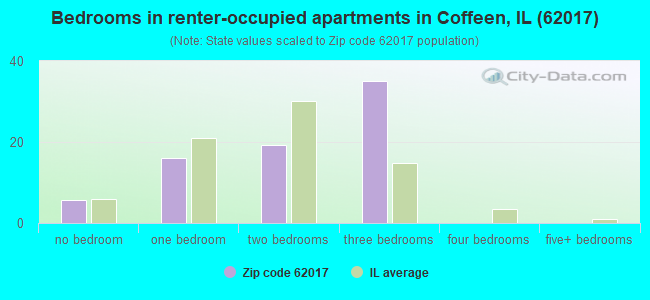
Houses and condos: 580 Renter-occupied apartments: 77
% of renters here:
16%
State:
33%
March 2022 cost of living index in zip code 62017: 84.0 (less than average, U.S. average is 100)
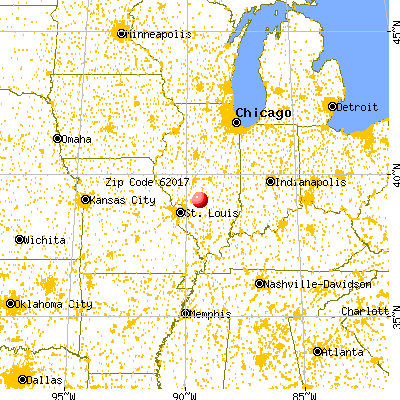
Land area: 31.7 sq. mi. Water area: 1.1 sq. mi.
Population density: 29 people per square mile
(very low).
OSM Map
General Map
Google Map
MSN Map
OSM Map
General Map
Google Map
MSN Map
OSM Map
General Map
Google Map
MSN Map
OSM Map
General Map
Google Map
MSN Map
Please wait while loading the map...
Real estate property taxes paid for housing units in 2022:
This zip code:
1.3% ($1,290)
Illinois:
2.0% ($4,912)
Median real estate property taxes paid for housing units with mortgages in 2022: $1,572 (2.3%) Median real estate property taxes paid for housing units with no mortgage in 2022: $972 (1.7%)
Business Search- 14 Million verified businesses
Males: 480
(51.7%)
Females: 449
(48.3%)
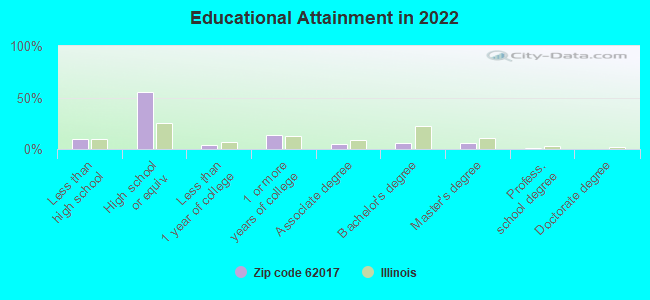
For population 25 years and over in 62017:
High school or higher: 88.3%
Bachelor's degree or higher: 12.7%
Graduate or professional degree: 6.7%
Unemployed: 6.4%
Mean travel time to work (commute): 19.9 minutes
For population 15 years and over in 62017:
Never married: 22.6%
Now married: 44.6%
Separated: 1.2%
Widowed: 15.0%
Divorced: 16.5%
Zip code 62017 compared to state average:
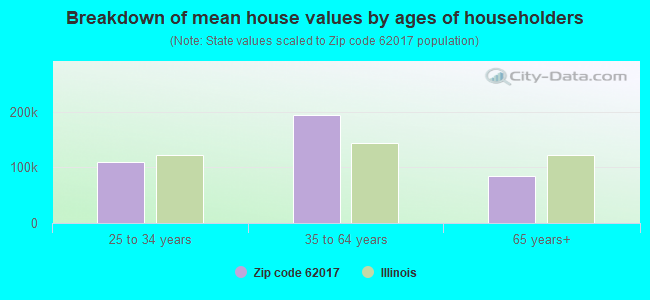
Median house value significantly below state average.
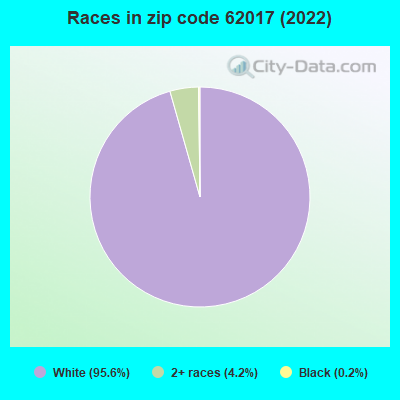
Black race population percentage significantly below state average.
Hispanic race population percentage significantly below state average.
Median age above state average.
Foreign-born population percentage significantly below state average.
Renting percentage below state average.
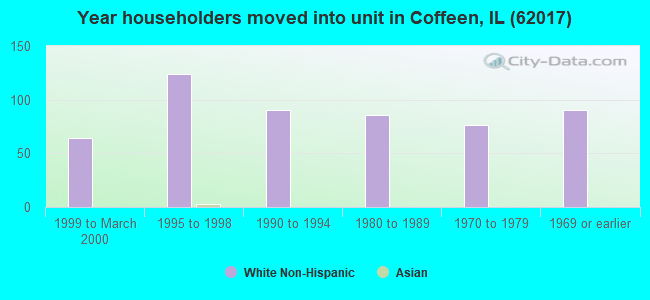
Length of stay since moving in significantly above state average.
Number of college students below state average.
Percentage of population with a bachelor's degree or higher significantly below state average.
Averages for the 2020 tax year for zip code 62017, filed in 2021:
Average Adjusted Gross Income (AGI) in 2020: $51,246 (Individual Income Tax Returns)
Here:
$51,246
State:
$82,626
Salary/wage: $42,221 (reported on 79.2% of returns)
Here:
$42,221
State:
$66,640
(% of AGI for various income ranges: 941.7% for AGIs below $25k, 2846.4% for AGIs $25k-50k, 5948.3% for AGIs $50k-75k, 7270.0% for AGIs $75k-100k, 10612.0% for AGIs $100k-200k)
Taxable interest for individuals: $1,430 (reported on 41.7% of returns)
This zip code:
$1,430
Illinois:
$2,376
(% of AGI for various income ranges: 31.7% for AGIs below $25k, 64.5% for AGIs $25k-50k, 158.3% for AGIs $50k-75k, 97.5% for AGIs $75k-100k, 86.0% for AGIs $100k-200k)
Ordinary dividends: $1,722 (reported on 18.8% of returns)
Here:
$1,722
State:
$9,061
(% of AGI for various income ranges: 41.8% for AGIs $25k-50k, 81.7% for AGIs $50k-75k, 120.0% for AGIs $100k-200k)
Net capital gain/loss in AGI: +$1,471 (reported on 14.6% of returns)
Here:
+$1,471
State:
+$31,684
(% of AGI for various income ranges: 20.9% for AGIs $25k-50k, 200.0% for AGIs $75k-100k)
Profit/loss from business: +$2,214 (reported on 14.6% of returns)
Here:
+$2,214
State:
+$12,175
(% of AGI for various income ranges: 174.2% for AGIs below $25k)
Taxable individual retirement arrangement distribution: $12,760 (reported on 10.4% of returns)
62017:
$12,760
Illinois:
$21,613
(% of AGI for various income ranges: 103.3% for AGIs below $25k, 856.7% for AGIs $50k-75k)
Earned income credit: $2,129 (reported on 14.6% of returns)
Here:
$2,129
State:
$2,311
(% of AGI for various income ranges: 67.5% for AGIs below $25k, 61.8% for AGIs $25k-50k)
Percentage of individuals using paid preparers for their 2020 taxes: 97.9%
Here:
98%
State:
93%
(% for various income ranges: 93.8% for AGIs below $25k, 100.0% for AGIs $25k-50k, 100.0% for AGIs $50k-75k, 100.0% for AGIs $75k-100k, 100.0% for AGIs $100k-200k)
Averages for the 2012 tax year for zip code 62017, filed in 2013:
Average Adjusted Gross Income (AGI) in 2012: $43,775 (Individual Income Tax Returns)
Here:
$43,775
State:
$68,058
Salary/wage: $37,207 (reported on 78.8% of returns)
Here:
$37,207
State:
$55,396
(% of AGI for various income ranges: 59.8% for AGIs below $25k, 69.0% for AGIs $25k-50k, 66.2% for AGIs $50k-75k, 76.5% for AGIs $75k-100k, 63.6% for AGIs $100k-200k)
Taxable interest for individuals: $995 (reported on 38.5% of returns)
This zip code:
$995
Illinois:
$1,969
(% of AGI for various income ranges: 2.3% for AGIs below $25k, 0.8% for AGIs $25k-50k, 1.4% for AGIs $50k-75k, 0.5% for AGIs $100k-200k)
Ordinary dividends: $970 (reported on 19.2% of returns)
Here:
$970
State:
$7,786
(% of AGI for various income ranges: 0.7% for AGIs below $25k, 0.5% for AGIs $25k-50k, 0.7% for AGIs $50k-75k, 0.3% for AGIs $100k-200k)
Net capital gain/loss in AGI: +$800 (reported on 7.7% of returns)
Here:
+$800
State:
+$22,183
Profit/loss from business: +$5,900 (reported on 13.5% of returns)
Here:
+$5,900
State:
+$12,903
(% of AGI for various income ranges: 3.9% for AGIs below $25k, 5.7% for AGIs $25k-50k, 1.2% for AGIs $75k-100k)
Taxable individual retirement arrangement distribution: $9,725 (reported on 15.4% of returns)
62017:
$9,725
Illinois:
$17,929
Total itemized deductions: $16,544 (21% of AGI, reported on 17.3% of returns)
Here:
$16,544
State:
$26,433
Here:
20.9% of AGI
State:
19.2% of AGI
(% of AGI for various income ranges: 12.3% for AGIs below $25k, 12.7% for AGIs $50k-75k, 7.6% for AGIs $100k-200k)
Charity contributions: $2,960 (reported on 9.6% of returns)
Here:
$2,960
State:
$4,525
Taxes paid: $4,670 (reported on 19.2% of returns)
62017:
$4,670
State:
$11,968
(% of AGI for various income ranges: 2.3% for AGIs below $25k, 3.5% for AGIs $50k-75k, 3.4% for AGIs $100k-200k)
Earned income credit: $2,080 (reported on 19.2% of returns)
Here:
$2,080
State:
$2,349
(% of AGI for various income ranges: 6.3% for AGIs below $25k, 1.1% for AGIs $25k-50k)
Percentage of individuals using paid preparers for their 2012 taxes: 69.2%
Here:
69%
State:
57%
(% for various income ranges: 65.0% for AGIs below $25k, 64.3% for AGIs $25k-50k, 77.8% for AGIs $50k-75k, 75.0% for AGIs $75k-100k, 80.0% for AGIs $100k-200k)
Averages for the 2004 tax year for zip code 62017, filed in 2005:
Average Adjusted Gross Income (AGI) in 2004: $33,563 (Individual Income Tax Returns)
Here:
$33,563
State:
$54,625
Salary/wage: $31,646 (reported on 78.1% of returns)
Here:
$31,646
State:
$46,811
(% of AGI for various income ranges: 78.2% for AGIs below $10k, 61.5% for AGIs $10k-25k, 73.1% for AGIs $25k-50k, 80.5% for AGIs $50k-75k, 78.3% for AGIs $75k-100k, 63.9% for AGIs over 100k)
Taxable interest for individuals: $1,720 (reported on 50.3% of returns)
This zip code:
$1,720
Illinois:
$2,101
(% of AGI for various income ranges: 9.2% for AGIs below $10k, 4.6% for AGIs $10k-25k, 2.7% for AGIs $25k-50k, 1.1% for AGIs $50k-75k, 3.0% for AGIs $75k-100k, 1.0% for AGIs over 100k)
Taxable dividends: $968 (reported on 23.0% of returns)
Here:
$968
State:
$4,306
(% of AGI for various income ranges: 2.2% for AGIs below $10k, 1.2% for AGIs $10k-25k, 0.8% for AGIs $25k-50k, 0.3% for AGIs $50k-75k, 0.7% for AGIs $75k-100k)
Net capital gain/loss: +$254 (reported on 12.2% of returns)
Here:
+$254
State:
+$17,321
Profit/loss from business: +$3,139 (reported on 14.4% of returns)
Here:
+$3,139
State:
+$11,771
(% of AGI for various income ranges: 15.9% for AGIs below $10k, 2.6% for AGIs $10k-25k, -0.2% for AGIs $25k-50k, 2.4% for AGIs $50k-75k)
Total itemized deductions: $14,625 (24% of AGI, reported on 14.6% of returns)
Here:
$14,625
State:
$20,239
Here:
24.4% of AGI
State:
19.5% of AGI
(% of AGI for various income ranges: 20.4% for AGIs below $10k, 5.0% for AGIs $25k-50k, 6.9% for AGIs $50k-75k, 15.1% for AGIs $75k-100k)
Charity contributions deductions: $2,491 (4% of AGI, reported on 10.4% of returns)
Here:
$2,491
State:
$3,719
Here:
4.2% of AGI
State:
3.4% of AGI
Total tax: $3,577 (reported on 77.0% of returns)
62017:
$3,577
State:
$9,882
(% of AGI for various income ranges: 3.5% for AGIs below $10k, 4.1% for AGIs $10k-25k, 6.5% for AGIs $25k-50k, 8.2% for AGIs $50k-75k, 10.8% for AGIs $75k-100k, 16.9% for AGIs over 100k)
Earned income credit: $1,551 (reported on 14.3% of returns)
Here:
$1,551
State:
$1,788
Percentage of individuals using paid preparers for their 2004 taxes: 76.2%
Here:
76%
State:
61%
(% for various income ranges: 71.7% for AGIs below $10k, 82.0% for AGIs $10k-25k, 73.7% for AGIs $25k-50k, 80.0% for AGIs $50k-75k, 72.7% for AGIs $75k-100k, 78.6% for AGIs over 100k)
Household received Food Stamps/SNAP in the past 12 months: 54 Household did not receive Food Stamps/SNAP in the past 12 months: 422
Women who had a birth in the past 12 months: 12 (2 now married, 9 unmarried) Women who did not have a birth in the past 12 months: 172 (69 now married, 103 unmarried)
Housing units in zip code 62017 with a mortgage: 143 Median monthly owner costs for units with a mortgage: $1,103 Median monthly owner costs for units without a mortgage: $420
Residents with income below the poverty level in 2022:
This zip code:
12.1%
Whole state:
11.9%
Residents with income below 50% of the poverty level in 2022:
This zip code:
5.9%
Whole state:
5.7%
Median number of rooms in houses and condos:
Here:
5.9
State:
6.4
Median number of rooms in apartments:
Here:
4.8
State:
4.1
Notable locations in this zip code not listed on our city pages
Notable locations in zip code 62017: Coffeen Power Station (A), Forsee Vineyards (B), Coffeen Volunteer Fire Department (C). Display/hide their locations on the map
Churches in zip code 62017 include: East Fork Church (A), Coffeen Free Methodist Church (B), Coffeen Methodist Church (C), New Life Assembly of God Church (D), Saint Johns Catholic Church (E), Mount Moriah Church (F). Display/hide their locations on the map
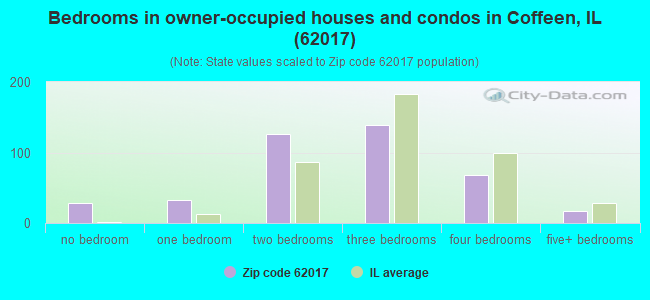
Size of family households: 110 2-persons, 15 3-persons, 14 4-persons, 30 5-persons, 27 6-persons
Size of nonfamily households: 244 1-person, 40 2-persons
129 married couples with children.
15 single-parent households (14 men, 1 women).
99.8% of residents of 62017 zip code speak English at home.
Foreign born population: 0 (0.0%)
:
0.0%
Whole state:
14.4%
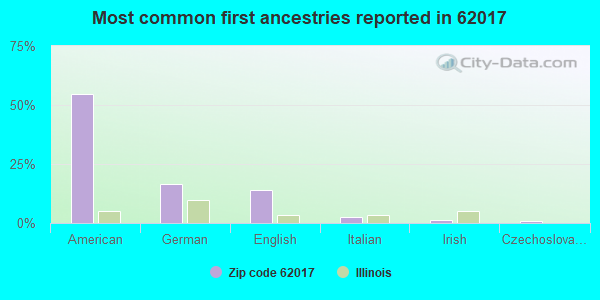
55%American
16%German
14%English
3%Italian
1%Irish
1%Czechoslovakian
0%Swiss
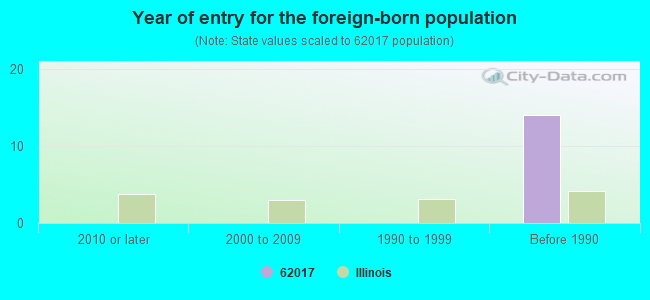
Year of entry for the foreign-born population
02010 or later
02000 to 2009
01990 to 1999
14Before 1990
Facilities with environmental interests located in this zip code:
AMEREN ENERGY GENERATING CO (134 CIPS LANE in COFFEEN, IL)
STATE MASTER (Illinois EPA Project) - SOLID WASTE PROGRAM, HAZARDOUS WASTE PROGRAM, AIR PROGRAM STATE MASTER (Illinois EPA Project) - National Pollutant Discharge Elimination System Permit AIR MAJOR (AIRS/AFS) AIR PROGRAM (Clean Air Markets Division Business System) (Integrated Compliance Information System) - ICIS-05-1985-0421, FORMAL ENFORCEMENT ACTION, ICIS-05-1976-0002, CRITERIA AND HAZARDOUS AIR POLLUTANT INVENTORY (Inventory of air pollution sources) National Pollutant Discharge Elimination System MAJOR (Tracking pollutant discharge elimination systems) - permit Small Quantity Generators, between 100 kg and 1000 kg of hazardous waste/month (Resource Conservation and Recovery Act (tracking hazardous waste)) TSD (Resource Conservation and Recovery Act (tracking hazardous waste)) TRI REPORTER (Tracking of toxic chemicals releasing facilities) Business SIC classification: ELECTRIC SERVICES; ELECTRIC AND OTHER SERVICES COMBINED Organizations: AMEREN - COFFEEN POWER STATION (CONTACT/OWNER)
, AMEREN ENERGY GENERATING COMPANY (OWNER/OPERATOR)
Alternative names: AMEREN CORP., AMEREN CORP.COFFEEN POWER STATION, AMEREN CIPS, AMEREN CIPS - COFFEEN, AMEREN - COFFEEN POWER STATION, AMEREN CORP. C/O STEVE BURNS, AMEREN ENERGY GENERATING COFFEEN POWER STATION, AMEREN SERVICES, CENTRAL ILLINOIS PUBLIC SERVICE, COFFEEN
ROYER OIL CO (100 GRAND ST in COFFEEN, IL)
STATE MASTER (Illinois EPA Project) - AIR PROGRAM AIR MINOR (AIRS/AFS) CRITERIA AND HAZARDOUS AIR POLLUTANT INVENTORY (Inventory of air pollution sources) Business SIC classification: PETROLEUM BULK STATIONS AND TERMINALS
COFFEEN (P.O. BOX 496 in COFFEEN, IL)
STATE MASTER (Illinois EPA Project) - DRINKING WATER PROGRAM National Pollutant Discharge Elimination System NON-MAJOR (Tracking pollutant discharge elimination systems) - permit Business SIC classification: SEWERAGE SYSTEMS Alternative names: COFFEEN STP
COFFEEN STP (LAGOON ROAD in COFFEEN, IL)
STATE MASTER (Illinois EPA Project) - National Pollutant Discharge Elimination System Permit National Pollutant Discharge Elimination System NON-MAJOR (Tracking pollutant discharge elimination systems) - permit Business SIC classification: SEWERAGE SYSTEMS Alternative names: COFFEEN STP, CITY OF
COFFEEN ELEM SCHOOL (PO BOX 188 in COFFEEN, IL)
(National Center for Education Statistics) - STATE ID-1006800302006 Organizations: HILLSBORO COMM UNIT SCH DIST 3 (SCHOOL DISTRICT)
Housing units lacking complete plumbing facilities: 4.2% Housing units lacking complete kitchen facilities: 6.1%
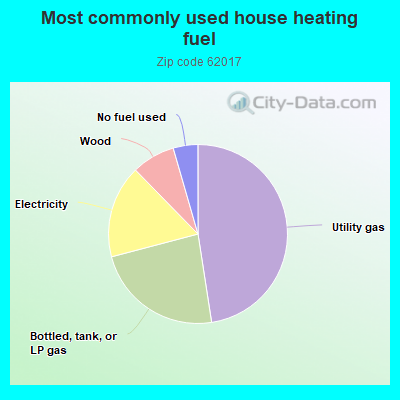
47.9%Utility gas
23.5%Bottled, tank, or LP gas
16.9%Electricity
7.9%Wood
4.5%No fuel used
Population in 1990: 1,207. Population change in the 1990s: +80 (+6.6%).
Place of birth for U.S.-born residents:
This state: 728
Northeast: 7
Midwest: 73
South: 86
West: 15
71% of the 62017 zip code residents lived in the same house 5 years ago. Out of people who lived in different houses, 65% lived in this county. Out of people who lived in different counties, 50% lived in Illinois.
88% of the 62017 zip code residents lived in the same house 1 year ago. Out of people who lived in different houses, 42% moved from this county. Out of people who lived in different houses, 23% moved from different county within same state. Out of people who lived in different houses, 23% moved from different state. Out of people who lived in different houses, 12% moved from abroad.
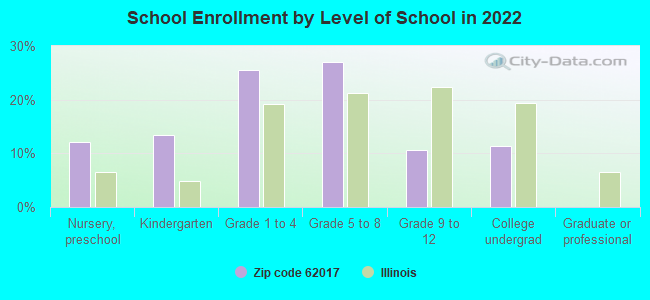
Private vs. public school enrollment:
Students in private schools in grades 1 to 8 (elementary and middle school): 3
Here:
4.2%
Illinois:
13.3%
Students in private schools in grades 9 to 12 (high school): 1
Here:
12.7%
Illinois:
9.9%
Students in private undergraduate colleges:
Here:
0.0%
Illinois:
27.4%
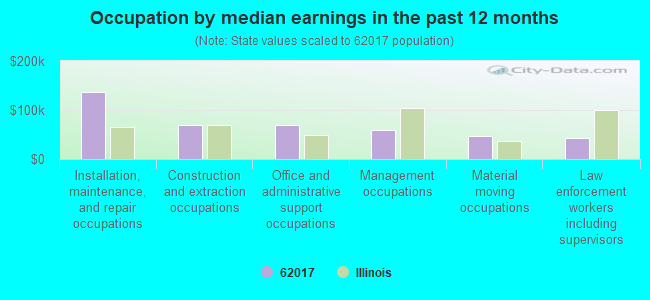
Occupation by median earnings in the past 12 months ($)
136,372Installation, maintenance, and repair occupations
68,996Construction and extraction occupations
68,454Office and administrative support occupations
59,496Management occupations
46,777Material moving occupations
42,879Law enforcement workers including supervisors
Companies with federal contracts located in this zip code:
RACHEL HOWARD (704 BARRY in COFFEEN, IL; small business) : $32,743 in 14 contractsfrom 2003 to 2005
Contracts for Recreation Site Maintenance Services (non-construction), Operation of Government-Owned Facilities -- Recreation Facilities (Non-Building) by U.S. Army Corps of Engineers - civil program financing only, Army Signed by year:2000: $0; 2001: $0; 2002: $0; 2003: $7,700; 2004: $10,600; 2005: $14,443; 2006: $0.
Biggest contracts:
$7,770 with U.S. Army Corps of Engineers - civil program financing only for Recreation Site Maintenance Services (non-construction). Signed on 2003-02-14. Completion date: 2004-02-28.
$7,480 with Army for Recreation Site Maintenance Services (non-construction). Taking place in TX. Signed on 2004-01-15. Completion date: 2004-09-30.
$6,016 with U.S. Army Corps of Engineers - civil program financing only for Operation of Government-Owned Facilities -- Recreation Facilities (Non-Building). Taking place in AR. Signed on 2005-03-23. Completion date: 2005-09-30.
$6,016 with Army for Operation of Government-Owned Facilities -- Recreation Facilities (Non-Building). Taking place in AR. Signed on 2005-03-23. Completion date: 2005-09-30.
Top industries in this zip code by the number of employees in 2005:
Utilities: Electric Power Distribution (100-249 employees: 1 establishment)
Finance and Insurance: Commercial Banking (5-9: 1)
Other Services (except Public Administration): Religious Organizations (1-4: 3)
Construction: Commercial and Institutional Building Construction (1-4: 1)
Administrative and Support and Waste Management and Remediation Services: Septic Tank and Related Services (1-4: 1)
Fatal accident statistics in 2010:
Fatal accident count: 1
Vehicles involved in fatal accidents: 2
Fatal accidents caused by drunken drivers: 0
Fatalities: 1
Persons involved in fatal accidents: 3
Pedestrians involved in fatal accidents: 0
2002 - 2018 National Fire Incident Reporting System (NFIRS) incidents
Based on the data from the years 2002 - 2018 the average number of fires per year is 10. The highest number of reported fire incidents - 26 took place in 2005, and the least - 2 in 2006. The data has a decreasing trend.
When looking into fire subcategories, the most incidents belonged to: Outside Fires (50.0%), and Structure Fires (36.2%).
Fire incident types reported to NFIRS in Zip Code 62017


 Nearest zip codes: 62019, 62032, 62049, 62051, 62089, 62262.


 Based on the data from the years 2002 - 2018 the average number of fires per year is 10. The highest number of reported fire incidents - 26 took place in 2005, and the least - 2 in 2006. The data has a decreasing trend.
 When looking into fire subcategories, the most incidents belonged to: Outside Fires (50.0%), and Structure Fires (36.2%).