Estimated zip code population in 2022: 964 Zip code population in 2010: 1,138 Zip code population in 2000: 962
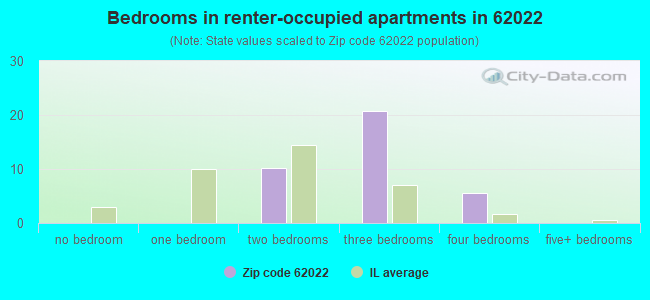
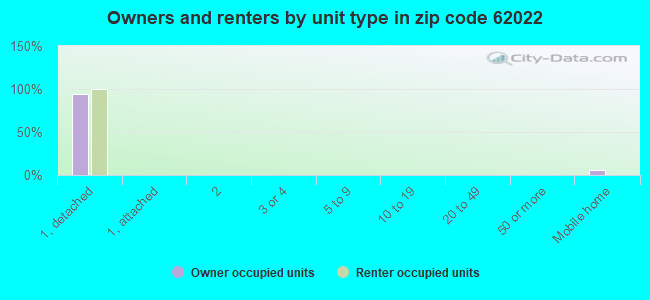
Houses and condos: 400 Renter-occupied apartments: 38
% of renters here:
12%
State:
33%
March 2022 cost of living index in zip code 62022: 92.3 (less than average, U.S. average is 100)
Land area: 18.8 sq. mi. Water area: 0.0 sq. mi.
Population density: 51 people per square mile
(very low).
OSM Map
General Map
Google Map
MSN Map
OSM Map
General Map
Google Map
MSN Map
OSM Map
General Map
Google Map
MSN Map
OSM Map
General Map
Google Map
MSN Map
Please wait while loading the map...
Real estate property taxes paid for housing units in 2022:
This zip code:
1.3% ($3,468)
Illinois:
2.0% ($4,912)
Median real estate property taxes paid for housing units with mortgages in 2022: $6,708 (1.7%) Median real estate property taxes paid for housing units with no mortgage in 2022: $3,105 (1.8%)
Business Search- 14 Million verified businesses
Males: 444
(46.0%)
Females: 520
(54.0%)
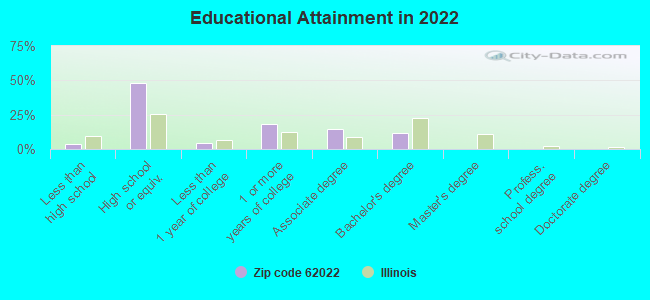
For population 25 years and over in 62022:
High school or higher: 95.7%
Bachelor's degree or higher: 12.0%
Graduate or professional degree: 0.0%
Unemployed: 1.6%
Mean travel time to work (commute): 25.2 minutes
For population 15 years and over in 62022:
Never married: 41.7%
Now married: 35.2%
Separated: 0.0%
Widowed: 10.9%
Divorced: 12.2%
Zip code 62022 compared to state average:
Unemployed percentage significantly below state average.
Black race population percentage significantly below state average.
Hispanic race population percentage significantly below state average.
Foreign-born population percentage significantly below state average.
Renting percentage significantly below state average.
Length of stay since moving in significantly below state average.
Number of college students below state average.
Percentage of population with a bachelor's degree or higher significantly below state average.
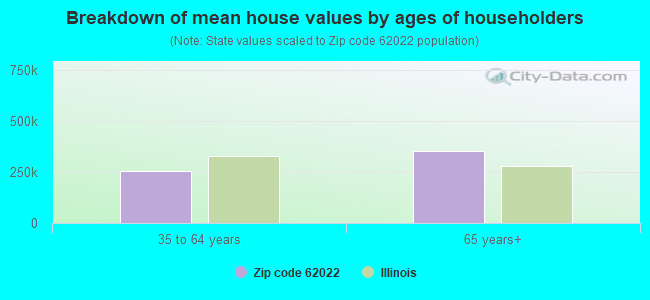
Estimated median house/condo value in 2022: $273,487
62022:
$273,487
Illinois:
$251,600
Median resident age:
This zip code:
38.5 years
Illinois median age:
39.1 years
Average household size:
This zip code:
3.0 people
Illinois:
2.4 people
Averages for the 2020 tax year for zip code 62022, filed in 2021:
Average Adjusted Gross Income (AGI) in 2020: $61,140 (Individual Income Tax Returns)
Here:
$61,140
State:
$82,626
Salary/wage: $55,270 (reported on 74.2% of returns)
Here:
$55,270
State:
$66,640
(% of AGI for various income ranges: 913.1% for AGIs below $25k, 3132.0% for AGIs $25k-50k, 5320.0% for AGIs $50k-75k, 10670.0% for AGIs $75k-100k, 18732.9% for AGIs $100k-200k)
Taxable interest for individuals: $1,170 (reported on 37.1% of returns)
This zip code:
$1,170
Illinois:
$2,376
(% of AGI for various income ranges: 12.3% for AGIs below $25k, 23.0% for AGIs $25k-50k, 20.0% for AGIs $50k-75k, 132.5% for AGIs $75k-100k, 232.9% for AGIs $100k-200k)
Ordinary dividends: $3,000 (reported on 27.4% of returns)
Here:
$3,000
State:
$9,061
(% of AGI for various income ranges: 38.5% for AGIs below $25k, 42.0% for AGIs $25k-50k, 171.4% for AGIs $50k-75k, 97.5% for AGIs $75k-100k, 370.0% for AGIs $100k-200k)
Net capital gain/loss in AGI: +$6,192 (reported on 21.0% of returns)
Here:
+$6,192
State:
+$31,684
(% of AGI for various income ranges: 22.3% for AGIs below $25k, 212.9% for AGIs $50k-75k, 895.7% for AGIs $100k-200k)
Profit/loss from business: +$9,643 (reported on 11.3% of returns)
Here:
+$9,643
State:
+$12,175
(% of AGI for various income ranges: 231.0% for AGIs $25k-50k, 634.3% for AGIs $100k-200k)
Taxable individual retirement arrangement distribution: $16,100 (reported on 14.5% of returns)
62022:
$16,100
Illinois:
$21,613
(% of AGI for various income ranges: 209.2% for AGIs below $25k, 767.1% for AGIs $50k-75k, 914.3% for AGIs $100k-200k)
Total itemized deductions: $26,900 (reported on 3.2% of returns)
Here:
$26,900
State:
$34,948
(% of AGI for various income ranges: 768.6% for AGIs $50k-75k)
Taxes paid: $7,350 (reported on 3.2% of returns)
62022:
$7,350
State:
$8,563
(% of AGI for various income ranges: 210.0% for AGIs $50k-75k)
Earned income credit: $1,800 (reported on 9.7% of returns)
Here:
$1,800
State:
$2,311
(% of AGI for various income ranges: 83.1% for AGIs below $25k)
Percentage of individuals using paid preparers for their 2020 taxes: 95.2%
Here:
95%
State:
93%
(% for various income ranges: 95.0% for AGIs below $25k, 100.0% for AGIs $25k-50k, 90.0% for AGIs $50k-75k, 85.7% for AGIs $75k-100k, 100.0% for AGIs $100k-200k)
Averages for the 2012 tax year for zip code 62022, filed in 2013:
Average Adjusted Gross Income (AGI) in 2012: $50,805 (Individual Income Tax Returns)
Here:
$50,805
State:
$68,058
Salary/wage: $47,030 (reported on 76.7% of returns)
Here:
$47,030
State:
$55,396
(% of AGI for various income ranges: 59.9% for AGIs below $25k, 68.4% for AGIs $25k-50k, 69.7% for AGIs $50k-75k, 66.4% for AGIs $75k-100k, 77.0% for AGIs $100k-200k)
Taxable interest for individuals: $1,112 (reported on 41.7% of returns)
This zip code:
$1,112
Illinois:
$1,969
(% of AGI for various income ranges: 1.5% for AGIs below $25k, 1.6% for AGIs $25k-50k, 1.1% for AGIs $50k-75k, 0.7% for AGIs $75k-100k, 0.5% for AGIs $100k-200k)
Ordinary dividends: $1,600 (reported on 23.3% of returns)
Here:
$1,600
State:
$7,786
(% of AGI for various income ranges: 0.6% for AGIs below $25k, 1.4% for AGIs $25k-50k, 0.7% for AGIs $50k-75k, 0.9% for AGIs $100k-200k)
Net capital gain/loss in AGI: +$456 (reported on 15.0% of returns)
Here:
+$456
State:
+$22,183
(% of AGI for various income ranges: 0.4% for AGIs $100k-200k)
Profit/loss from business: +$8,686 (reported on 11.7% of returns)
Here:
+$8,686
State:
+$12,903
Taxable individual retirement arrangement distribution: $11,278 (reported on 15.0% of returns)
62022:
$11,278
Illinois:
$17,929
Total itemized deductions: $17,388 (20% of AGI, reported on 28.3% of returns)
Here:
$17,388
State:
$26,433
Here:
19.9% of AGI
State:
19.2% of AGI
(% of AGI for various income ranges: 12.4% for AGIs $25k-50k, 9.6% for AGIs $50k-75k, 9.7% for AGIs $75k-100k, 10.7% for AGIs $100k-200k)
Charity contributions: $3,517 (reported on 20.0% of returns)
Here:
$3,517
State:
$4,525
(% of AGI for various income ranges: 1.9% for AGIs $50k-75k, 2.3% for AGIs $75k-100k, 1.5% for AGIs $100k-200k)
Taxes paid: $6,847 (reported on 28.3% of returns)
62022:
$6,847
State:
$11,968
(% of AGI for various income ranges: 2.9% for AGIs $25k-50k, 3.3% for AGIs $50k-75k, 3.8% for AGIs $75k-100k, 5.2% for AGIs $100k-200k)
Earned income credit: $2,129 (reported on 11.7% of returns)
Here:
$2,129
State:
$2,349
(% of AGI for various income ranges: 4.3% for AGIs below $25k, 1.0% for AGIs $25k-50k)
Percentage of individuals using paid preparers for their 2012 taxes: 70.0%
Here:
70%
State:
57%
(% for various income ranges: 66.7% for AGIs below $25k, 69.2% for AGIs $25k-50k, 72.7% for AGIs $50k-75k, 83.3% for AGIs $75k-100k, 66.7% for AGIs $100k-200k)
Averages for the 2004 tax year for zip code 62022, filed in 2005:
Average Adjusted Gross Income (AGI) in 2004: $41,169 (Individual Income Tax Returns)
Here:
$41,169
State:
$54,625
Salary/wage: $36,125 (reported on 85.6% of returns)
Here:
$36,125
State:
$46,811
(% of AGI for various income ranges: 104.9% for AGIs below $10k, 64.2% for AGIs $10k-25k, 76.6% for AGIs $25k-50k, 81.9% for AGIs $50k-75k, 80.3% for AGIs $75k-100k, 58.8% for AGIs over 100k)
Taxable interest for individuals: $1,125 (reported on 49.4% of returns)
This zip code:
$1,125
Illinois:
$2,101
(% of AGI for various income ranges: 0.7% for AGIs below $10k, 4.2% for AGIs $10k-25k, 1.8% for AGIs $25k-50k, 0.9% for AGIs $50k-75k, 1.1% for AGIs $75k-100k, 0.4% for AGIs over 100k)
Taxable dividends: $1,503 (reported on 25.6% of returns)
Here:
$1,503
State:
$4,306
(% of AGI for various income ranges: 0.9% for AGIs below $10k, 1.1% for AGIs $10k-25k, 1.1% for AGIs $25k-50k, 0.4% for AGIs $50k-75k, 1.6% for AGIs $75k-100k, 0.5% for AGIs over 100k)
Net capital gain/loss: +$1,552 (reported on 17.6% of returns)
Here:
+$1,552
State:
+$17,321
(% of AGI for various income ranges: -0.3% for AGIs $10k-25k, 0.1% for AGIs $25k-50k, 0.8% for AGIs $50k-75k, -0.1% for AGIs $75k-100k, 2.6% for AGIs over 100k)
Profit/loss from business: +$5,720 (reported on 13.7% of returns)
Here:
+$5,720
State:
+$11,771
(% of AGI for various income ranges: -4.9% for AGIs below $10k, 5.1% for AGIs $10k-25k, 2.6% for AGIs $25k-50k, 2.2% for AGIs $50k-75k, 1.8% for AGIs $75k-100k)
IRA payment deduction: $3,357 (reported on 2.3% of returns)
62022:
$3,357
Illinois:
$3,087
Total itemized deductions: $14,662 (21% of AGI, reported on 25.3% of returns)
Here:
$14,662
State:
$20,239
Here:
20.7% of AGI
State:
19.5% of AGI
(% of AGI for various income ranges: 3.8% for AGIs $10k-25k, 8.5% for AGIs $25k-50k, 9.6% for AGIs $50k-75k, 9.2% for AGIs $75k-100k, 12.2% for AGIs over 100k)
Charity contributions deductions: $3,271 (4% of AGI, reported on 19.8% of returns)
Here:
$3,271
State:
$3,719
Here:
4.4% of AGI
State:
3.4% of AGI
(% of AGI for various income ranges: 1.6% for AGIs $25k-50k, 1.2% for AGIs $50k-75k, 1.6% for AGIs $75k-100k, 3.1% for AGIs over 100k)
Total tax: $4,998 (reported on 77.7% of returns)
62022:
$4,998
State:
$9,882
(% of AGI for various income ranges: 2.2% for AGIs below $10k, 4.3% for AGIs $10k-25k, 7.3% for AGIs $25k-50k, 8.4% for AGIs $50k-75k, 9.9% for AGIs $75k-100k, 16.3% for AGIs over 100k)
Earned income credit: $1,758 (reported on 11.1% of returns)
Here:
$1,758
State:
$1,788
Percentage of individuals using paid preparers for their 2004 taxes: 69.8%
Here:
70%
State:
61%
(% for various income ranges: 51.2% for AGIs below $10k, 73.6% for AGIs $10k-25k, 64.1% for AGIs $25k-50k, 83.2% for AGIs $50k-75k, 83.3% for AGIs $75k-100k, 86.7% for AGIs over 100k)
Household received Food Stamps/SNAP in the past 12 months: 56 Household did not receive Food Stamps/SNAP in the past 12 months: 271
Women who did not have a birth in the past 12 months: 246 (44 now married, 203 unmarried)
Housing units in zip code 62022 with a mortgage: 118 Median monthly owner costs for units with a mortgage: $2,050 Median monthly owner costs for units without a mortgage: $679
Residents with income below the poverty level in 2022:
This zip code:
8.3%
Whole state:
11.9%
Residents with income below 50% of the poverty level in 2022:
This zip code:
0.8%
Whole state:
5.7%
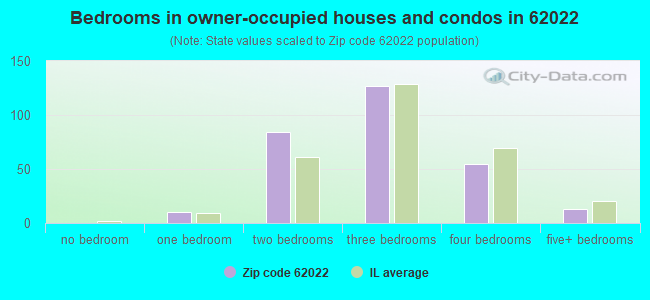
Median number of rooms in houses and condos:
Here:
5.8
State:
6.4
Median number of rooms in apartments:
Here:
5.3
State:
4.1
Notable locations in this zip code not listed on our city pages
Churches in zip code 62022 include: Bethel Church (A), Dow Southern Baptist Church (B), Newbern Cumberland Presbyterian Church (C). Display/hide their locations on the map
Size of family households: 133 2-persons, 29 3-persons, 44 4-persons, 10 5-persons, 12 6-persons
Size of nonfamily households: 54 1-person, 17 2-persons, 25 3-persons
110 married couples with children.
31 single-parent households (6 men, 25 women).
99.4% of residents of 62022 zip code speak English at home.
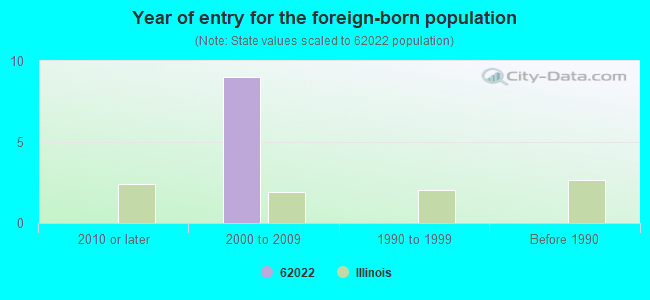
Foreign born population: 10 (1.1%) (0.0% of them are naturalized citizens)
:
1.1%
Whole state:
14.4%
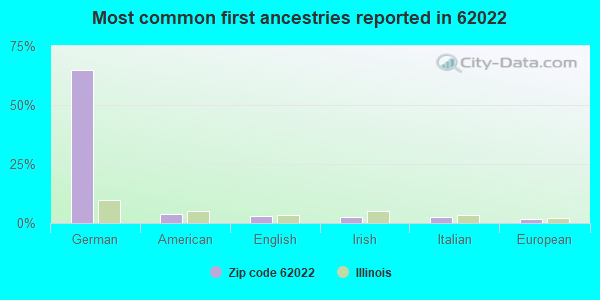
65%German
4%American
3%English
2%Irish
2%Italian
2%European
Year of entry for the foreign-born population
02010 or later
92000 to 2009
01990 to 1999
0Before 1990
Facilities with environmental interests located in this zip code:
AT&T (RR1 in DOW, IL)
STATE MASTER (Illinois EPA Project) - SOLID WASTE PROGRAM, HAZARDOUS WASTE PROGRAM (Resource Conservation and Recovery Act (tracking hazardous waste)) Organizations: AMERICAN TELEPHONE TELEGRAPH (CONTACT/OWNER)
Alternative names: AT&T LONG LINES NEWBERN IL
LOCKHAVEN COUNTRY CLUB (LACKHAVEN ROAD in DOW, IL)
STATE MASTER (Illinois EPA Project) - National Pollutant Discharge Elimination System Permit National Pollutant Discharge Elimination System NON-MAJOR (Tracking pollutant discharge elimination systems) - permit Business SIC classification: MEMBERSHIP SPORTS AND RECREATION CLUBS
RCS LANDFILL (1336 W CRYSTAL LAKE RD in JERSEYVILLE, IL)
CRITERIA AND HAZARDOUS AIR POLLUTANT INVENTORY (Inventory of air pollution sources) Business SIC classification: REFUSE SYSTEMS
Housing units lacking complete plumbing facilities: 1.6% Housing units lacking complete kitchen facilities: 1.6%
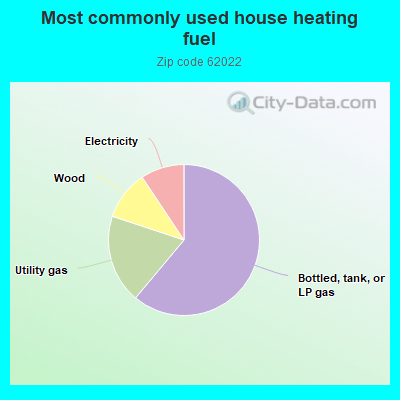
61.4%Bottled, tank, or LP gas
19.1%Utility gas
10.6%Wood
9.4%Electricity
Population in 1990: 1,758.
Place of birth for U.S.-born residents:
This state: 830
Northeast: 3
Midwest: 84
South: 7
West: 25
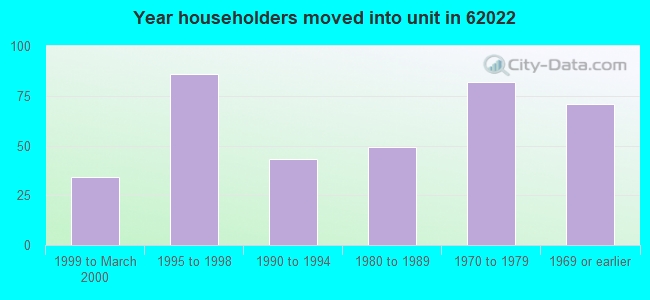
66% of the 62022 zip code residents lived in the same house 5 years ago. Out of people who lived in different houses, 42% lived in this county. Out of people who lived in different counties, 50% lived in Illinois.
98% of the 62022 zip code residents lived in the same house 1 year ago. Out of people who lived in different houses, 47% moved from this county. Out of people who lived in different houses, 53% moved from different state.
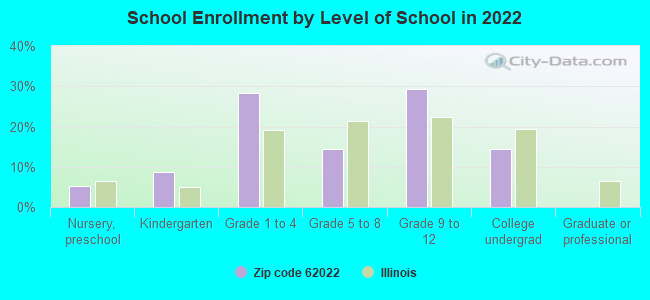
Private vs. public school enrollment:
Students in private schools in grades 1 to 8 (elementary and middle school): 46
Here:
53.7%
Illinois:
13.3%
Students in private schools in grades 9 to 12 (high school):
Here:
0.0%
Illinois:
9.9%
Students in private undergraduate colleges:
Here:
0.0%
Illinois:
27.4%
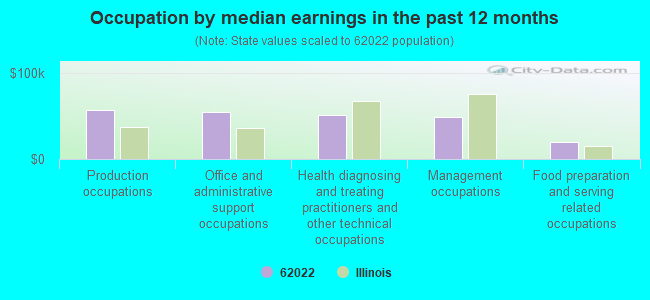
Occupation by median earnings in the past 12 months ($)
56,810Production occupations
54,275Office and administrative support occupations
51,760Health diagnosing and treating practitioners and other technical occupations
48,878Management occupations
19,384Food preparation and serving related occupations
Companies with federal contracts located in this zip code:
BESCO, INC (RR 1 BOX 115 in DOW, IL; small business)
$33,365 with Air Force for Photographic Projection Equipment. Signed on 2001-09-28. Completion date: 2001-11-12.
MATHIS, WILLIAM AND MAYME (26483 ELSAH HILLS DR in DOW, IL; small business)
$5,110 with U.S. Army Corps of Engineers - civil program financing only for Operation of Government-Owned Facilities -- Recreation Facilities (Non-Building). Signed on 2003-04-04. Completion date: 2003-04-01.
Top industries in this zip code by the number of employees in 2005:
Construction: Plumbing, Heating, and Air-Conditioning Contractors (1-4: 2)
Other Services (except Public Administration): Reupholstery and Furniture Repair (1-4: 1)
Accommodation and Food Services: Drinking Places (Alcoholic Beverages) (1-4: 1)
Fatal accident statistics in 2014:
Fatal accident count: 1
Vehicles involved in fatal accidents: 1
Fatal accidents caused by drunken drivers: 0
Fatalities: 1
Persons involved in fatal accidents: 2
Pedestrians involved in fatal accidents: 0
2003 - 2018 National Fire Incident Reporting System (NFIRS) incidents
Based on the data from the years 2003 - 2018 the average number of fires per year is 7. The highest number of reported fire incidents - 19 took place in 2014, and the least - 0 in 2006. The data has an increasing trend.
When looking into fire subcategories, the most incidents belonged to: Structure Fires (48.6%), and Outside Fires (41.9%).
Fire incident types reported to NFIRS in Zip Code 62022

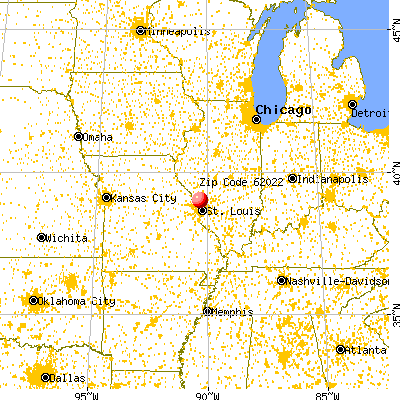


 Nearest zip codes: 62028, 62035, 63373, 62052, 62037, 63034.
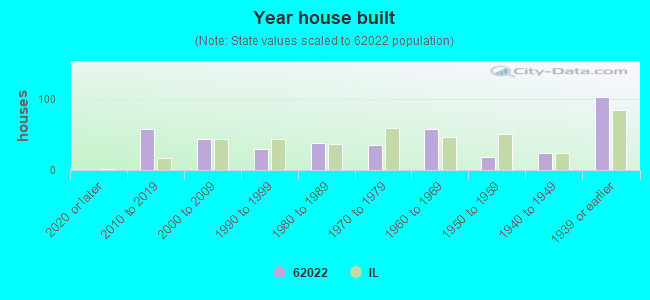


 Based on the data from the years 2003 - 2018 the average number of fires per year is 7. The highest number of reported fire incidents - 19 took place in 2014, and the least - 0 in 2006. The data has an increasing trend.
 When looking into fire subcategories, the most incidents belonged to: Structure Fires (48.6%), and Outside Fires (41.9%).