Estimated zip code population in 2022: 19,103 Zip code population in 2010: 17,761 Zip code population in 2000: 16,803
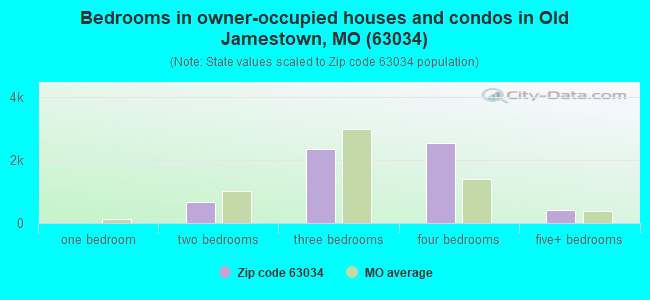
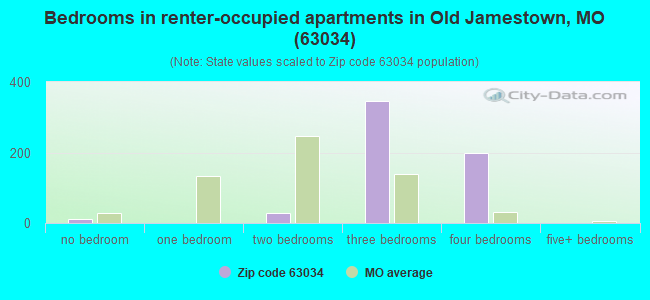
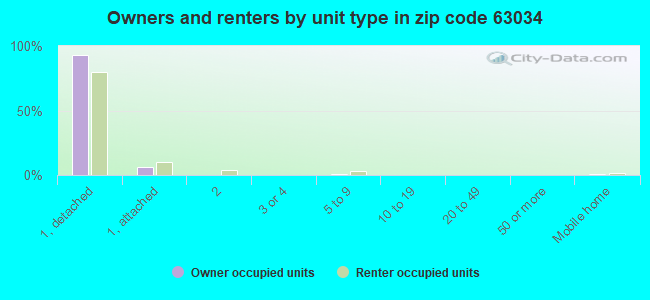
Houses and condos: 6,776 Renter-occupied apartments: 589
% of renters here:
9%
State:
32%
March 2022 cost of living index in zip code 63034: 97.9 (near average, U.S. average is 100)
Land area: 18.7 sq. mi. Water area: 2.3 sq. mi.
Population density: 1,020 people per square mile
(low).
OSM Map
General Map
Google Map
MSN Map
OSM Map
General Map
Google Map
MSN Map
OSM Map
General Map
Google Map
MSN Map
OSM Map
General Map
Google Map
MSN Map
Please wait while loading the map...
Real estate property taxes paid for housing units in 2022:
This zip code:
1.4% ($3,481)
Missouri:
0.8% ($1,810)
Median real estate property taxes paid for housing units with mortgages in 2022: $3,632 (1.5%) Median real estate property taxes paid for housing units with no mortgage in 2022: $2,901 (1.3%)
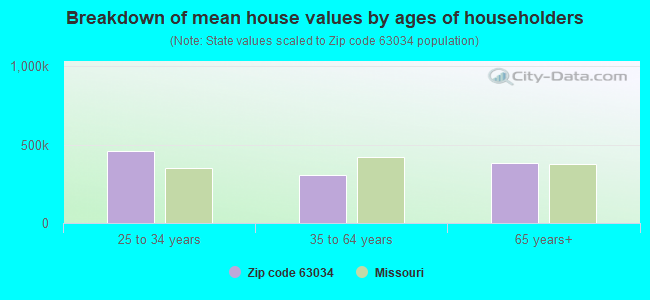
Estimated median house/condo value in 2022: $243,165
63034:
$243,165
Missouri:
$221,200
According to our research of Missouri and other state lists, there were 30 registered sex offenders living in 63034 zip code as of April 27, 2024. The ratio of all residents to sex offenders in zip code 63034 is 603 to 1. The ratio of registered sex offenders to all residents in this zip code is lower than the state average.
Median resident age:
This zip code:
42.2 years
Missouri median age:
39.1 years
Average household size:
This zip code:
2.9 people
Missouri:
2.4 people
Averages for the 2020 tax year for zip code 63034, filed in 2021:
Average Adjusted Gross Income (AGI) in 2020: $64,158 (Individual Income Tax Returns)
Here:
$64,158
State:
$68,151
Salary/wage: $55,915 (reported on 81.3% of returns)
Here:
$55,915
State:
$56,131
(% of AGI for various income ranges: 1261.0% for AGIs below $25k, 3926.1% for AGIs $25k-50k, 6978.6% for AGIs $50k-75k, 9934.2% for AGIs $75k-100k, 19829.2% for AGIs $100k-200k, 67767.8% for AGIs over 200k)
Taxable interest for individuals: $1,041 (reported on 25.8% of returns)
This zip code:
$1,041
Missouri:
$1,586
(% of AGI for various income ranges: 8.9% for AGIs below $25k, 13.5% for AGIs $25k-50k, 27.6% for AGIs $50k-75k, 43.1% for AGIs $75k-100k, 127.0% for AGIs $100k-200k, 756.7% for AGIs over 200k)
Ordinary dividends: $4,813 (reported on 16.9% of returns)
Here:
$4,813
State:
$10,947
(% of AGI for various income ranges: 15.7% for AGIs below $25k, 32.7% for AGIs $25k-50k, 79.7% for AGIs $50k-75k, 150.9% for AGIs $75k-100k, 265.8% for AGIs $100k-200k, 3690.0% for AGIs over 200k)
Net capital gain/loss in AGI: +$10,105 (reported on 13.1% of returns)
Here:
+$10,105
State:
+$18,453
(% of AGI for various income ranges: 5.1% for AGIs below $25k, 17.1% for AGIs $25k-50k, 66.6% for AGIs $50k-75k, 77.7% for AGIs $75k-100k, 362.1% for AGIs $100k-200k, 9776.7% for AGIs over 200k)
Profit/loss from business: +$1,544 (reported on 18.6% of returns)
Here:
+$1,544
State:
+$12,260
(% of AGI for various income ranges: 27.3% for AGIs $50k-75k, 153.7% for AGIs $75k-100k, 151.4% for AGIs $100k-200k, 3371.1% for AGIs over 200k)
Taxable individual retirement arrangement distribution: $19,825 (reported on 10.1% of returns)
63034:
$19,825
Missouri:
$19,719
(% of AGI for various income ranges: 40.5% for AGIs below $25k, 93.5% for AGIs $25k-50k, 262.3% for AGIs $50k-75k, 489.1% for AGIs $75k-100k, 1015.4% for AGIs $100k-200k, 3895.6% for AGIs over 200k)
Total itemized deductions: $29,024 (reported on 16.6% of returns)
Here:
$29,024
State:
$36,651
(% of AGI for various income ranges: 85.2% for AGIs below $25k, 301.7% for AGIs $25k-50k, 840.5% for AGIs $50k-75k, 1291.1% for AGIs $75k-100k, 2062.9% for AGIs $100k-200k, 8292.2% for AGIs over 200k)
Charity contributions: $10,310 (reported on 14.7% of returns)
Here:
$10,310
State:
$15,671
(% of AGI for various income ranges: 8.5% for AGIs below $25k, 68.4% for AGIs $25k-50k, 213.8% for AGIs $50k-75k, 357.1% for AGIs $75k-100k, 751.6% for AGIs $100k-200k, 3554.4% for AGIs over 200k)
Taxes paid: $7,369 (reported on 16.6% of returns)
63034:
$7,369
State:
$7,608
(% of AGI for various income ranges: 12.7% for AGIs below $25k, 68.2% for AGIs $25k-50k, 205.4% for AGIs $50k-75k, 368.0% for AGIs $75k-100k, 604.4% for AGIs $100k-200k, 1585.6% for AGIs over 200k)
Earned income credit: $2,295 (reported on 14.7% of returns)
Here:
$2,295
State:
$2,315
(% of AGI for various income ranges: 96.7% for AGIs below $25k, 67.6% for AGIs $25k-50k)
Percentage of individuals using paid preparers for their 2020 taxes: 88.6%
Here:
89%
State:
93%
(% for various income ranges: 90.1% for AGIs below $25k, 89.8% for AGIs $25k-50k, 87.5% for AGIs $50k-75k, 86.1% for AGIs $75k-100k, 86.7% for AGIs $100k-200k, 90.3% for AGIs over 200k)
Averages for the 2012 tax year for zip code 63034, filed in 2013:
Average Adjusted Gross Income (AGI) in 2012: $62,430 (Individual Income Tax Returns)
Here:
$62,430
State:
$55,896
Salary/wage: $53,816 (reported on 84.1% of returns)
Here:
$53,816
State:
$46,205
(% of AGI for various income ranges: 73.7% for AGIs below $25k, 74.1% for AGIs $25k-50k, 72.4% for AGIs $50k-75k, 72.9% for AGIs $75k-100k, 77.7% for AGIs $100k-200k, 55.6% for AGIs over 200k)
Taxable interest for individuals: $1,337 (reported on 34.4% of returns)
This zip code:
$1,337
Missouri:
$1,559
(% of AGI for various income ranges: 1.3% for AGIs below $25k, 0.6% for AGIs $25k-50k, 0.6% for AGIs $50k-75k, 0.6% for AGIs $75k-100k, 0.5% for AGIs $100k-200k, 1.5% for AGIs over 200k)
Ordinary dividends: $3,732 (reported on 23.3% of returns)
Here:
$3,732
State:
$7,410
(% of AGI for various income ranges: 1.8% for AGIs below $25k, 1.0% for AGIs $25k-50k, 1.1% for AGIs $50k-75k, 1.0% for AGIs $75k-100k, 1.0% for AGIs $100k-200k, 3.6% for AGIs over 200k)
Net capital gain/loss in AGI: +$4,032 (reported on 14.5% of returns)
Here:
+$4,032
State:
+$11,579
(% of AGI for various income ranges: 0.2% for AGIs $50k-75k, 0.4% for AGIs $75k-100k, 0.5% for AGIs $100k-200k, 5.0% for AGIs over 200k)
Profit/loss from business: +$7,161 (reported on 14.4% of returns)
Here:
+$7,161
State:
+$11,688
(% of AGI for various income ranges: 6.0% for AGIs below $25k, 1.4% for AGIs $25k-50k, 1.0% for AGIs $50k-75k, 1.2% for AGIs $75k-100k, 1.4% for AGIs $100k-200k, 1.9% for AGIs over 200k)
Taxable individual retirement arrangement distribution: $15,414 (reported on 13.3% of returns)
63034:
$15,414
Missouri:
$14,773
(% of AGI for various income ranges: 3.7% for AGIs below $25k, 3.8% for AGIs $25k-50k, 3.1% for AGIs $50k-75k, 3.2% for AGIs $75k-100k, 3.2% for AGIs $100k-200k, 3.3% for AGIs over 200k)
Self-employment retirement plans: $8,933 (reported on 0.3% of returns)
63034:
$8,933
Missouri:
$20,502
Total itemized deductions: $21,710 (24% of AGI, reported on 52.6% of returns)
Here:
$21,710
State:
$22,730
Here:
23.5% of AGI
State:
19.2% of AGI
(% of AGI for various income ranges: 15.3% for AGIs below $25k, 20.0% for AGIs $25k-50k, 21.3% for AGIs $50k-75k, 19.5% for AGIs $75k-100k, 17.8% for AGIs $100k-200k, 14.4% for AGIs over 200k)
Charity contributions: $4,792 (reported on 46.0% of returns)
Here:
$4,792
State:
$4,745
(% of AGI for various income ranges: 1.7% for AGIs below $25k, 3.0% for AGIs $25k-50k, 3.8% for AGIs $50k-75k, 3.6% for AGIs $75k-100k, 3.9% for AGIs $100k-200k, 3.5% for AGIs over 200k)
Taxes paid: $7,717 (reported on 52.5% of returns)
63034:
$7,717
State:
$8,399
(% of AGI for various income ranges: 4.0% for AGIs below $25k, 5.5% for AGIs $25k-50k, 6.6% for AGIs $50k-75k, 6.6% for AGIs $75k-100k, 6.9% for AGIs $100k-200k, 7.0% for AGIs over 200k)
Earned income credit: $2,212 (reported on 13.0% of returns)
Here:
$2,212
State:
$2,288
(% of AGI for various income ranges: 5.8% for AGIs below $25k, 0.9% for AGIs $25k-50k)
Percentage of individuals using paid preparers for their 2012 taxes: 45.1%
Here:
45%
State:
55%
(% for various income ranges: 38.1% for AGIs below $25k, 44.1% for AGIs $25k-50k, 50.0% for AGIs $50k-75k, 52.3% for AGIs $75k-100k, 47.5% for AGIs $100k-200k, 63.6% for AGIs over 200k)
Averages for the 2004 tax year for zip code 63034, filed in 2005:
Average Adjusted Gross Income (AGI) in 2004: $57,137 (Individual Income Tax Returns)
Here:
$57,137
State:
$44,591
Salary/wage: $51,249 (reported on 86.6% of returns)
Here:
$51,249
State:
$38,941
(% of AGI for various income ranges: 111.1% for AGIs below $10k, 71.7% for AGIs $10k-25k, 76.3% for AGIs $25k-50k, 78.6% for AGIs $50k-75k, 84.7% for AGIs $75k-100k, 74.0% for AGIs over 100k)
Taxable interest for individuals: $1,399 (reported on 51.3% of returns)
This zip code:
$1,399
Missouri:
$1,801
(% of AGI for various income ranges: 5.3% for AGIs below $10k, 3.2% for AGIs $10k-25k, 1.7% for AGIs $25k-50k, 1.1% for AGIs $50k-75k, 0.8% for AGIs $75k-100k, 1.1% for AGIs over 100k)
Taxable dividends: $2,348 (reported on 33.9% of returns)
Here:
$2,348
State:
$3,677
(% of AGI for various income ranges: 3.4% for AGIs below $10k, 2.4% for AGIs $10k-25k, 1.4% for AGIs $25k-50k, 1.3% for AGIs $50k-75k, 0.8% for AGIs $75k-100k, 1.5% for AGIs over 100k)
Net capital gain/loss: +$4,101 (reported on 24.0% of returns)
Here:
+$4,101
State:
+$8,915
(% of AGI for various income ranges: -0.6% for AGIs below $10k, -0.3% for AGIs $10k-25k, 0.3% for AGIs $25k-50k, 0.8% for AGIs $50k-75k, 0.6% for AGIs $75k-100k, 3.4% for AGIs over 100k)
Profit/loss from business: +$4,662 (reported on 13.4% of returns)
Here:
+$4,662
State:
+$9,793
(% of AGI for various income ranges: 1.2% for AGIs below $10k, 3.3% for AGIs $10k-25k, 1.8% for AGIs $25k-50k, 1.2% for AGIs $50k-75k, 1.0% for AGIs $75k-100k, 0.6% for AGIs over 100k)
Profit/loss from farming: +$40 (reported on 0.3% of returns)
Here:
+$40
State:
-$5,056
IRA payment deduction: $2,932 (reported on 2.7% of returns)
63034:
$2,932
Missouri:
$2,972
(% of AGI for various income ranges: 0.2% for AGIs $10k-25k, 0.2% for AGIs $25k-50k, 0.2% for AGIs $50k-75k, 0.1% for AGIs $75k-100k, 0.1% for AGIs over 100k)
Self-employed pension: $15,102 (reported on 0.6% of returns)
Here:
$15,102
Missouri:
$14,365
Total itemized deductions: $19,636 (23% of AGI, reported on 56.2% of returns)
Here:
$19,636
State:
$18,261
Here:
23.5% of AGI
State:
20.5% of AGI
(% of AGI for various income ranges: 11.9% for AGIs below $10k, 18.1% for AGIs $10k-25k, 22.6% for AGIs $25k-50k, 22.0% for AGIs $50k-75k, 20.3% for AGIs $75k-100k, 17.0% for AGIs over 100k)
Charity contributions deductions: $3,927 (5% of AGI, reported on 52.4% of returns)
Here:
$3,927
State:
$3,665
Here:
4.6% of AGI
State:
3.9% of AGI
(% of AGI for various income ranges: 1.1% for AGIs below $10k, 2.4% for AGIs $10k-25k, 3.5% for AGIs $25k-50k, 3.9% for AGIs $50k-75k, 4.0% for AGIs $75k-100k, 3.5% for AGIs over 100k)
Total tax: $7,895 (reported on 80.7% of returns)
63034:
$7,895
State:
$6,999
(% of AGI for various income ranges: 2.8% for AGIs below $10k, 4.3% for AGIs $10k-25k, 6.6% for AGIs $25k-50k, 8.5% for AGIs $50k-75k, 9.6% for AGIs $75k-100k, 15.5% for AGIs over 100k)
Earned income credit: $1,713 (reported on 7.6% of returns)
Here:
$1,713
State:
$1,728
Percentage of individuals using paid preparers for their 2004 taxes: 52.3%
Here:
52%
State:
62%
(% for various income ranges: 40.1% for AGIs below $10k, 51.7% for AGIs $10k-25k, 59.2% for AGIs $25k-50k, 57.5% for AGIs $50k-75k, 50.9% for AGIs $75k-100k, 53.6% for AGIs over 100k)
Likely homosexual households (counted as self-reported same-sex unmarried-partner households)
Lesbian couples: 0.3% of all households
Gay men: 0.0% of all households
Household received Food Stamps/SNAP in the past 12 months: 371 Household did not receive Food Stamps/SNAP in the past 12 months: 6,172
Women who had a birth in the past 12 months: 65 (63 now married, 0 unmarried) Women who did not have a birth in the past 12 months: 3,794 (1,603 now married, 2,191 unmarried)
Housing units in zip code 63034 with a mortgage: 4,337 (345 second mortgage, 5 home equity loan, 168 both second mortgage and home equity loan) Houses without a mortgage: 48
Median monthly owner costs for units with a mortgage: $1,762 Median monthly owner costs for units without a mortgage: $644
Residents with income below the poverty level in 2022:
This zip code:
5.6%
Whole state:
13.2%
Residents with income below 50% of the poverty level in 2022:
This zip code:
2.7%
Whole state:
6.8%
Median number of rooms in houses and condos:
Here:
7.3
State:
6.4
Median number of rooms in apartments:
Here:
6.7
State:
4.4
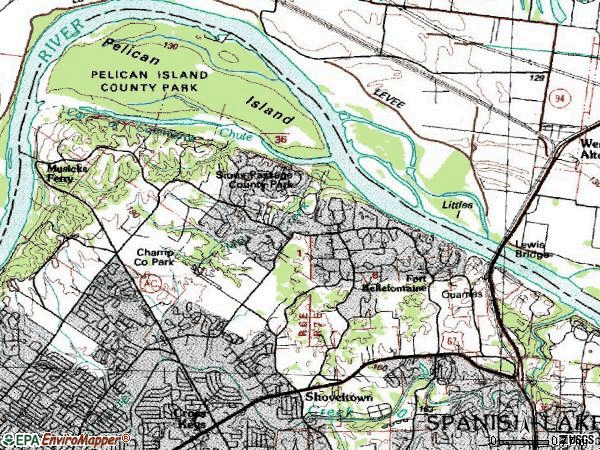
Notable locations in this zip code not listed on our city pages
Notable locations in zip code 63034: Black Jack Fire Protection District Station 3 Headquarters (A), Black Jack Fire Protection District Station 2 (B). Display/hide their locations on the map
In group quarters: 118 (-1 institutionalized population)
Size of family households: 2,218 2-persons, 734 3-persons, 1,034 4-persons, 548 5-persons, 139 6-persons, 152 7-or-more-persons
Size of nonfamily households: 1,516 1-person, 93 2-persons, 89 4-persons
2,649 married couples with children.
787 single-parent households (79 men, 708 women).
94.0% of residents of 63034 zip code speak English at home.
1.4% of residents speak Spanish at home (55% very well, 20% well, 26% not well).
1.0% of residents speak other Indo-European language at home (56% very well, 44% well).
2.1% of residents speak Asian or Pacific Island language at home (55% very well, 11% well, 30% not well, 4% not at all).
1.3% of residents speak other language at home (86% very well, 14% well).
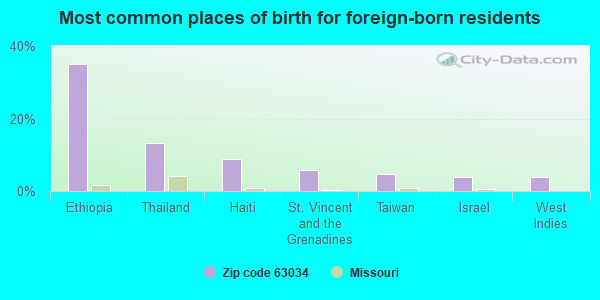
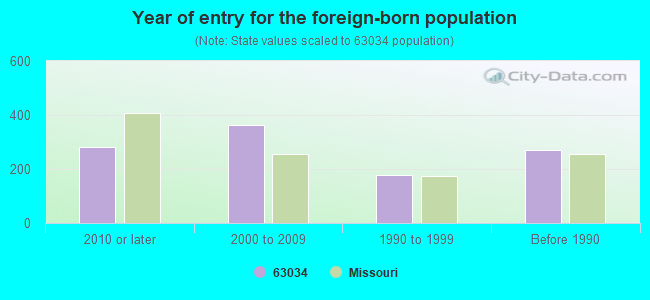
Foreign born population: 917 (4.8%) (62.4% of them are naturalized citizens)
Major facilities with environmental interests located in this zip code:
HENRY CAMPBELL (1106 GOLD CUP CT in FLORISSANT, MO)
(Integrated Compliance Information System) - ICIS-07-2001-0125, FORMAL ENFORCEMENT ACTION STATE MASTER (Missouri monitoring and compilance) - ICIS-2854, ENFORCEMENT/COMPLIANCE ACTIVITY
BRITISH BUTLER DRY CLEANERS (3823 VAILE AVE in FLORISSANT, MO)
AIR MINOR (AIRS/AFS) STATE MASTER (Missouri monitoring and compilance) - RCRAINFO-MOD985806975, CESQG CRITERIA AND HAZARDOUS AIR POLLUTANT INVENTORY (Inventory of air pollution sources) Conditionally Exempt Small Quantity Generators, less than 100 kg/month of hazardous waste (Resource Conservation and Recovery Act (tracking hazardous waste)) - notification Business SIC classification: DRYCLEANING PLANTS, EXCEPT RUG CLEANING Organizations: YONG-JIN YI (CONTACT/OWNER)
Alternative names: BRITISH BUTLER CLEANERS, BRITISH BUTLER CLEANERS-FLORISSANT
BELLEFONTAINE QUARRY (14201 LEWIS & CLARK BOULEVARD in FLORISSANT, MO)
AIR MAJOR (AIRS/AFS) STATE MASTER (Missouri monitoring and compilance) - NET-291891191, AIR PROGRAM, AIRS/AFS-MO0822961, AIR MAJOR, AIRS/AFS-MO0915257, AIR MINOR, PCS-MOG490134, NPDES NON-MAJOR National Pollutant Discharge Elimination System NON-MAJOR (Tracking pollutant discharge elimination systems) - permit Business SIC classification: CRUSHED AND BROKEN LIMESTONE Organizations: KNOX COUNTY STONE COMPANY (CONTACT/OWNER)
Alternative names: J H BERRA CONSTRUCTION CO, KNOX COUNTY STONE CO, INC
AFSHARI ESTATES SUB HMOWN (12 SHAMBLIN DRIVE in FLORISSANT, MO)
STATE MASTER (Missouri monitoring and compilance) - PCS-MO0040363, NPDES NON-MAJOR National Pollutant Discharge Elimination System NON-MAJOR (Tracking pollutant discharge elimination systems) - permit Business SIC classification: SEWERAGE SYSTEMS Alternative names: AFSHARI EST SUBD HOMOWNS, AFSHARI ESTATES, PLAT #3, BILL YEAGER
PACE CONSTRUCTION COMPANY (14201 LEWIS & CLARK ROAD in FLORISSANT, MO)
STATE MASTER (Missouri monitoring and compilance) - PCS-MOG490910, NPDES NON-MAJOR National Pollutant Discharge Elimination System NON-MAJOR (Tracking pollutant discharge elimination systems) - permit Business SIC classification: CRUSHED AND BROKEN LIMESTONE; ASPHALT PAVING MIXTURES AND BLOCKS Alternative names: PACE-FORT BELLE PLANT
HERMANS FARM ORCHARD (3912 SHACKELFORD ROAD in FLORISSANT, MO)
STATE MASTER (Missouri monitoring and compilance) - PCS-MOR105597, NPDES NON-MAJOR National Pollutant Discharge Elimination System NON-MAJOR (Tracking pollutant discharge elimination systems) - permit Business SIC classification: HEAVY CONSTRUCTION Organizations: MCBRIDE & SON HOMES INC (CONTACT/OWNER)
Alternative names: HERMANS ORCHARD, MCBRIDE & SON HOMES, INC
FIVE-J FAMILY LTD PARTNER (NEW HALLS FERRY RD & in FLORISSANT, MO)
STATE MASTER (Missouri monitoring and compilance) - PCS-MOG970019, NPDES NON-MAJOR National Pollutant Discharge Elimination System NON-MAJOR (Tracking pollutant discharge elimination systems) - permit Business SIC classification: FERTILIZERS, MIXING ONLY Alternative names: FIVE-J FAMILY LIMITED, NEW HALLS FERRY COMPOST
BK&R ENTERPRISES (6600 NEW JAMESTOWN ROAD in FLORISSANT, MO)
AIR MINOR (AIRS/AFS) STATE MASTER (Missouri monitoring and compilance) - AIRS/AFS-MO0954923, AIR MINOR Business SIC classification: PLUMBING, HEATING AND AIR-CONDITIONING
HALLS FERRY LANDFILL (HALLS FERRY AND DOUGLAS ROADS in FLORISSANT, MO)
AIR MINOR (AIRS/AFS) STATE MASTER (Missouri monitoring and compilance) - AIRS/AFS-MO0888703, AIR MINOR Business SIC classification: REFUSE SYSTEMS
PACE CONSTRUCTION (14202 LEWIS & CLARK BOULEVARD in FLORISSANT, MO)
STATE MASTER (Missouri monitoring and compilance) - RCRAINFO-MOD985808310, USED OIL PROGRAM USED OIL PROGRAM (Resource Conservation and Recovery Act (tracking hazardous waste)) Organizations: PACE CONSTRUCTION CO (CONTACT/OWNER)
Alternative names: PACE CONSTRUCTION CO FORT BELLE PLT
BARRINGTON ELEM. (15600 OLD HALLS FERRY RD in FLORISSANT, MO)
(National Center for Education Statistics) - STATE ID-4040096088 Organizations: HAZELWOOD (SCHOOL DISTRICT)
PACE CONSTRUCTION (11222 LEWIS AND CLARK BOULEVAR in FLORISSANT, MO)
STATE MASTER (Missouri monitoring and compilance) - NET-291890306, AIR PROGRAM, TRIS-63034PCCNSRTE36, TRI REPORTER, AIRS/AFS-MO0915228, AIR MINOR TRI REPORTER (Tracking of toxic chemicals releasing facilities) Business SIC classification: ASPHALT PAVING MIXTURES AND BLOCKS Alternative names: PACE CONSTRUCTION CO. FORT BELLE PLANT
Housing units lacking complete plumbing facilities: 0.5% Housing units lacking complete kitchen facilities: 1.5%
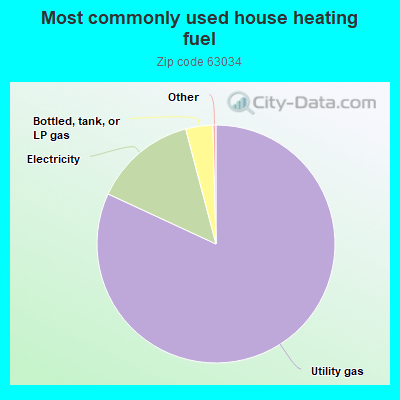
82.0%Utility gas
14.0%Electricity
3.7%Bottled, tank, or LP gas
Population in 1990: 13,972. Population change in the 1990s: +2,831 (+20.3%).
Place of birth for U.S.-born residents:
This state: 14,115
Northeast: 415
Midwest: 1,511
South: 1,571
West: 323
67% of the 63034 zip code residents lived in the same house 5 years ago. Out of people who lived in different houses, 70% lived in this county. Out of people who lived in different counties, 50% lived in Missouri.
92% of the 63034 zip code residents lived in the same house 1 year ago. Out of people who lived in different houses, 57% moved from this county. Out of people who lived in different houses, 28% moved from different county within same state. Out of people who lived in different houses, 12% moved from different state. Out of people who lived in different houses, 3% moved from abroad.
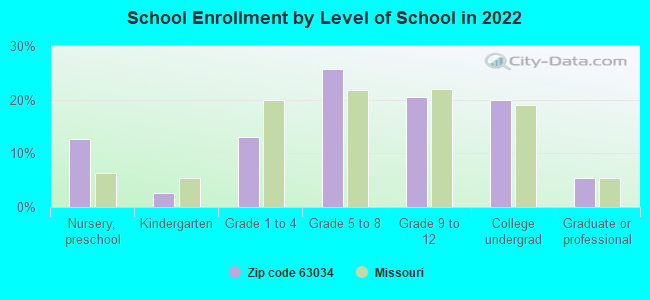
Private vs. public school enrollment:
Students in private schools in grades 1 to 8 (elementary and middle school): 524
Here:
25.4%
Missouri:
15.4%
Students in private schools in grades 9 to 12 (high school): 417
Here:
37.7%
Missouri:
13.9%
Students in private undergraduate colleges: 230
Here:
22.0%
Missouri:
22.6%
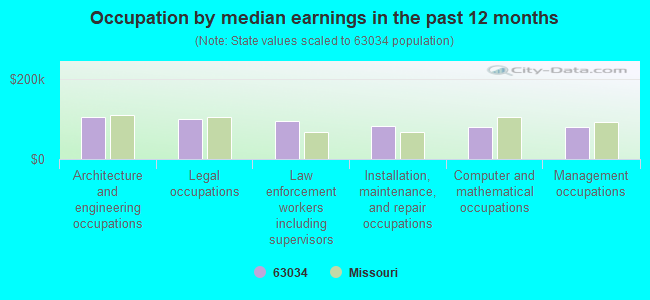
Occupation by median earnings in the past 12 months ($)
104,794Architecture and engineering occupations
99,493Legal occupations
96,283Law enforcement workers including supervisors
83,384Installation, maintenance, and repair occupations
81,253Computer and mathematical occupations
81,143Management occupations
Top industries in this zip code by the number of employees in 2005:
2002 - 2018 National Fire Incident Reporting System (NFIRS) incidents
According to the data from the years 2002 - 2018 the average number of fire incidents per year is 39. The highest number of reported fires - 69 took place in 2006, and the least - 11 in 2015. The data has a decreasing trend.
When looking into fire subcategories, the most reports belonged to: Structure Fires (46.7%), and Outside Fires (31.2%).
Fire incident types reported to NFIRS in Zip Code 63034


+$40
-$5,056
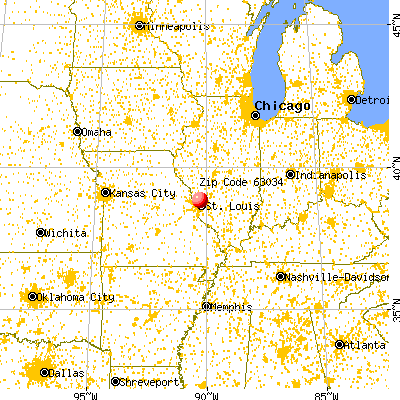
 Nearest zip codes: 63033, 63386, 63031, 63135, 63138, 63136.
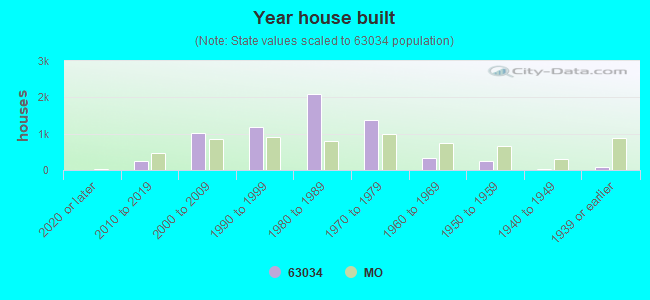


 According to the data from the years 2002 - 2018 the average number of fire incidents per year is 39. The highest number of reported fires - 69 took place in 2006, and the least - 11 in 2015. The data has a decreasing trend.
 When looking into fire subcategories, the most reports belonged to: Structure Fires (46.7%), and Outside Fires (31.2%).