Estimated zip code population in 2022: 41,193 Zip code population in 2010: 43,000 Zip code population in 2000: 45,574
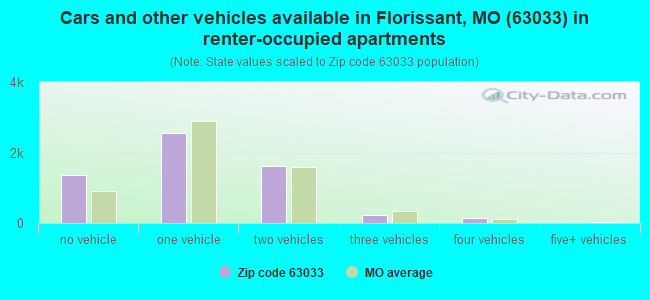
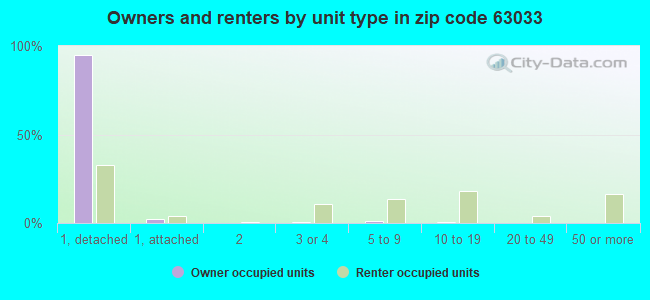
Houses and condos: 18,198 Renter-occupied apartments: 5,848
% of renters here:
35%
State:
32%
March 2022 cost of living index in zip code 63033: 95.3 (near average, U.S. average is 100)
Land area: 12.4 sq. mi. Water area: 0.0 sq. mi.
Population density: 3,333 people per square mile
(average).
OSM Map
General Map
Google Map
MSN Map
OSM Map
General Map
Google Map
MSN Map
OSM Map
General Map
Google Map
MSN Map
OSM Map
General Map
Google Map
MSN Map
Please wait while loading the map...
Real estate property taxes paid for housing units in 2022:
This zip code:
1.3% ($2,137)
Missouri:
0.8% ($1,810)
Median real estate property taxes paid for housing units with mortgages in 2022: $2,095 (1.3%) Median real estate property taxes paid for housing units with no mortgage in 2022: $2,237 (1.4%)
Estimated median house/condo value in 2022: $162,295
63033:
$162,295
Missouri:
$221,200
According to our research of Missouri and other state lists, there were 91 registered sex offenders living in 63033 zip code as of April 27, 2024. The ratio of all residents to sex offenders in zip code 63033 is 473 to 1. The ratio of registered sex offenders to all residents in this zip code is lower than the state average.
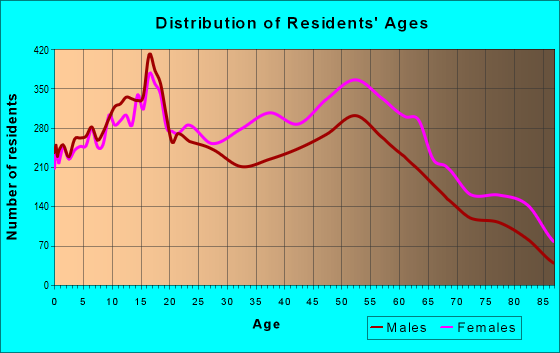
Median resident age:
This zip code:
37.8 years
Missouri median age:
39.1 years
Average household size:
This zip code:
2.4 people
Missouri:
2.4 people
Averages for the 2020 tax year for zip code 63033, filed in 2021:
Average Adjusted Gross Income (AGI) in 2020: $42,648 (Individual Income Tax Returns)
Here:
$42,648
State:
$68,151
Salary/wage: $39,126 (reported on 83.6% of returns)
Here:
$39,126
State:
$56,131
(% of AGI for various income ranges: 1296.7% for AGIs below $25k, 3894.7% for AGIs $25k-50k, 7025.1% for AGIs $50k-75k, 10045.6% for AGIs $75k-100k, 17294.5% for AGIs $100k-200k, 49860.0% for AGIs over 200k)
Taxable interest for individuals: $738 (reported on 17.0% of returns)
This zip code:
$738
Missouri:
$1,586
(% of AGI for various income ranges: 5.6% for AGIs below $25k, 8.5% for AGIs $25k-50k, 25.4% for AGIs $50k-75k, 44.4% for AGIs $75k-100k, 95.7% for AGIs $100k-200k, 262.5% for AGIs over 200k)
Ordinary dividends: $3,201 (reported on 9.6% of returns)
Here:
$3,201
State:
$10,947
(% of AGI for various income ranges: 8.7% for AGIs below $25k, 11.9% for AGIs $25k-50k, 54.7% for AGIs $50k-75k, 123.6% for AGIs $75k-100k, 226.0% for AGIs $100k-200k, 2942.5% for AGIs over 200k)
Net capital gain/loss in AGI: +$5,112 (reported on 7.1% of returns)
Here:
+$5,112
State:
+$18,453
(% of AGI for various income ranges: 2.0% for AGIs below $25k, 4.2% for AGIs $25k-50k, 45.9% for AGIs $50k-75k, 94.3% for AGIs $75k-100k, 273.9% for AGIs $100k-200k, 8475.0% for AGIs over 200k)
Taxable individual retirement arrangement distribution: $13,845 (reported on 6.7% of returns)
63033:
$13,845
Missouri:
$19,719
(% of AGI for various income ranges: 29.6% for AGIs below $25k, 59.0% for AGIs $25k-50k, 160.4% for AGIs $50k-75k, 372.3% for AGIs $75k-100k, 797.7% for AGIs $100k-200k, 3447.5% for AGIs over 200k)
Total itemized deductions: $27,028 (reported on 6.9% of returns)
Here:
$27,028
State:
$36,651
(% of AGI for various income ranges: 34.4% for AGIs below $25k, 166.3% for AGIs $25k-50k, 463.6% for AGIs $50k-75k, 709.8% for AGIs $75k-100k, 1158.7% for AGIs $100k-200k, 6765.0% for AGIs over 200k)
Charity contributions: $9,903 (reported on 6.1% of returns)
Here:
$9,903
State:
$15,671
(% of AGI for various income ranges: 5.6% for AGIs below $25k, 43.8% for AGIs $25k-50k, 129.1% for AGIs $50k-75k, 231.7% for AGIs $75k-100k, 500.7% for AGIs $100k-200k, 2790.0% for AGIs over 200k)
Taxes paid: $5,558 (reported on 6.9% of returns)
63033:
$5,558
State:
$7,608
(% of AGI for various income ranges: 4.9% for AGIs below $25k, 24.9% for AGIs $25k-50k, 92.6% for AGIs $50k-75k, 176.1% for AGIs $75k-100k, 301.4% for AGIs $100k-200k, 1075.0% for AGIs over 200k)
Earned income credit: $2,546 (reported on 24.2% of returns)
Here:
$2,546
State:
$2,315
(% of AGI for various income ranges: 132.8% for AGIs below $25k, 86.5% for AGIs $25k-50k, 1.0% for AGIs $50k-75k)
Percentage of individuals using paid preparers for their 2020 taxes: 89.6%
Here:
90%
State:
93%
(% for various income ranges: 91.0% for AGIs below $25k, 89.5% for AGIs $25k-50k, 87.6% for AGIs $50k-75k, 87.4% for AGIs $75k-100k, 88.7% for AGIs $100k-200k, 91.7% for AGIs over 200k)
Averages for the 2012 tax year for zip code 63033, filed in 2013:
Average Adjusted Gross Income (AGI) in 2012: $40,419 (Individual Income Tax Returns)
Here:
$40,419
State:
$55,896
Salary/wage: $36,307 (reported on 83.6% of returns)
Here:
$36,307
State:
$46,205
(% of AGI for various income ranges: 74.7% for AGIs below $25k, 80.4% for AGIs $25k-50k, 75.4% for AGIs $50k-75k, 74.3% for AGIs $75k-100k, 72.2% for AGIs $100k-200k, 49.5% for AGIs over 200k)
Taxable interest for individuals: $979 (reported on 23.6% of returns)
This zip code:
$979
Missouri:
$1,559
(% of AGI for various income ranges: 0.8% for AGIs below $25k, 0.5% for AGIs $25k-50k, 0.6% for AGIs $50k-75k, 0.5% for AGIs $75k-100k, 0.5% for AGIs $100k-200k, 0.9% for AGIs over 200k)
Ordinary dividends: $3,281 (reported on 14.2% of returns)
Here:
$3,281
State:
$7,410
(% of AGI for various income ranges: 1.1% for AGIs below $25k, 0.7% for AGIs $25k-50k, 0.9% for AGIs $50k-75k, 1.1% for AGIs $75k-100k, 1.5% for AGIs $100k-200k, 5.7% for AGIs over 200k)
Net capital gain/loss in AGI: +$1,972 (reported on 8.8% of returns)
Here:
+$1,972
State:
+$11,579
(% of AGI for various income ranges: 0.2% for AGIs $50k-75k, 0.3% for AGIs $75k-100k, 0.8% for AGIs $100k-200k, 7.0% for AGIs over 200k)
Profit/loss from business: +$4,426 (reported on 12.0% of returns)
Here:
+$4,426
State:
+$11,688
(% of AGI for various income ranges: 5.3% for AGIs below $25k, 0.4% for AGIs $25k-50k, 0.7% for AGIs $50k-75k, 0.6% for AGIs $75k-100k, 1.3% for AGIs $100k-200k)
Taxable individual retirement arrangement distribution: $11,920 (reported on 10.5% of returns)
63033:
$11,920
Missouri:
$14,773
(% of AGI for various income ranges: 2.6% for AGIs below $25k, 2.3% for AGIs $25k-50k, 2.9% for AGIs $50k-75k, 3.7% for AGIs $75k-100k, 4.0% for AGIs $100k-200k, 3.9% for AGIs over 200k)
Total itemized deductions: $16,880 (25% of AGI, reported on 32.3% of returns)
Here:
$16,880
State:
$22,730
Here:
25.4% of AGI
State:
19.2% of AGI
(% of AGI for various income ranges: 9.4% for AGIs below $25k, 12.8% for AGIs $25k-50k, 15.2% for AGIs $50k-75k, 14.0% for AGIs $75k-100k, 14.5% for AGIs $100k-200k, 14.5% for AGIs over 200k)
Charity contributions: $4,047 (reported on 27.4% of returns)
Here:
$4,047
State:
$4,745
(% of AGI for various income ranges: 1.3% for AGIs below $25k, 2.2% for AGIs $25k-50k, 3.1% for AGIs $50k-75k, 3.1% for AGIs $75k-100k, 3.7% for AGIs $100k-200k, 3.8% for AGIs over 200k)
Taxes paid: $5,148 (reported on 32.1% of returns)
63033:
$5,148
State:
$8,399
(% of AGI for various income ranges: 1.9% for AGIs below $25k, 3.1% for AGIs $25k-50k, 4.4% for AGIs $50k-75k, 4.6% for AGIs $75k-100k, 5.7% for AGIs $100k-200k, 5.7% for AGIs over 200k)
Earned income credit: $2,451 (reported on 24.2% of returns)
Here:
$2,451
State:
$2,288
(% of AGI for various income ranges: 8.5% for AGIs below $25k, 1.3% for AGIs $25k-50k)
Percentage of individuals using paid preparers for their 2012 taxes: 43.1%
Here:
43%
State:
55%
(% for various income ranges: 39.7% for AGIs below $25k, 41.8% for AGIs $25k-50k, 48.4% for AGIs $50k-75k, 50.3% for AGIs $75k-100k, 49.6% for AGIs $100k-200k, 50.0% for AGIs over 200k)
Averages for the 2004 tax year for zip code 63033, filed in 2005:
Average Adjusted Gross Income (AGI) in 2004: $39,089 (Individual Income Tax Returns)
Here:
$39,089
State:
$44,591
Salary/wage: $36,670 (reported on 84.7% of returns)
Here:
$36,670
State:
$38,941
(% of AGI for various income ranges: 89.1% for AGIs below $10k, 73.7% for AGIs $10k-25k, 81.1% for AGIs $25k-50k, 80.1% for AGIs $50k-75k, 82.7% for AGIs $75k-100k, 75.1% for AGIs over 100k)
Taxable interest for individuals: $1,335 (reported on 37.9% of returns)
This zip code:
$1,335
Missouri:
$1,801
(% of AGI for various income ranges: 3.1% for AGIs below $10k, 2.6% for AGIs $10k-25k, 1.2% for AGIs $25k-50k, 1.1% for AGIs $50k-75k, 0.8% for AGIs $75k-100k, 1.1% for AGIs over 100k)
Taxable dividends: $2,177 (reported on 23.1% of returns)
Here:
$2,177
State:
$3,677
(% of AGI for various income ranges: 2.7% for AGIs below $10k, 1.9% for AGIs $10k-25k, 1.0% for AGIs $25k-50k, 1.2% for AGIs $50k-75k, 1.0% for AGIs $75k-100k, 1.7% for AGIs over 100k)
Net capital gain/loss: +$2,524 (reported on 15.4% of returns)
Here:
+$2,524
State:
+$8,915
(% of AGI for various income ranges: -1.2% for AGIs below $10k, 0.2% for AGIs $10k-25k, 0.3% for AGIs $25k-50k, 0.4% for AGIs $50k-75k, 0.7% for AGIs $75k-100k, 3.8% for AGIs over 100k)
Profit/loss from business: +$3,965 (reported on 11.0% of returns)
Here:
+$3,965
State:
+$9,793
(% of AGI for various income ranges: 2.5% for AGIs below $10k, 2.8% for AGIs $10k-25k, 1.0% for AGIs $25k-50k, 0.9% for AGIs $50k-75k, 0.6% for AGIs $75k-100k, 0.8% for AGIs over 100k)
IRA payment deduction: $2,422 (reported on 1.7% of returns)
63033:
$2,422
Missouri:
$2,972
(% of AGI for various income ranges: 0.2% for AGIs $10k-25k, 0.2% for AGIs $25k-50k, 0.1% for AGIs $50k-75k, 0.1% for AGIs $75k-100k, 0.1% for AGIs over 100k)
Self-employed pension: $4,775 (reported on 0.2% of returns)
Here:
$4,775
Missouri:
$14,365
Total itemized deductions: $15,254 (25% of AGI, reported on 40.5% of returns)
Here:
$15,254
State:
$18,261
Here:
25.1% of AGI
State:
20.5% of AGI
(% of AGI for various income ranges: 12.0% for AGIs below $10k, 11.6% for AGIs $10k-25k, 15.7% for AGIs $25k-50k, 17.4% for AGIs $50k-75k, 16.8% for AGIs $75k-100k, 15.6% for AGIs over 100k)
Charity contributions deductions: $3,459 (6% of AGI, reported on 36.8% of returns)
Here:
$3,459
State:
$3,665
Here:
5.5% of AGI
State:
3.9% of AGI
(% of AGI for various income ranges: 1.1% for AGIs below $10k, 1.7% for AGIs $10k-25k, 2.8% for AGIs $25k-50k, 3.6% for AGIs $50k-75k, 3.9% for AGIs $75k-100k, 3.9% for AGIs over 100k)
Total tax: $4,535 (reported on 74.4% of returns)
63033:
$4,535
State:
$6,999
(% of AGI for various income ranges: 2.0% for AGIs below $10k, 3.5% for AGIs $10k-25k, 6.4% for AGIs $25k-50k, 8.8% for AGIs $50k-75k, 10.0% for AGIs $75k-100k, 14.4% for AGIs over 100k)
Earned income credit: $1,759 (reported on 16.4% of returns)
Here:
$1,759
State:
$1,728
Percentage of individuals using paid preparers for their 2004 taxes: 53.8%
Here:
54%
State:
62%
(% for various income ranges: 43.6% for AGIs below $10k, 57.7% for AGIs $10k-25k, 54.7% for AGIs $25k-50k, 56.1% for AGIs $50k-75k, 54.5% for AGIs $75k-100k, 57.2% for AGIs over 100k)
Likely homosexual households (counted as self-reported same-sex unmarried-partner households)
Lesbian couples: 0.3% of all households
Gay men: 0.0% of all households
Household received Food Stamps/SNAP in the past 12 months: 1,953 Household did not receive Food Stamps/SNAP in the past 12 months: 14,831
Women who had a birth in the past 12 months: 375 (183 now married, 202 unmarried) Women who did not have a birth in the past 12 months: 9,692 (2,617 now married, 7,118 unmarried)
Housing units in zip code 63033 with a mortgage: 7,725 (302 second mortgage, 167 both second mortgage and home equity loan) Houses without a mortgage: 90
Median monthly owner costs for units with a mortgage: $1,274 Median monthly owner costs for units without a mortgage: $520
Residents with income below the poverty level in 2022:
This zip code:
10.4%
Whole state:
13.2%
Residents with income below 50% of the poverty level in 2022:
This zip code:
6.3%
Whole state:
6.8%
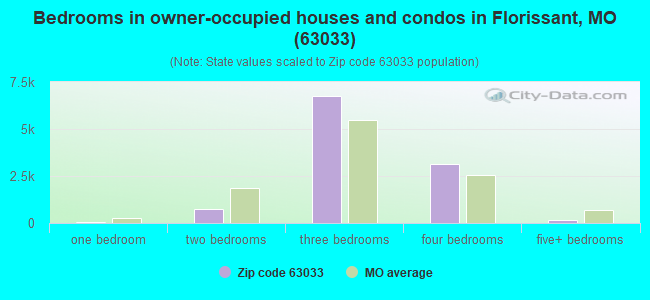
Median number of rooms in houses and condos:
Here:
6.5
State:
6.4
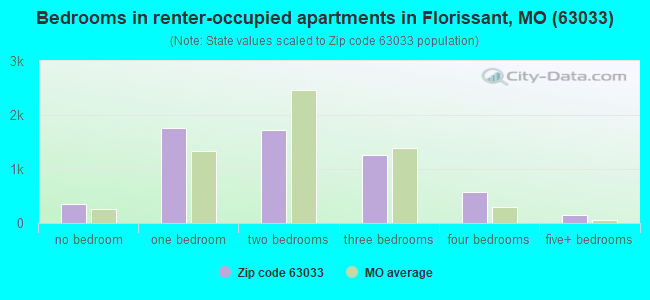
Median number of rooms in apartments:
Here:
4.1
State:
4.4
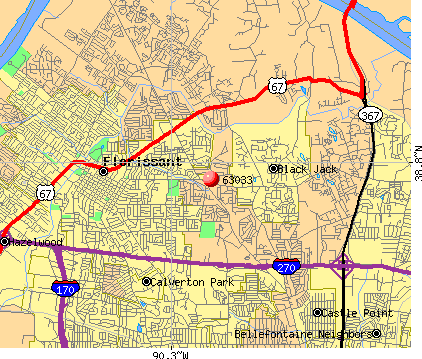
Notable locations in this zip code not listed on our city pages
Notable locations in zip code 63033: Black Jack Fire Protection District Station 1 (A), Florissant Valley Fire Protection District Station 2 (B). Display/hide their locations on the map
Shopping Centers: Plaza Madrid Shopping Center (1), Strollway Shopping Center (2), Cross Keys Shopping Center (3), Clocktower Shopping Center (4), Grandview Plaza Shopping Center (5), North Hills Shopping Center (6), Paddock Forest Shopping Center (7), Paddock Hills Shopping Center (8). Display/hide their locations on the map
3,597 married couples with children.
4,237 single-parent households (916 men, 3,321 women).
95.5% of residents of 63033 zip code speak English at home.
1.2% of residents speak Spanish at home (44% very well, 44% well, 12% not well).
1.3% of residents speak other Indo-European language at home (64% very well, 31% well, 5% not well).
0.6% of residents speak Asian or Pacific Island language at home (21% very well, 19% well, 60% not well).
1.5% of residents speak other language at home (74% very well, 12% well, 14% not well).
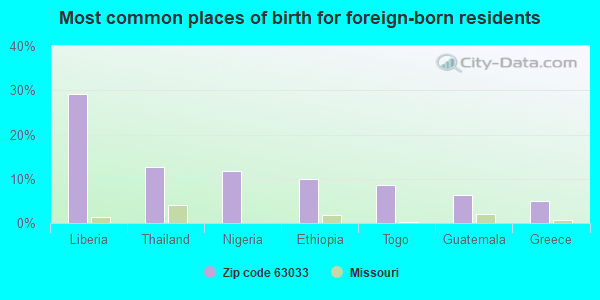
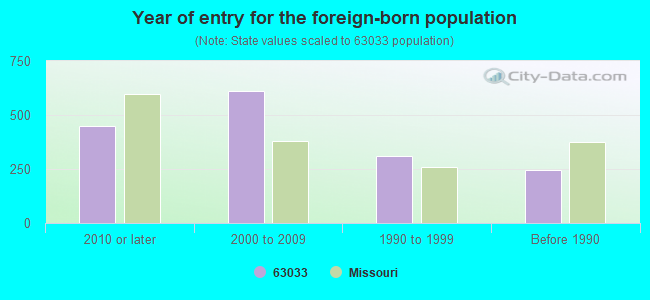
Foreign born population: 1,209 (2.9%) (61.7% of them are naturalized citizens)
Major facilities with environmental interests located in this zip code:
ARZIE C STEPHENS, JR. (3672 SALAZAR in FLORISSANT, MO)
ENFORCEMENT/COMPLIANCE ACTIVITY (Integrated Compliance Information System) - ICIS-07-2002-0059, FORMAL ENFORCEMENT ACTION (Integrated Compliance Information System) - ICIS-07-2002-0059, FORMAL ENFORCEMENT ACTION STATE MASTER (Missouri monitoring and compilance) - ICIS-18358, ENFORCEMENT/COMPLIANCE ACTIVITY, Business SIC classification: REAL ESTATE AGENTS AND MANAGERS
NORTH COUNTY TECHNICAL SCHOOL (1700 DERHAKE RD in FLORISSANT, MO)
STATE MASTER (Missouri monitoring and compilance) - RCRAINFO-MOD981710619, SQG (National Center for Education Statistics) - STATE ID-1100096119 Small Quantity Generators, between 100 kg and 1000 kg of hazardous waste/month (Resource Conservation and Recovery Act (tracking hazardous waste)) Business NAICS classification: OTHER TECHNICAL AND TRADE SCHOOLS. Organizations: SPECIAL SCHOOL DISTRICT (CONTACT/OPERATOR)
, SPECIAL SCHOOL DIST (CONTACT/OWNER)
, SPECL. SCH. DST. ST. LOUIS CO. (SCHOOL DISTRICT)
Alternative names: NORTH TECH HIGH SCHOOL
AMERICAN CLEANERS (11501 NEW HALLS FERRY RD in FLORISSANT, MO)
AIR MINOR (AIRS/AFS) STATE MASTER (Missouri monitoring and compilance) - RCRAINFO-MOR000011239, SQG CRITERIA AND HAZARDOUS AIR POLLUTANT INVENTORY (Inventory of air pollution sources) Small Quantity Generators, between 100 kg and 1000 kg of hazardous waste/month (Resource Conservation and Recovery Act (tracking hazardous waste)) - notification Business SIC classification: DRYCLEANING PLANTS, EXCEPT RUG CLEANING Organizations: JOHNLEN CLEANERS (CONTACT/OWNER)
Alternative names: AMERICAN CLEANERS-NEW HALLS FERRY
705 HRY CENTRAL CITY SERV (3675 DUNN RD in FLORISSANT, MO)
STATE MASTER (Missouri monitoring and compilance) - RCRAINFO-MOD985797000, NOT IN A UNIVERSE (Resource Conservation and Recovery Act (tracking hazardous waste)) Organizations: ARCH ENERGY LC (CONTACT/OWNER)
721 L3A CLARKSON MOBIL (6999 PARKER RD in FLORISSANT, MO)
STATE MASTER (Missouri monitoring and compilance) - RCRAINFO-MOD985797026, NOT IN A UNIVERSE (Resource Conservation and Recovery Act (tracking hazardous waste)) Organizations: ARCH ENERGY L C (CONTACT/OWNER)
722 LGF VOSS'S FOOD MART (3125 N HWY 67 in FLORISSANT, MO)
STATE MASTER (Missouri monitoring and compilance) - RCRAINFO-MOD985796986, NOT IN A UNIVERSE (Resource Conservation and Recovery Act (tracking hazardous waste)) Organizations: ARCH ENERGY L C (CONTACT/OWNER)
Alternative names: 722 LGF VOSS S FOOD MART
PINE CLEANERS NORTH (12757 NEW HALLS FERRY RD in FLORISSANT, MO)
STATE MASTER (Missouri monitoring and compilance) - RCRAINFO-MOD981702913, SQG (Resource Conservation and Recovery Act (tracking hazardous waste)) Organizations: CHRIS LEKOMETROS (CONTACT/OWNER)
GOODYEAR TIRE AND RUBBER CO (2775 N HWY 67 in FLORISSANT, MO)
STATE MASTER (Missouri monitoring and compilance) - RCRAINFO-MOD149985061, NOT IN A UNIVERSE (Resource Conservation and Recovery Act (tracking hazardous waste)) Organizations: GOODYEAR T&R CO (CONTACT/OWNER)
704 HWJ CLARKS SERV (3575 PARKER SPUR in FLORISSANT, MO)
STATE MASTER (Missouri monitoring and compilance) - RCRAINFO-MOD985797018, NOT IN A UNIVERSE (Resource Conservation and Recovery Act (tracking hazardous waste)) Organizations: ARCH ENERGY LC (CONTACT/OWNER)
PENSKE AUTO CENTER (1B FLOWER VALLEY SHP in FLORISSANT, MO)
STATE MASTER (Missouri monitoring and compilance) - RCRAINFO-MOR000000562, NOT IN A UNIVERSE (Resource Conservation and Recovery Act (tracking hazardous waste)) Business NAICS classification: GENERAL AUTOMOTIVE REPAIR. Organizations: PENSKE AUTO CENTER INC (CONTACT/OWNER)
AMOCO OIL CO (1915 WASHINGTON in FLORISSANT, MO)
STATE MASTER (Missouri monitoring and compilance) - RCRAINFO-MOD985802289, NOT IN A UNIVERSE (Resource Conservation and Recovery Act (tracking hazardous waste))
BFI WASTE SYSTEM OF NORTH AMERICA (3350 NORTH HIGHWAY 67 in FLORISSANT, MO)
STATE MASTER (Missouri monitoring and compilance) - RCRAINFO-MOD054939400, NOT IN A UNIVERSE, PCS-MOR80C205, NPDES NON-MAJOR (Resource Conservation and Recovery Act (tracking hazardous waste)) Business SIC classification: TERMINAL AND JOINT TERMINAL MAINTENANCE FACILITIES FOR MOTOR FREIGHT TRANSPORTATION Organizations: BROWNING FERRIS IND (CONTACT/OWNER)
Alternative names: B F I OF ST LOUIS NORTH COUNTY, BFI WASTE SYSTEMOF N AME
BILL GAINES (11405 OLD HALLS FERRY in FLORISSANT, MO)
STATE MASTER (Missouri monitoring and compilance) - PCS-MOR105938, NPDES NON-MAJOR National Pollutant Discharge Elimination System NON-MAJOR (Tracking pollutant discharge elimination systems) - permit Alternative names: GAINES TRACT AT OLD HALLS
Housing units lacking complete kitchen facilities: 0.3%
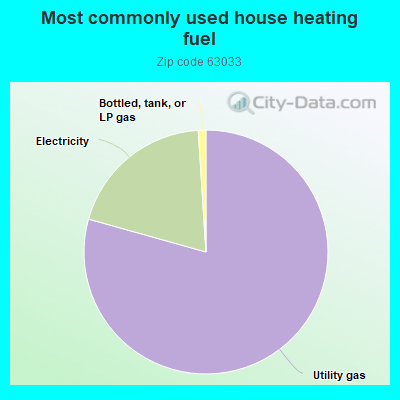
79.2%Utility gas
19.6%Electricity
1.0%Bottled, tank, or LP gas
Population in 1990: 44,480. Population change in the 1990s: +1,094 (+2.5%).
Place of birth for U.S.-born residents:
This state: 30,420
Northeast: 403
Midwest: 3,651
South: 4,195
West: 791
60% of the 63033 zip code residents lived in the same house 5 years ago. Out of people who lived in different houses, 56% lived in this county. Out of people who lived in different counties, 50% lived in Missouri.
91% of the 63033 zip code residents lived in the same house 1 year ago. Out of people who lived in different houses, 71% moved from this county. Out of people who lived in different houses, 19% moved from different county within same state. Out of people who lived in different houses, 7% moved from different state. Out of people who lived in different houses, 1% moved from abroad.
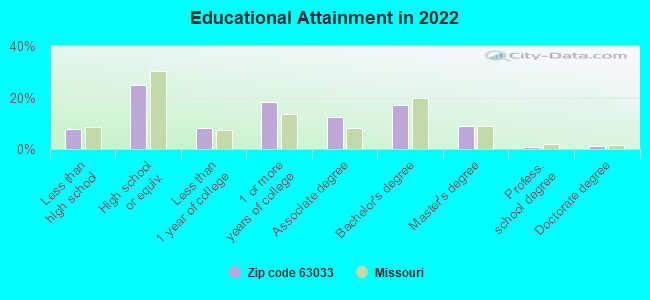
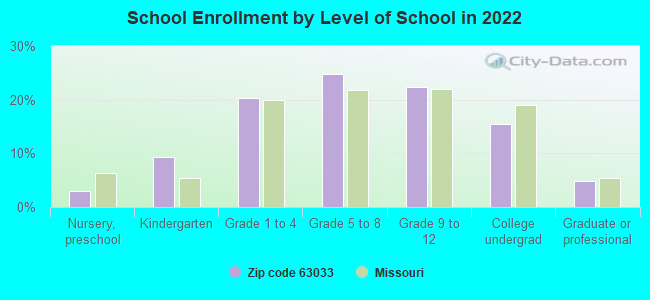
Private vs. public school enrollment:
Students in private schools in grades 1 to 8 (elementary and middle school): 1,154
Here:
23.7%
Missouri:
15.4%
Students in private schools in grades 9 to 12 (high school): 488
Here:
20.0%
Missouri:
13.9%
Students in private undergraduate colleges: 249
Here:
14.8%
Missouri:
22.6%
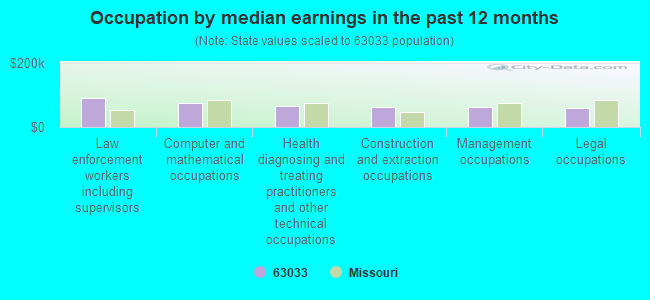
Occupation by median earnings in the past 12 months ($)
91,510Law enforcement workers including supervisors
74,636Computer and mathematical occupations
65,299Health diagnosing and treating practitioners and other technical occupations
63,087Construction and extraction occupations
62,553Management occupations
60,721Legal occupations
Companies with federal contracts located in this zip code:
L & J ENTERPRISES (#2 MUSTANG COURT in FLORISSANT, MO; small business)
$29,170 with Air Force for Photographic Projection Equipment. Taking place in FL. Signed on 2000-06-25. Completion date: 2000-07-10.
Top industries in this zip code by the number of employees in 2005:
2002 - 2018 National Fire Incident Reporting System (NFIRS) incidents
According to the data from the years 2002 - 2018 the average number of fires per year is 119. The highest number of reported fires - 177 took place in 2004, and the least - 75 in 2002. The data has a growing trend.
When looking into fire subcategories, the most incidents belonged to: Structure Fires (47.0%), and Outside Fires (24.9%).
Fire incident types reported to NFIRS in Zip Code 63033
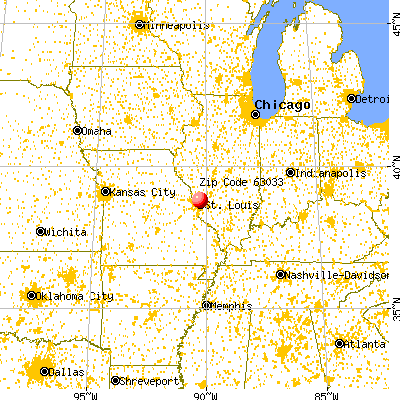


 Nearest zip codes: 63034, 63135, 63136, 63140, 63031, 63137.
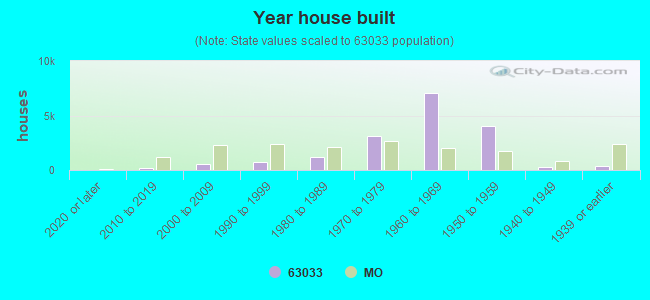


 According to the data from the years 2002 - 2018 the average number of fires per year is 119. The highest number of reported fires - 177 took place in 2004, and the least - 75 in 2002. The data has a growing trend.
 When looking into fire subcategories, the most incidents belonged to: Structure Fires (47.0%), and Outside Fires (24.9%).