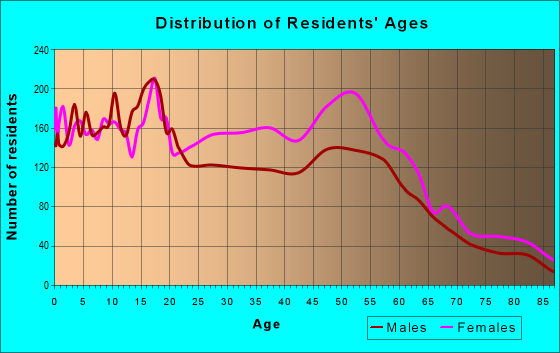
Estimated zip code population in 2022: 19,839 Zip code population in 2010: 21,334 Zip code population in 2000: 21,532
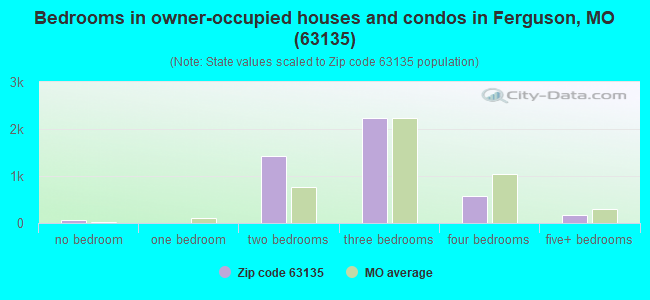
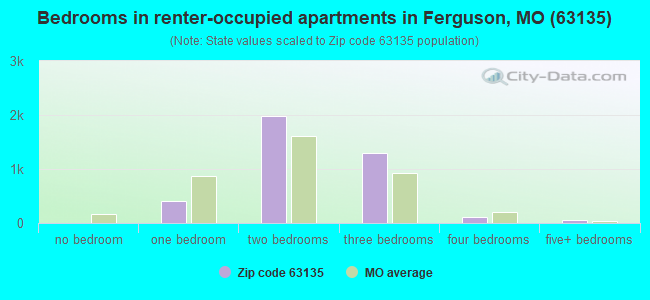
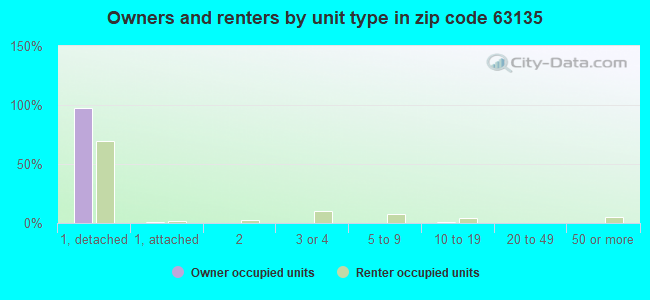
Houses and condos: 9,351 Renter-occupied apartments: 3,833
% of renters here:
46%
State:
32%
March 2022 cost of living index in zip code 63135: 94.6 (less than average, U.S. average is 100)
Land area: 6.3 sq. mi. Water area: 0.0 sq. mi.
Population density: 3,162 people per square mile
(average).
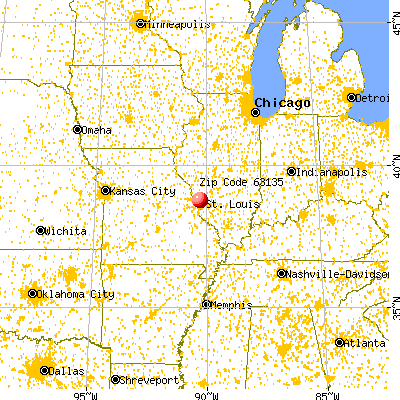
OSM Map
General Map
Google Map
MSN Map
OSM Map
General Map
Google Map
MSN Map
OSM Map
General Map
Google Map
MSN Map
OSM Map
General Map
Google Map
MSN Map
Please wait while loading the map...
Real estate property taxes paid for housing units in 2022:
This zip code:
1.5% ($1,463)
Missouri:
0.8% ($1,810)
Median real estate property taxes paid for housing units with mortgages in 2022: $1,479 (1.4%) Median real estate property taxes paid for housing units with no mortgage in 2022: $1,440 (1.5%)
Averages for the 2020 tax year for zip code 63135, filed in 2021:
Average Adjusted Gross Income (AGI) in 2020: $37,069 (Individual Income Tax Returns)
Here:
$37,069
State:
$68,151
Salary/wage: $33,664 (reported on 85.7% of returns)
Here:
$33,664
State:
$56,131
(% of AGI for various income ranges: 1267.6% for AGIs below $25k, 3938.9% for AGIs $25k-50k, 7127.7% for AGIs $50k-75k, 10057.9% for AGIs $75k-100k, 17127.2% for AGIs $100k-200k, 37056.7% for AGIs over 200k)
Taxable interest for individuals: $615 (reported on 13.8% of returns)
This zip code:
$615
Missouri:
$1,586
(% of AGI for various income ranges: 3.8% for AGIs below $25k, 6.0% for AGIs $25k-50k, 23.8% for AGIs $50k-75k, 44.5% for AGIs $75k-100k, 68.4% for AGIs $100k-200k, 183.3% for AGIs over 200k)
Ordinary dividends: $3,581 (reported on 8.1% of returns)
Here:
$3,581
State:
$10,947
(% of AGI for various income ranges: 6.1% for AGIs below $25k, 14.2% for AGIs $25k-50k, 48.9% for AGIs $50k-75k, 106.4% for AGIs $75k-100k, 428.8% for AGIs $100k-200k, 1690.0% for AGIs over 200k)
Net capital gain/loss in AGI: +$6,378 (reported on 6.6% of returns)
Here:
+$6,378
State:
+$18,453
(% of AGI for various income ranges: 3.5% for AGIs below $25k, 8.9% for AGIs $25k-50k, 34.7% for AGIs $50k-75k, 115.2% for AGIs $75k-100k, 602.8% for AGIs $100k-200k, 5516.7% for AGIs over 200k)
Profit/loss from business: +$1,184 (reported on 15.2% of returns)
Here:
+$1,184
State:
+$12,260
(% of AGI for various income ranges: 8.5% for AGIs below $25k, 64.2% for AGIs $50k-75k, 149.4% for AGIs $75k-100k, 450.4% for AGIs $100k-200k, 1046.7% for AGIs over 200k)
Taxable individual retirement arrangement distribution: $13,925 (reported on 5.2% of returns)
63135:
$13,925
Missouri:
$19,719
(% of AGI for various income ranges: 20.7% for AGIs below $25k, 52.6% for AGIs $25k-50k, 163.2% for AGIs $50k-75k, 297.6% for AGIs $75k-100k, 1140.8% for AGIs $100k-200k)
Total itemized deductions: $26,504 (reported on 4.6% of returns)
Here:
$26,504
State:
$36,651
(% of AGI for various income ranges: 19.8% for AGIs below $25k, 113.9% for AGIs $25k-50k, 292.7% for AGIs $50k-75k, 497.0% for AGIs $75k-100k, 1298.0% for AGIs $100k-200k, 4350.0% for AGIs over 200k)
Charity contributions: $9,287 (reported on 3.9% of returns)
Here:
$9,287
State:
$15,671
(% of AGI for various income ranges: 4.0% for AGIs below $25k, 22.8% for AGIs $25k-50k, 81.0% for AGIs $50k-75k, 180.6% for AGIs $75k-100k, 435.6% for AGIs $100k-200k, 1770.0% for AGIs over 200k)
Taxes paid: $5,595 (reported on 4.3% of returns)
63135:
$5,595
State:
$7,608
(% of AGI for various income ranges: 2.4% for AGIs below $25k, 14.1% for AGIs $25k-50k, 55.3% for AGIs $50k-75k, 135.2% for AGIs $75k-100k, 290.0% for AGIs $100k-200k, 1103.3% for AGIs over 200k)
Earned income credit: $2,616 (reported on 33.6% of returns)
Here:
$2,616
State:
$2,315
(% of AGI for various income ranges: 169.7% for AGIs below $25k, 102.5% for AGIs $25k-50k)
Percentage of individuals using paid preparers for their 2020 taxes: 89.6%
Here:
90%
State:
93%
(% for various income ranges: 91.0% for AGIs below $25k, 89.3% for AGIs $25k-50k, 87.0% for AGIs $50k-75k, 86.5% for AGIs $75k-100k, 87.5% for AGIs $100k-200k, 85.7% for AGIs over 200k)
Averages for the 2012 tax year for zip code 63135, filed in 2013:
Average Adjusted Gross Income (AGI) in 2012: $34,054 (Individual Income Tax Returns)
Here:
$34,054
State:
$55,896
Salary/wage: $30,905 (reported on 86.5% of returns)
Here:
$30,905
State:
$46,205
(% of AGI for various income ranges: 78.8% for AGIs below $25k, 85.2% for AGIs $25k-50k, 80.4% for AGIs $50k-75k, 77.4% for AGIs $75k-100k, 73.4% for AGIs $100k-200k, 45.5% for AGIs over 200k)
Taxable interest for individuals: $740 (reported on 18.3% of returns)
This zip code:
$740
Missouri:
$1,559
(% of AGI for various income ranges: 0.4% for AGIs below $25k, 0.3% for AGIs $25k-50k, 0.4% for AGIs $50k-75k, 0.5% for AGIs $75k-100k, 0.4% for AGIs $100k-200k, 0.6% for AGIs over 200k)
Ordinary dividends: $3,662 (reported on 11.5% of returns)
Here:
$3,662
State:
$7,410
(% of AGI for various income ranges: 0.8% for AGIs below $25k, 0.7% for AGIs $25k-50k, 1.0% for AGIs $50k-75k, 1.4% for AGIs $75k-100k, 1.9% for AGIs $100k-200k, 5.2% for AGIs over 200k)
Net capital gain/loss in AGI: +$3,236 (reported on 7.1% of returns)
Here:
+$3,236
State:
+$11,579
(% of AGI for various income ranges: 0.3% for AGIs $50k-75k, 0.7% for AGIs $75k-100k, 1.4% for AGIs $100k-200k, 8.2% for AGIs over 200k)
Profit/loss from business: +$5,833 (reported on 13.4% of returns)
Here:
+$5,833
State:
+$11,688
(% of AGI for various income ranges: 7.6% for AGIs below $25k, 0.7% for AGIs $25k-50k, 0.9% for AGIs $50k-75k, 0.9% for AGIs $75k-100k, 1.9% for AGIs $100k-200k)
Taxable individual retirement arrangement distribution: $11,304 (reported on 6.8% of returns)
63135:
$11,304
Missouri:
$14,773
(% of AGI for various income ranges: 1.5% for AGIs below $25k, 1.5% for AGIs $25k-50k, 2.0% for AGIs $50k-75k, 3.2% for AGIs $75k-100k, 4.8% for AGIs $100k-200k)
Total itemized deductions: $15,635 (24% of AGI, reported on 22.9% of returns)
Here:
$15,635
State:
$22,730
Here:
24.1% of AGI
State:
19.2% of AGI
(% of AGI for various income ranges: 5.4% for AGIs below $25k, 9.9% for AGIs $25k-50k, 12.6% for AGIs $50k-75k, 12.6% for AGIs $75k-100k, 14.0% for AGIs $100k-200k, 9.6% for AGIs over 200k)
Charity contributions: $3,769 (reported on 18.8% of returns)
Here:
$3,769
State:
$4,745
(% of AGI for various income ranges: 0.6% for AGIs below $25k, 1.8% for AGIs $25k-50k, 2.4% for AGIs $50k-75k, 2.4% for AGIs $75k-100k, 3.6% for AGIs $100k-200k, 2.5% for AGIs over 200k)
Taxes paid: $4,868 (reported on 22.8% of returns)
63135:
$4,868
State:
$8,399
(% of AGI for various income ranges: 1.1% for AGIs below $25k, 2.4% for AGIs $25k-50k, 4.0% for AGIs $50k-75k, 4.2% for AGIs $75k-100k, 5.4% for AGIs $100k-200k, 5.0% for AGIs over 200k)
Earned income credit: $2,673 (reported on 35.2% of returns)
Here:
$2,673
State:
$2,288
(% of AGI for various income ranges: 11.7% for AGIs below $25k, 1.7% for AGIs $25k-50k)
Percentage of individuals using paid preparers for their 2012 taxes: 43.6%
Here:
44%
State:
55%
(% for various income ranges: 42.3% for AGIs below $25k, 41.5% for AGIs $25k-50k, 50.9% for AGIs $50k-75k, 46.7% for AGIs $75k-100k, 47.6% for AGIs $100k-200k, 75.0% for AGIs over 200k)
Averages for the 2004 tax year for zip code 63135, filed in 2005:
Average Adjusted Gross Income (AGI) in 2004: $32,253 (Individual Income Tax Returns)
Here:
$32,253
State:
$44,591
Salary/wage: $29,906 (reported on 88.3% of returns)
Here:
$29,906
State:
$38,941
(% of AGI for various income ranges: 88.7% for AGIs below $10k, 82.9% for AGIs $10k-25k, 86.6% for AGIs $25k-50k, 82.9% for AGIs $50k-75k, 83.8% for AGIs $75k-100k, 66.1% for AGIs over 100k)
Taxable interest for individuals: $1,304 (reported on 27.8% of returns)
This zip code:
$1,304
Missouri:
$1,801
(% of AGI for various income ranges: 1.8% for AGIs below $10k, 1.4% for AGIs $10k-25k, 1.0% for AGIs $25k-50k, 1.1% for AGIs $50k-75k, 1.1% for AGIs $75k-100k, 1.1% for AGIs over 100k)
Taxable dividends: $2,639 (reported on 16.0% of returns)
Here:
$2,639
State:
$3,677
(% of AGI for various income ranges: 1.6% for AGIs below $10k, 1.2% for AGIs $10k-25k, 0.7% for AGIs $25k-50k, 1.4% for AGIs $50k-75k, 1.0% for AGIs $75k-100k, 2.9% for AGIs over 100k)
Net capital gain/loss: +$3,827 (reported on 10.4% of returns)
Here:
+$3,827
State:
+$8,915
(% of AGI for various income ranges: 0.8% for AGIs below $10k, 0.2% for AGIs $10k-25k, 0.3% for AGIs $25k-50k, 0.7% for AGIs $50k-75k, 1.0% for AGIs $75k-100k, 5.6% for AGIs over 100k)
Profit/loss from business: +$5,130 (reported on 10.3% of returns)
Here:
+$5,130
State:
+$9,793
(% of AGI for various income ranges: 4.5% for AGIs below $10k, 2.4% for AGIs $10k-25k, 1.1% for AGIs $25k-50k, 0.9% for AGIs $50k-75k, 1.0% for AGIs $75k-100k, 3.0% for AGIs over 100k)
IRA payment deduction: $2,019 (reported on 1.6% of returns)
63135:
$2,019
Missouri:
$2,972
(% of AGI for various income ranges: 0.1% for AGIs $10k-25k, 0.1% for AGIs $25k-50k, 0.1% for AGIs $50k-75k, 0.0% for AGIs $75k-100k, 0.1% for AGIs over 100k)
Self-employed pension: $8,579 (reported on 0.2% of returns)
Here:
$8,579
Missouri:
$14,365
Total itemized deductions: $14,036 (25% of AGI, reported on 28.9% of returns)
Here:
$14,036
State:
$18,261
Here:
24.7% of AGI
State:
20.5% of AGI
(% of AGI for various income ranges: 7.4% for AGIs below $10k, 7.9% for AGIs $10k-25k, 13.1% for AGIs $25k-50k, 13.6% for AGIs $50k-75k, 15.3% for AGIs $75k-100k, 13.8% for AGIs over 100k)
Charity contributions deductions: $3,130 (5% of AGI, reported on 25.5% of returns)
Here:
$3,130
State:
$3,665
Here:
5.3% of AGI
State:
3.9% of AGI
(% of AGI for various income ranges: 0.6% for AGIs below $10k, 1.1% for AGIs $10k-25k, 2.4% for AGIs $25k-50k, 2.9% for AGIs $50k-75k, 3.3% for AGIs $75k-100k, 3.1% for AGIs over 100k)
Total tax: $3,999 (reported on 65.5% of returns)
63135:
$3,999
State:
$6,999
(% of AGI for various income ranges: 2.0% for AGIs below $10k, 3.0% for AGIs $10k-25k, 6.1% for AGIs $25k-50k, 9.0% for AGIs $50k-75k, 10.4% for AGIs $75k-100k, 16.0% for AGIs over 100k)
Earned income credit: $1,985 (reported on 28.5% of returns)
Here:
$1,985
State:
$1,728
Percentage of individuals using paid preparers for their 2004 taxes: 56.4%
Here:
56%
State:
62%
(% for various income ranges: 50.2% for AGIs below $10k, 60.6% for AGIs $10k-25k, 57.7% for AGIs $25k-50k, 55.2% for AGIs $50k-75k, 55.4% for AGIs $75k-100k, 54.2% for AGIs over 100k)
Likely homosexual households (counted as self-reported same-sex unmarried-partner households)
Lesbian couples: 0.5% of all households
Gay men: 0.1% of all households
Household received Food Stamps/SNAP in the past 12 months: 1,550 Household did not receive Food Stamps/SNAP in the past 12 months: 6,757
Women who had a birth in the past 12 months: 186 (97 now married, 93 unmarried) Women who did not have a birth in the past 12 months: 4,543 (1,636 now married, 2,914 unmarried)
Housing units in zip code 63135 with a mortgage: 2,728 (142 second mortgage, 73 both second mortgage and home equity loan) Median monthly owner costs for units with a mortgage: $1,183 Median monthly owner costs for units without a mortgage: $458
Residents with income below the poverty level in 2022:
This zip code:
18.9%
Whole state:
13.2%
Residents with income below 50% of the poverty level in 2022:
This zip code:
9.8%
Whole state:
6.8%
Median number of rooms in houses and condos:
Here:
5.8
State:
6.4
Median number of rooms in apartments:
Here:
4.9
State:
4.4
Notable locations in this zip code not listed on our city pages
Notable locations in zip code 63135: Ferguson Fire Department Station 2 (A), Happy Go Lucky Child Care Center (B), Ferguson Fire Department Station 1 (C). Display/hide their locations on the map
Churches in zip code 63135 include: Saint Joseph Convent (A), Saint Stephens Episcopal Church (B), Saint John and James Catholic Church (C), Memorial Tabernacle Baptist Church (D), Lighthouse Apostolic Ministries of God Church (E), Liberty Full Gospel Church (F), Immanuel United Church of Christ (G), Great Commission Church of God (H), Grace Baptist Church (I). Display/hide their locations on the map
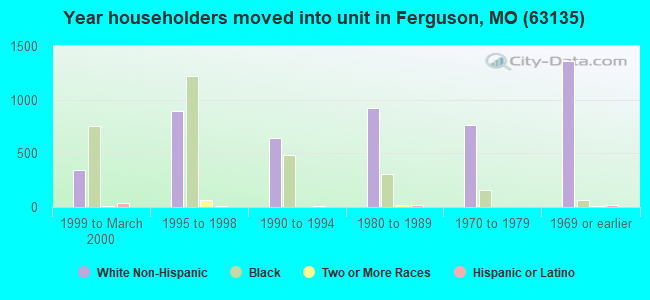
1,352 married couples with children.
2,810 single-parent households (666 men, 2,144 women).
97.3% of residents of 63135 zip code speak English at home.
2.2% of residents speak Spanish at home (100% very well).
0.2% of residents speak other Indo-European language at home (92% very well, 8% well).
0.1% of residents speak Asian or Pacific Island language at home (100% very well).
0.1% of residents speak other language at home (100% very well).
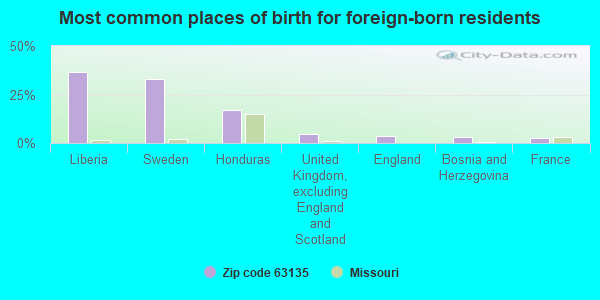
Foreign born population: 167 (0.8%) (45.3% of them are naturalized citizens)
This zip code:
0.8%
Whole state:
4.1%
37%Liberia
33%Sweden
17%Honduras
5%United Kingdom, excluding England and Scotland
4%England
3%Bosnia and Herzegovina
2%France
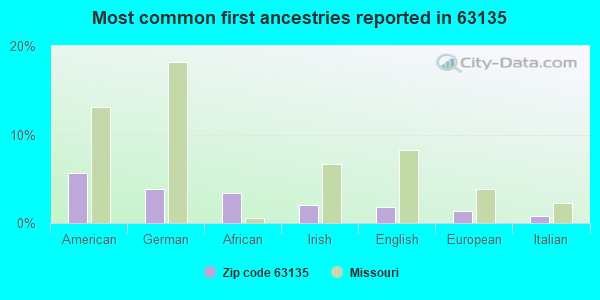
6%American
4%German
3%African
2%Irish
2%English
1%European
1%Italian
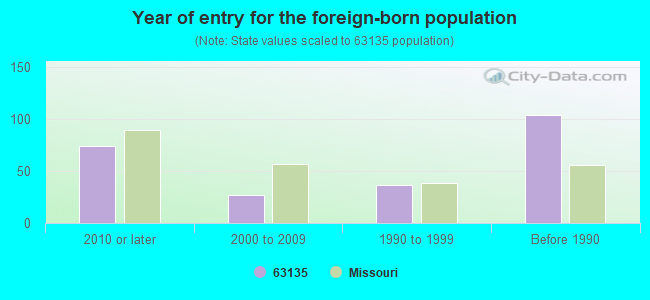
Year of entry for the foreign-born population
742010 or later
272000 to 2009
371990 to 1999
104Before 1990
Major facilities with environmental interests located in this zip code:
FERGUSON FLORISSANT SCHOOL DIS (7469 MINTERT INDUSTRIAL DR in FERGUSON, MO)
(Integrated Compliance Information System) - ICIS-07-1985-0227, FORMAL ENFORCEMENT ACTION STATE MASTER (Missouri monitoring and compilance) - ICIS-27537, ENFORCEMENT/COMPLIANCE ACTIVITY, RCRAINFO-MOD980965271, SQG Small Quantity Generators, between 100 kg and 1000 kg of hazardous waste/month (Resource Conservation and Recovery Act (tracking hazardous waste)) Business SIC classification: ELEMENTARY AND SECONDARY SCHOOLS Organizations: FERGUSON FLORISSANT SCHOOL DIST (CONTACT/OPERATOR)
, CITY OF FERGUSON (CONTACT/OWNER)
HEADY CLEANERS (104 DARST RD in FERGUSON, MO)
AIR MINOR (AIRS/AFS) STATE MASTER (Missouri monitoring and compilance) - RCRAINFO-MOD075911826, SQG CRITERIA AND HAZARDOUS AIR POLLUTANT INVENTORY (Inventory of air pollution sources) Small Quantity Generators, between 100 kg and 1000 kg of hazardous waste/month (Resource Conservation and Recovery Act (tracking hazardous waste)) - notification Business SIC classification: DRYCLEANING PLANTS, EXCEPT RUG CLEANING Organizations: KALIKA INC (CONTACT/OPERATOR)
, MARK A HEADY (CONTACT/OWNER)
Alternative names: HEADY CLEANERS-FERGUSON
PSM FASTENER CORP (355 PAUL AVE in SAINT LOUIS, MO)
(Integrated Compliance Information System) - ICIS-07-1999-0290, FORMAL ENFORCEMENT ACTION STATE MASTER (Missouri monitoring and compilance) - ICIS-18050, ENFORCEMENT/COMPLIANCE ACTIVITY
HADLER PRINTING CO INC (815 FERGUSON AVE in FERGUSON, MO)
AIR MINOR (AIRS/AFS) STATE MASTER (Missouri monitoring and compilance) - RCRAINFO-MOD985817733, SQG (Resource Conservation and Recovery Act (tracking hazardous waste)) Business SIC classification: COMMERCIAL PRINTING, LITHOGRAPHIC Organizations: ARNOLD D HADLER (CONTACT/OWNER)
FERGUSON MIDDLE SCHOOL (701 JANUARY AVE in FERGUSON, MO)
(Integrated Compliance Information System) - ICIS-07-1985-0227, FORMAL ENFORCEMENT ACTION STATE MASTER (Missouri monitoring and compilance) - ICIS-26690, ENFORCEMENT/COMPLIANCE ACTIVITY Business SIC classification: ELEMENTARY AND SECONDARY SCHOOLS
ANDY WURM TIRE & WHEEL CO INC (402 S FLORISSANT in ST LOUIS, MO)
STATE MASTER (Missouri monitoring and compilance) - RCRAINFO-MOR000508788, NOT IN A UNIVERSE (Resource Conservation and Recovery Act (tracking hazardous waste))
45 MINUTE CLEANERS (1132 NEW FLORISSANT RD in FERGUSON, MO)
STATE MASTER (Missouri monitoring and compilance) - RCRAINFO-MOD981703846, SQG (Resource Conservation and Recovery Act (tracking hazardous waste)) Organizations: J A WADDELL (CONTACT/OWNER)
Alternative names: KEARNEY KLEAN
A M T PERFORMANCE (715 S FLORISSANT RD in FERGUSON, MO)
STATE MASTER (Missouri monitoring and compilance) - RCRAINFO-MO0000991976, SQG (Resource Conservation and Recovery Act (tracking hazardous waste)) Organizations: A M T PERFORMANCE ENG INC (CONTACT/OWNER)
AMERICAN CLEANERS (725 S FLORISSANT RD in FERGUSON, MO)
STATE MASTER (Missouri monitoring and compilance) - RCRAINFO-MOD981129224, SQG (Resource Conservation and Recovery Act (tracking hazardous waste)) Organizations: JOE MACH (CONTACT/OWNER)
AMERICAN CLEANERS (60 N FLORRISANT in FERGUSON, MO)
STATE MASTER (Missouri monitoring and compilance) - RCRAINFO-MOD985769165, NOT IN A UNIVERSE (Resource Conservation and Recovery Act (tracking hazardous waste)) Organizations: JOSEPH MACH (CONTACT/OWNER)
AMERITECH (325 PAUL AVE REAR in ST LOUIS, MO)
STATE MASTER (Missouri monitoring and compilance) - RCRAINFO-MOP000037127, NOT IN A UNIVERSE (Resource Conservation and Recovery Act (tracking hazardous waste))
AMOCO OIL CO #5241 (1032 S FLORISSANT RD in FERGUSON, MO)
STATE MASTER (Missouri monitoring and compilance) - RCRAINFO-MOD985802255, NOT IN A UNIVERSE (Resource Conservation and Recovery Act (tracking hazardous waste))
BOYDS FERGUSON SER (707 W CHAMBERS in FERGUSON, MO)
STATE MASTER (Missouri monitoring and compilance) - RCRAINFO-MOP000037036, NOT IN A UNIVERSE (Resource Conservation and Recovery Act (tracking hazardous waste))
Housing units lacking complete plumbing facilities: 3.5% Housing units lacking complete kitchen facilities: 5.1%
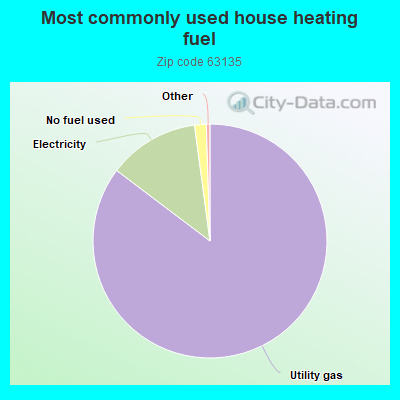
85.3%Utility gas
12.6%Electricity
1.6%No fuel used
Population in 1990: 23,173.
Place of birth for U.S.-born residents:
This state: 15,898
Northeast: 365
Midwest: 1,416
South: 1,351
West: 521
60% of the 63135 zip code residents lived in the same house 5 years ago. Out of people who lived in different houses, 54% lived in this county. Out of people who lived in different counties, 50% lived in Missouri.
90% of the 63135 zip code residents lived in the same house 1 year ago. Out of people who lived in different houses, 64% moved from this county. Out of people who lived in different houses, 24% moved from different county within same state. Out of people who lived in different houses, 7% moved from different state. Out of people who lived in different houses, 3% moved from abroad.
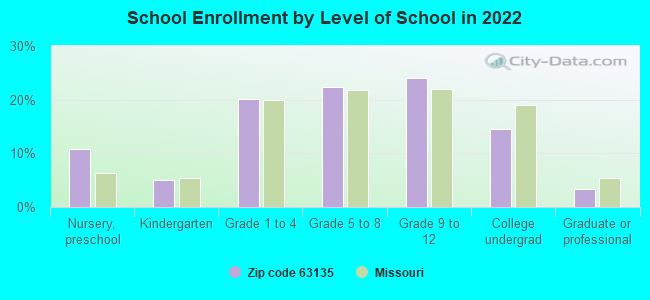
Private vs. public school enrollment:
Students in private schools in grades 1 to 8 (elementary and middle school): 302
Here:
15.7%
Missouri:
15.4%
Students in private schools in grades 9 to 12 (high school): 110
Here:
10.2%
Missouri:
13.9%
Students in private undergraduate colleges: 153
Here:
23.4%
Missouri:
22.6%
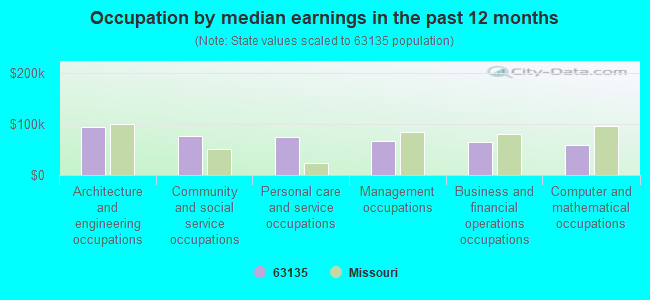
Occupation by median earnings in the past 12 months ($)
93,196Architecture and engineering occupations
76,748Community and social service occupations
75,015Personal care and service occupations
66,372Management occupations
65,199Business and financial operations occupations
58,588Computer and mathematical occupations
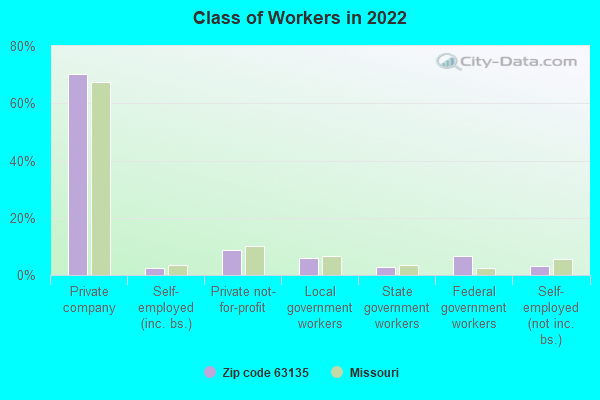
Companies with federal contracts located in this zip code:
WATSON COATINGS, INC (325 PAUL AVE in FERGUSON, MO; small business) : $199,180 in 11 contractsfrom 2002 to 2004
Contracts for Preservative and Sealing Compounds by Air Force Signed by year:2000: $0; 2001: $0; 2002: $40,050; 2003: $99,880; 2004: $59,250; 2005: $0; 2006: $0.
Biggest contracts:
$24,750 with Air Force for Preservative and Sealing Compounds. Signed on 2004-02-05. Completion date: 2004-03-05.
$21,550, same as above.Signed on 2002-07-22. Completion date: 2002-08-26.
$18,500, same as above.Signed on 2002-12-19. Completion date: 2003-01-07.
$18,160, same as above.Signed on 2003-05-27. Completion date: 2003-06-27.
Top industries in this zip code by the number of employees in 2005:
Health Care and Social Assistance: Nursing Care Facilities (100-249 employees: 1 establishment, 50-99 employees: 1 establishment)
Other Services (except Public Administration): Civic and Social Organizations (100-249: 1, 10-19: 1)
2002 - 2018 National Fire Incident Reporting System (NFIRS) incidents
According to the data from the years 2002 - 2018 the average number of fires per year is 132. The highest number of reported fire incidents - 253 took place in 2004, and the least - 6 in 2003. The data has a growing trend.
When looking into fire subcategories, the most incidents belonged to: Structure Fires (47.2%), and Outside Fires (26.7%).
Fire incident types reported to NFIRS in Zip Code 63135


 Nearest zip codes: 63140, 63136, 63121, 63134, 63033, 63133.


 According to the data from the years 2002 - 2018 the average number of fires per year is 132. The highest number of reported fire incidents - 253 took place in 2004, and the least - 6 in 2003. The data has a growing trend.
 When looking into fire subcategories, the most incidents belonged to: Structure Fires (47.2%), and Outside Fires (26.7%).