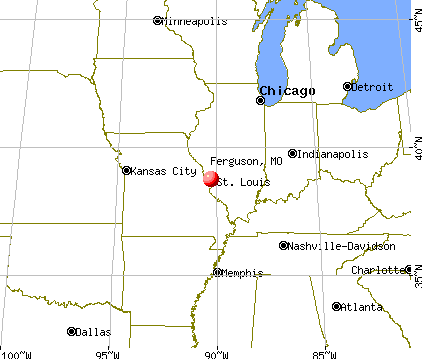
Ferguson, Missouri

Ferguson: O. T. Hodge Chile Parlor, Ferguson, MO
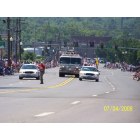
Ferguson: The Start of the Fourth of July Parade
- add
your
Submit your own pictures of this city and show them to the world
- OSM Map
- General Map
- Google Map
- MSN Map
Population change since 2000: -19.0%
 |
| Males: 8,405 | |
| Females: 9,738 |
| Median resident age: | 34.9 years |
| Missouri median age: | 39.1 years |
Zip codes: 63031.
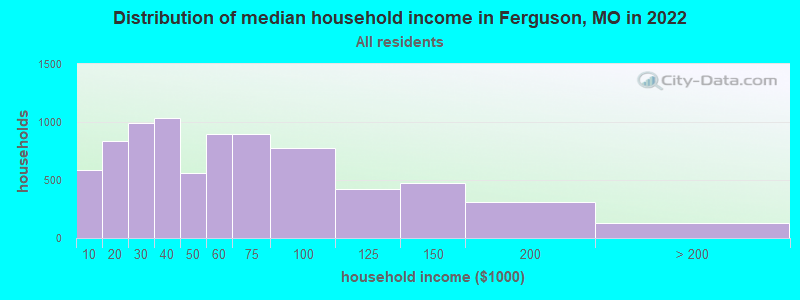
| Ferguson: | $48,244 |
| MO: | $64,811 |
Estimated per capita income in 2022: $26,792 (it was $17,661 in 2000)
Ferguson city income, earnings, and wages data
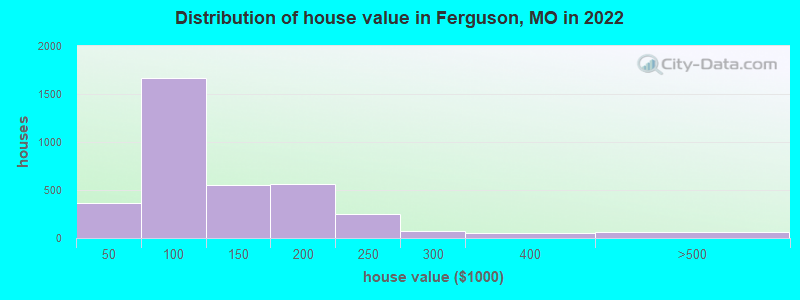
Estimated median house or condo value in 2022: $97,284 (it was $64,600 in 2000)
| Ferguson: | $97,284 |
| MO: | $221,200 |
Mean prices in 2022: all housing units: $358,067; detached houses: $366,962; townhouses or other attached units: $296,938; in 2-unit structures: $604,192; in 3-to-4-unit structures: $176,513; in 5-or-more-unit structures: $232,155; mobile homes: $53,172; occupied boats, rvs, vans, etc.: $57,482
Median gross rent in 2022: $1,048.
(7.6% for White Non-Hispanic residents, 26.0% for Black residents, 0.5% for Hispanic or Latino residents, 100.0% for American Indian residents, 17.7% for two or more races residents)
Detailed information about poverty and poor residents in Ferguson, MO
Compare current foreclosures near Ferguson, MO:
| Photo | Address | Area | Beds / Baths | Price | Details |
|---|---|---|---|---|---|

|
#1
Saint Charles St Apt 801
Saint Louis, MO 63101
|
1,688 sq. feet
|
2 baths 1 beds |
$154,900
|
show details |

|
#2
Velma Ave
South Roxana, IL 62087
|
1,008 sq. feet
|
1 baths 3 beds |
$39,900
|
show details |

|
#3
Old Jamestown Rd
Florissant, MO 63034
|
1,440 sq. feet
|
2 baths 3 beds |
$112,300
|
show details |

|
#4
Ross Ave
Saint Louis, MO 63146
|
1,520 sq. feet
|
2 baths 3 beds |
$218,400
|
show details |

|
#5
Ridge Ave
Saint Louis, MO 63113
|
1,868 sq. feet
|
2 baths 6 beds |
$114,900
|
show details |

|
#6
Concord Pl
Saint Louis, MO 63147
|
768 sq. feet
|
1 baths 2 beds |
$62,000
|
show details |

|
#7
3rd St
Madison, IL 62060
|
1,232 sq. feet
|
1 baths 3 beds |
$24,900
|
show details |

|
#8
Grants Pkwy
Florissant, MO 63031
|
986 sq. feet
|
1 baths 3 beds |
$167,000
|
show details |

|
#9
Canton Ave
Saint Louis, MO 63130
|
1,516 sq. feet
|
1 baths 3 beds |
$179,900
|
show details |

|
#10
Adelaide Ave
Saint Louis, MO 63115
|
1,890 sq. feet
|
1 baths 4 beds |
$27,500
|
show details |
| Photo | Address | Area | Beds / Baths | Price | Details |
|---|---|---|---|---|---|

|
#11
Shelburne Dr
Saint Charles, MO 63301
|
1,436 sq. feet
|
2 baths 3 beds |
$219,900
|
show details |

|
#12
Bagley Dr
Saint Louis, MO 63136
|
982 sq. feet
|
1 baths 2 beds |
$125,000
|
show details |

|
#13
Miami St
Saint Louis, MO 63118
|
3,732 sq. feet
|
4 baths 4 beds |
$89,900
|
show details |

|
#14
Deer St
Saint Louis, MO 63113
|
1,646 sq. feet
|
1 baths 3 beds |
$250,000
|
show details |

|
#15
Walnut Dr
Cottage Hills, IL 62018
|
657 sq. feet
|
1 baths 2 beds |
$35,000
|
show details |

|
#16
Louisiana Ave
Saint Louis, MO 63118
|
2,360 sq. feet
|
2 baths 2 beds |
$187,000
|
show details |

|
#17
Jerries Ln
Saint Louis, MO 63136
|
1,380 sq. feet
|
1 baths 3 beds |
$229,000
|
show details |

|
#18
Hillcrest Ave
Alton, IL 62002
|
1,283 sq. feet
|
1 baths 2 beds |
$133,000
|
show details |

|
#19
Hannover Ave
Saint Louis, MO 63123
|
912 sq. feet
|
1 baths 2 beds |
$159,900
|
show details |

|
#20
Rosewood Ave
Saint Louis, MO 63120
|
1,152 sq. feet
|
1 baths 2 beds |
$129,000
|
show details |
| Photo | Address | Area | Beds / Baths | Price | Details |
|---|---|---|---|---|---|

|
#21
Hodiamont Ave # E4
Saint Louis, MO 63112
|
1 sq. feet
|
2 baths 2 beds |
$175,000
|
show details |

|
#22
Grand Ave
Wood River, IL 62095
|
1,320 sq. feet
|
1 baths 4 beds |
$157,000
|
show details |

|
#23
E Milton Ave
Saint Louis, MO 63114
|
1,325 sq. feet
|
1 baths 2 beds |
$188,000
|
show details |

|
#24
Willow Wren Ct Unit 308
Florissant, MO 63033
|
955 sq. feet
|
2 baths 2 beds |
$78,000
|
show details |

|
#25
Eula Ave
Wood River, IL 62095
|
1,040 sq. feet
|
1 baths 2 beds |
$129,900
|
show details |

|
#26
Kingston Dr
Saint Louis, MO 63125
|
1,108 sq. feet
|
1 baths 2 beds |
$189,900
|
show details |

|
#27
Bender Ave
East Alton, IL 62024
|
1,400 sq. feet
|
2 baths 2 beds |
$179,000
|
show details |

|
#28
Idaho Ave
Saint Louis, MO 63111
|
979 sq. feet
|
1 baths 2 beds |
$132,900
|
show details |

|
#29
Cricket Ct
Florissant, MO 63033
|
1,557 sq. feet
|
2 baths 4 beds |
$90,250
|
show details |

|
#30
Hamilton Ave
Saint Louis, MO 63136
|
832 sq. feet
|
1 baths 2 beds |
$17,900
|
show details |
| Photo | Address | Area | Beds / Baths | Price | Details |
|---|---|---|---|---|---|

|
#31
Saint Norbert Dr
East Saint Louis, IL 62206
|
1,232 sq. feet
|
1 baths 3 beds |
$1
|
show details |

|
#32
Majella Dr
Bridgeton, MO 63044
|
- sq. feet
|
1 baths 3 beds |
$88,400
|
show details |

|
#33
Oregon Ave
Saint Louis, MO 63118
|
1,782 sq. feet
|
2 baths - beds |
$12,000
|
show details |

|
#34
Edwards St
Granite City, IL 62040
|
828 sq. feet
|
- baths 2 beds |
$39,900
|
show details |

|
#35
Bexley Station Dr # 8j
Saint Louis, MO 63123
|
951 sq. feet
|
2 baths 2 beds |
show details | |

|
#36
S Spring Ave
Saint Louis, MO 63116
|
1,592 sq. feet
|
1 baths 3 beds |
show details | |

|
#37
Grover St
Saint Louis, MO 63112
|
792 sq. feet
|
1 baths - beds |
$12,000
|
show details |

|
#38
Paris Ave
Saint Louis, MO 63115
|
1,650 sq. feet
|
1 baths - beds |
$24,900
|
show details |

|
#39
Northland Pl
Saint Louis, MO 63113
|
1,736 sq. feet
|
1 baths - beds |
$23,900
|
show details |

|
#40
Summit Pl
Saint Louis, MO 63136
|
1,039 sq. feet
|
1 baths - beds |
$15,900
|
show details |
| Photo | Address | Area | Beds / Baths | Price | Details |
|---|---|---|---|---|---|

|
#41
Orleans Ln
Florissant, MO 63031
|
1,424 sq. feet
|
1 baths 3 beds |
show details | |

|
#42
W Woodbine Ave
Saint Louis, MO 63122
|
- sq. feet
|
1 baths 1 beds |
show details | |

|
#43
Lindsay Ln
Florissant, MO 63031
|
1,123 sq. feet
|
2 baths 3 beds |
show details | |

|
#44
Jennings Station Rd
Saint Louis, MO 63136
|
3,188 sq. feet
|
4 baths 4 beds |
show details | |

|
#45
Sheridan Ave
Granite City, IL 62040
|
1,124 sq. feet
|
1 baths 3 beds |
show details | |

|
#46
Hadfield Ln
Caseyville, IL 62232
|
- sq. feet
|
- baths 2 beds |
$42,500
|
show details |

|
#47
Edwards St
Granite City, IL 62040
|
1,202 sq. feet
|
1 baths 3 beds |
show details | |

|
#48
N Main St
Caseyville, IL 62232
|
720 sq. feet
|
1 baths 2 beds |
show details | |

|
#49
Taylor Ave
Bridgeton, MO 63044
|
2,252 sq. feet
|
3 baths 4 beds |
show details | |

|
Check over 1 million property listings on Foreclosure.com!
|
browse all offers | |||


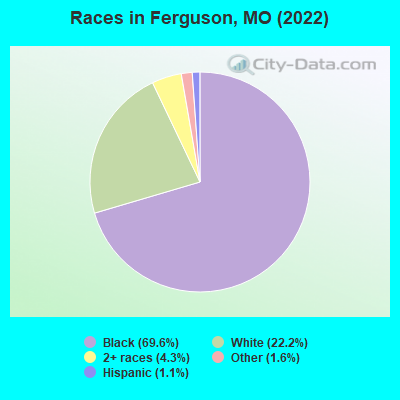
- 12,79569.6%Black alone
- 4,08222.2%White alone
- 7884.3%Two or more races
- 2991.6%Other race alone
- 1991.1%Hispanic
- 170.09%Asian alone
- 60.03%American Indian alone
Races in Ferguson detailed stats: ancestries, foreign born residents, place of birth
According to our research of Missouri and other state lists, there were 32 registered sex offenders living in Ferguson, Missouri as of April 26, 2024.
The ratio of all residents to sex offenders in Ferguson is 656 to 1.
The ratio of registered sex offenders to all residents in this city is lower than the state average.
Type |
2009 |
2010 |
2011 |
2012 |
2013 |
2014 |
2015 |
2016 |
2017 |
2018 |
2019 |
2020 |
2021 |
2022 |
|---|---|---|---|---|---|---|---|---|---|---|---|---|---|---|
| Murders (per 100,000) | 3 (14.4) | 0 (0.0) | 5 (23.5) | 2 (9.4) | 2 (9.5) | 2 (9.5) | 5 (23.7) | 9 (42.8) | 11 (52.9) | 2 (9.7) | 4 (19.4) | 7 (34.2) | 9 (44.1) | 9 (49.5) |
| Rapes (per 100,000) | 3 (14.4) | 4 (18.9) | 6 (28.2) | 3 (14.1) | 3 (14.2) | 2 (9.5) | 8 (38.0) | 7 (33.3) | 5 (24.1) | 4 (19.4) | 10 (48.4) | 6 (29.3) | 12 (58.9) | 1 (5.5) |
| Robberies (per 100,000) | 52 (249.8) | 45 (212.2) | 45 (211.5) | 38 (178.9) | 54 (255.7) | 51 (241.8) | 82 (389.4) | 68 (323.3) | 65 (312.7) | 46 (222.6) | 42 (203.3) | 30 (146.7) | 25 (122.6) | 25 (137.5) |
| Assaults (per 100,000) | 55 (264.2) | 45 (212.2) | 47 (220.9) | 37 (174.2) | 42 (198.9) | 60 (284.5) | 95 (451.1) | 86 (408.9) | 69 (331.9) | 77 (372.6) | 47 (227.4) | 98 (479.1) | 135 (662.2) | 111 (610.6) |
| Burglaries (per 100,000) | 302 (1,451) | 357 (1,684) | 263 (1,236) | 247 (1,163) | 300 (1,421) | 326 (1,546) | 366 (1,738) | 292 (1,388) | 276 (1,328) | 149 (721.1) | 178 (861.4) | 182 (889.8) | 115 (564.1) | 61 (335.6) |
| Thefts (per 100,000) | 702 (3,373) | 647 (3,051) | 649 (3,050) | 699 (3,291) | 749 (3,547) | 628 (2,978) | 520 (2,469) | 684 (3,252) | 547 (2,631) | 647 (3,131) | 694 (3,358) | 684 (3,344) | 472 (2,315) | 371 (2,041) |
| Auto thefts (per 100,000) | 167 (802.3) | 117 (551.8) | 85 (399.4) | 95 (447.3) | 77 (364.7) | 73 (346.1) | 119 (565.1) | 115 (546.8) | 116 (558.0) | 150 (725.9) | 129 (624.3) | 196 (958.2) | 115 (564.1) | 292 (1,606) |
| Arson (per 100,000) | 2 (9.6) | 1 (4.7) | 0 (0.0) | 0 (0.0) | 0 (0.0) | 12 (56.9) | 6 (28.5) | 1 (4.8) | 0 (0.0) | 0 (0.0) | 0 (0.0) | 4 (19.6) | 3 (14.7) | 3 (16.5) |
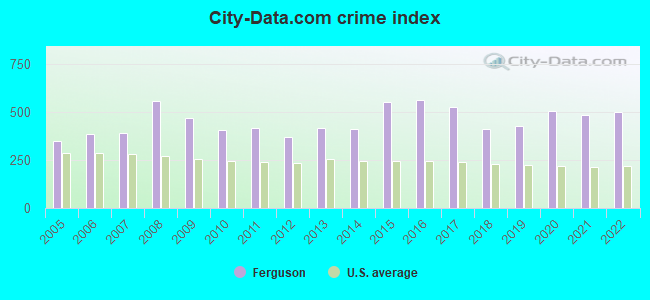
| City-Data.com crime index | 468.8 | 405.3 | 417.6 | 367.5 | 417.3 | 411.0 | 550.5 | 562.0 | 528.1 | 410.0 | 428.5 | 504.4 | 481.9 | 500.4 |
The City-Data.com crime index weighs serious crimes and violent crimes more heavily. Higher means more crime, U.S. average is 246.1. It adjusts for the number of visitors and daily workers commuting into cities.
Crime rate in Ferguson detailed stats: murders, rapes, robberies, assaults, burglaries, thefts, arson
Full-time law enforcement employees in 2021, including police officers: 41 (30 officers - 23 male; 7 female).
| Officers per 1,000 residents here: | 1.47 |
| Missouri average: | 2.54 |
 Recent articles from our blog. Our writers, many of them Ph.D. graduates or candidates, create easy-to-read articles on a wide variety of topics.

 | POLL: Ferguson Cops, Curfew & Protesers (900 replies) |
| Thoughts on the events in Ferguson (59 replies) |
| Missouri Outlaw History (3407 replies) |
| Maybe a move to St Louis... Tell me about it. (14 replies) |
| Could McCaskill win re-election? (192 replies) |
| Justice Department's petty allegations against Ferguson PD (36 replies) |
Latest news from Ferguson, MO collected exclusively by city-data.com from local newspapers, TV, and radio stations
Ancestries: American (7.1%), German (3.6%), African (3.4%), Irish (1.8%).
Current Local Time: CST time zone
Incorporated in 1894
Elevation: 508 feet
Land area: 6.19 square miles.
Population density: 2,932 people per square mile (average).
163 residents are foreign born
| This city: | 0.9% |
| Missouri: | 4.2% |
Median real estate property taxes paid for housing units with mortgages in 2022: $1,487 (1.4%)
Median real estate property taxes paid for housing units with no mortgage in 2022: $1,469 (1.7%)
Nearest city with pop. 50,000+: Florissant, MO  (3.9 miles , pop. 50,497).
Nearest city with pop. 200,000+: St. Louis, MO (8.7 miles , pop. 348,189).
Nearest city with pop. 1,000,000+: Chicago, IL (254.7 miles , pop. 2,896,016).
Nearest cities:
), ), ), ), )Latitude: 38.75 N, Longitude: 90.30 W
Daytime population change due to commuting: -969 (-5.3%)
Workers who live and work in this city: 1,876 (23.1%)
Property values in Ferguson, MO

Ferguson, Missouri accommodation & food services, waste management - Economy and Business Data
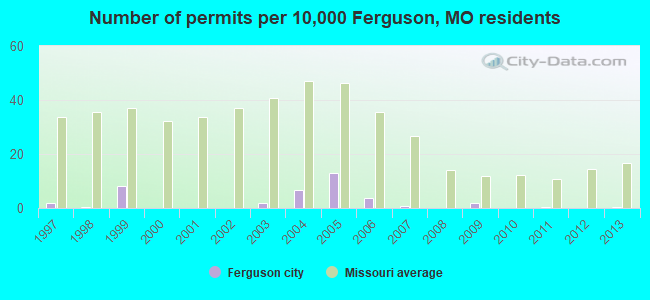
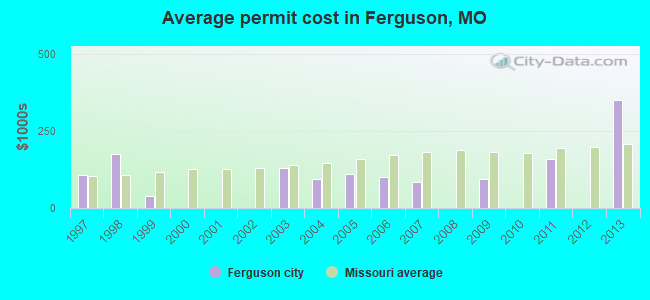
Single-family new house construction building permits:
- 2013: 1 building, cost: $350,000
- 2011: 1 building, cost: $160,000
- 2009: 4 buildings, average cost: $95,000
- 2007: 2 buildings, average cost: $85,000
- 2006: 8 buildings, average cost: $101,300
- 2005: 29 buildings, average cost: $109,100
- 2004: 15 buildings, average cost: $92,500
- 2003: 4 buildings, average cost: $131,300
- 1999: 18 buildings, average cost: $40,200
- 1998: 1 building, cost: $174,100
- 1997: 4 buildings, average cost: $106,000
| Here: | 2.7% |
| Missouri: | 2.8% |
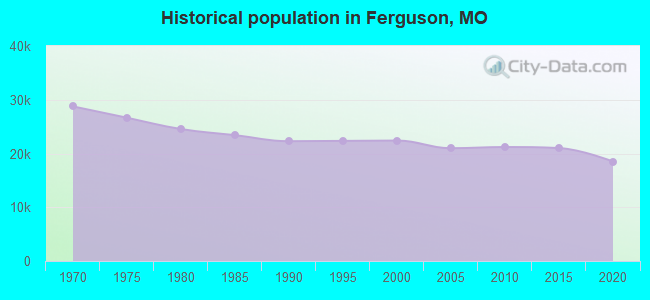
Population change in the 1990s: +128 (+0.6%).
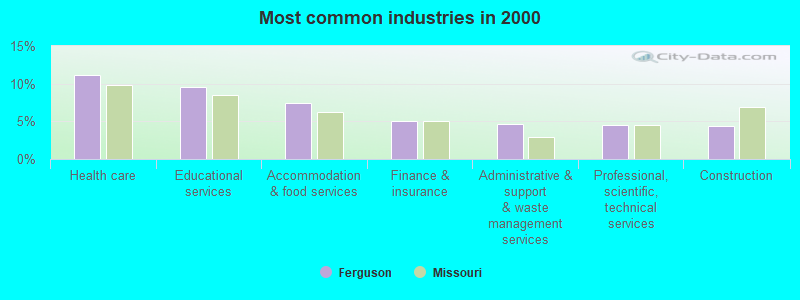
- Health care (11.2%)
- Educational services (9.6%)
- Accommodation & food services (7.5%)
- Finance & insurance (5.1%)
- Administrative & support & waste management services (4.6%)
- Professional, scientific, technical services (4.5%)
- Construction (4.4%)
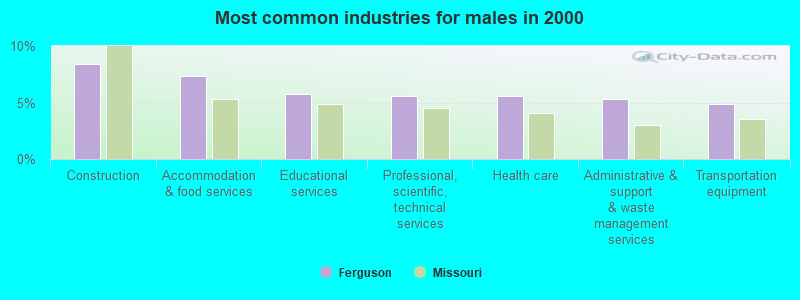
- Construction (8.4%)
- Accommodation & food services (7.4%)
- Educational services (5.8%)
- Professional, scientific, technical services (5.6%)
- Health care (5.6%)
- Administrative & support & waste management services (5.3%)
- Transportation equipment (4.9%)
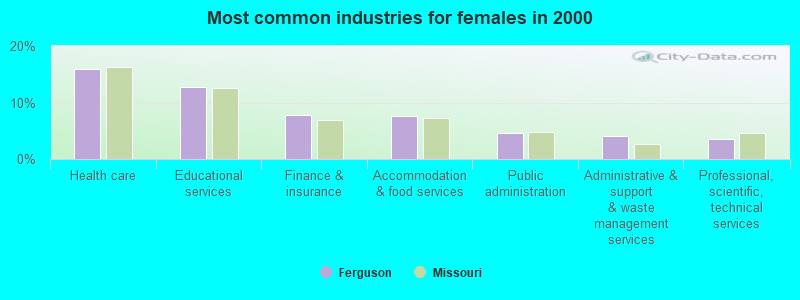
- Health care (15.9%)
- Educational services (12.8%)
- Finance & insurance (7.7%)
- Accommodation & food services (7.6%)
- Public administration (4.6%)
- Administrative & support & waste management services (4.0%)
- Professional, scientific, technical services (3.5%)
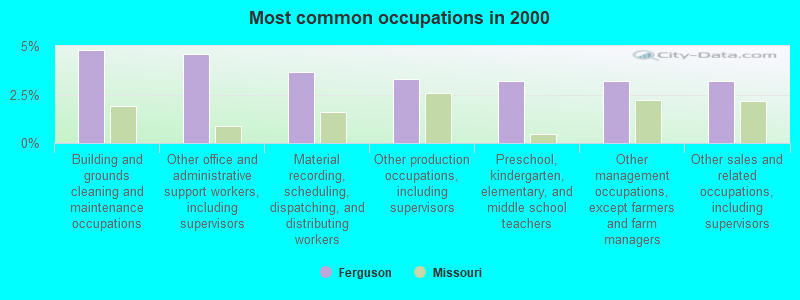
- Building and grounds cleaning and maintenance occupations (4.8%)
- Other office and administrative support workers, including supervisors (4.6%)
- Material recording, scheduling, dispatching, and distributing workers (3.6%)
- Other production occupations, including supervisors (3.3%)
- Preschool, kindergarten, elementary, and middle school teachers (3.2%)
- Other management occupations, except farmers and farm managers (3.2%)
- Other sales and related occupations, including supervisors (3.2%)
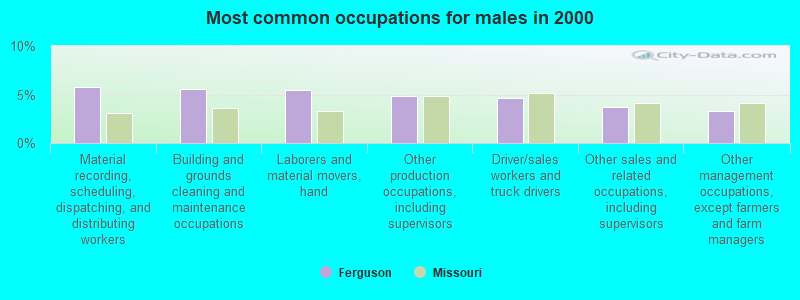
- Material recording, scheduling, dispatching, and distributing workers (5.8%)
- Building and grounds cleaning and maintenance occupations (5.5%)
- Laborers and material movers, hand (5.5%)
- Other production occupations, including supervisors (4.8%)
- Driver/sales workers and truck drivers (4.6%)
- Other sales and related occupations, including supervisors (3.7%)
- Other management occupations, except farmers and farm managers (3.3%)
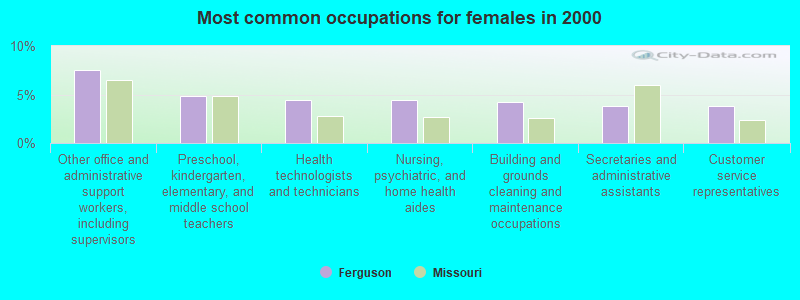
- Other office and administrative support workers, including supervisors (7.5%)
- Preschool, kindergarten, elementary, and middle school teachers (4.8%)
- Health technologists and technicians (4.4%)
- Nursing, psychiatric, and home health aides (4.4%)
- Building and grounds cleaning and maintenance occupations (4.2%)
- Secretaries and administrative assistants (3.9%)
- Customer service representatives (3.8%)
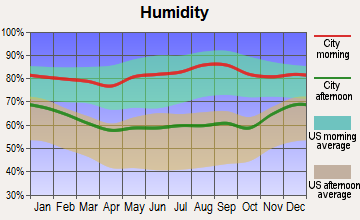
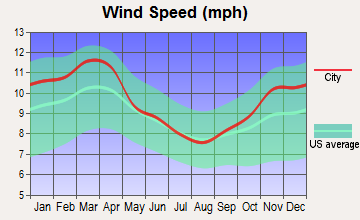
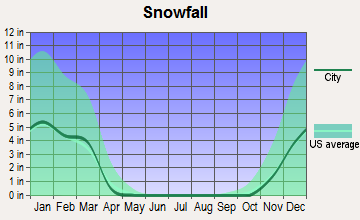
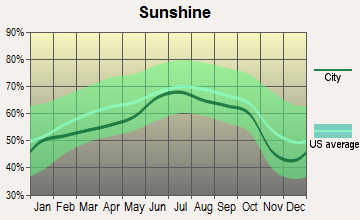
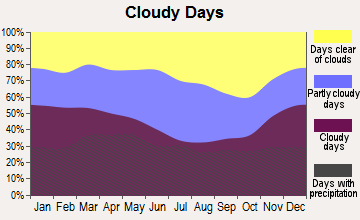
Average climate in Ferguson, Missouri
Based on data reported by over 4,000 weather stations


|
|


(lower is better)
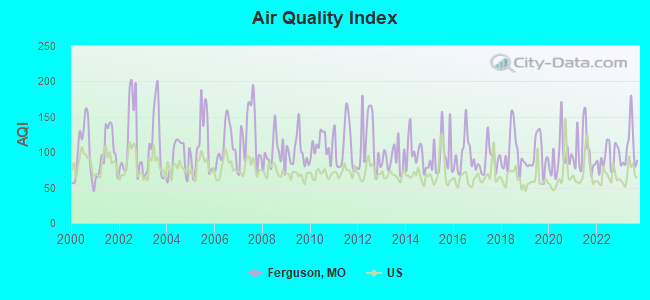
Air Quality Index (AQI) level in 2023 was 105. This is significantly worse than average.
| City: | 105 |
| U.S.: | 73 |
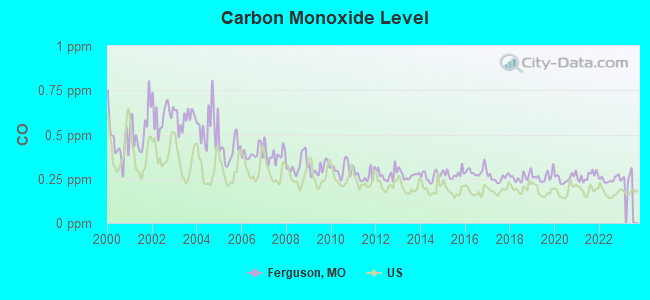
Carbon Monoxide (CO) [ppm] level in 2022 was 0.246. This is about average. Closest monitor was 1.5 miles away from the city center.
| City: | 0.246 |
| U.S.: | 0.251 |
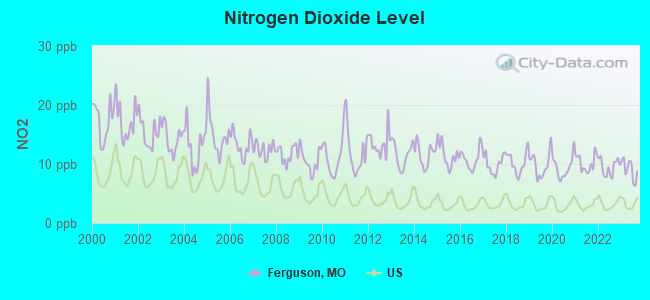
Nitrogen Dioxide (NO2) [ppb] level in 2023 was 9.08. This is significantly worse than average. Closest monitor was 1.5 miles away from the city center.
| City: | 9.08 |
| U.S.: | 5.11 |
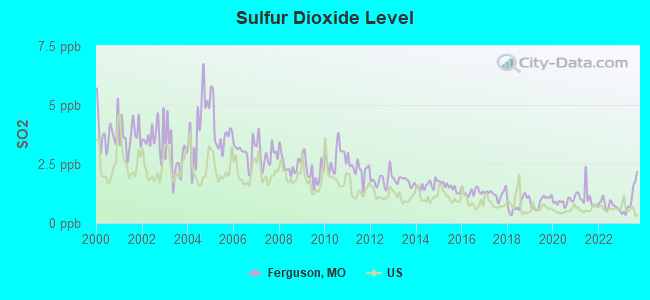
Sulfur Dioxide (SO2) [ppb] level in 2023 was 0.999. This is significantly better than average. Closest monitor was 1.5 miles away from the city center.
| City: | 0.999 |
| U.S.: | 1.515 |
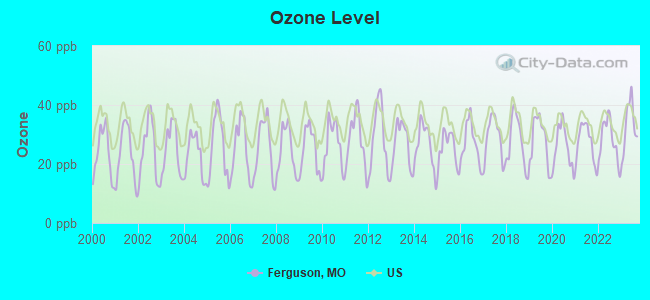
Ozone [ppb] level in 2023 was 33.1. This is about average. Closest monitor was 1.5 miles away from the city center.
| City: | 33.1 |
| U.S.: | 33.3 |
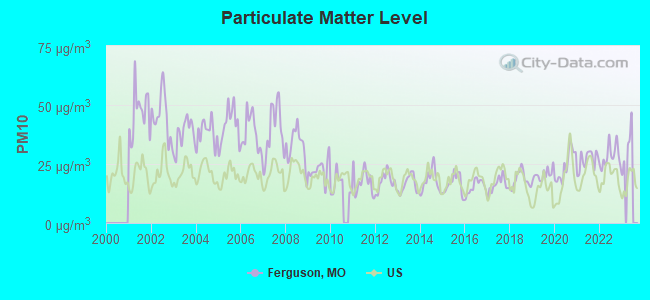
Particulate Matter (PM10) [µg/m3] level in 2022 was 28.3. This is significantly worse than average. Closest monitor was 1.5 miles away from the city center.
| City: | 28.3 |
| U.S.: | 19.2 |
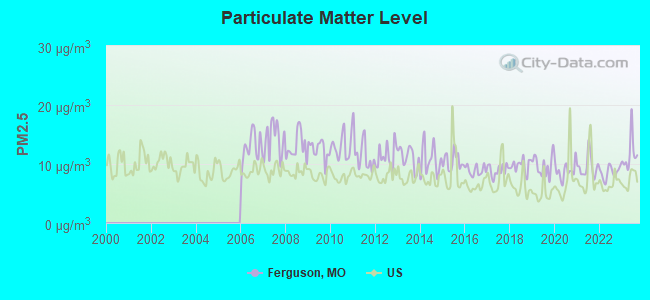
Particulate Matter (PM2.5) [µg/m3] level in 2023 was 11.7. This is significantly worse than average. Closest monitor was 1.5 miles away from the city center.
| City: | 11.7 |
| U.S.: | 8.1 |
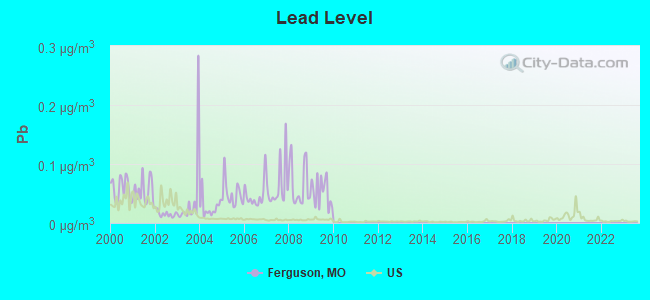
Lead (Pb) [µg/m3] level in 2009 was 0.0523. This is significantly worse than average. Closest monitor was 1.5 miles away from the city center.
| City: | 0.0523 |
| U.S.: | 0.0093 |
Tornado activity:
Ferguson-area historical tornado activity is slightly above Missouri state average. It is 78% greater than the overall U.S. average.
On 4/3/1981, a category F4 (max. wind speeds 207-260 mph) tornado 9.2 miles away from the Ferguson city center injured 32 people and caused between $5,000,000 and $50,000,000 in damages.
On 2/10/1959, a category F4 tornado 9.5 miles away from the city center killed 21 people and injured 345 people and caused between $5,000,000 and $50,000,000 in damages.
Earthquake activity:
Ferguson-area historical earthquake activity is significantly above Missouri state average. It is 308% greater than the overall U.S. average.On 4/18/2008 at 09:36:59, a magnitude 5.4 (5.1 MB, 4.8 MS, 5.4 MW, 5.2 MW, Class: Moderate, Intensity: VI - VII) earthquake occurred 131.9 miles away from Ferguson center
On 4/18/2008 at 09:36:59, a magnitude 5.2 (5.2 MW, Depth: 8.9 mi) earthquake occurred 131.9 miles away from the city center
On 6/10/1987 at 23:48:54, a magnitude 5.1 (4.9 MB, 4.4 MS, 4.6 MS, 5.1 LG) earthquake occurred 130.1 miles away from the city center
On 9/26/1990 at 13:18:51, a magnitude 5.0 (4.7 MB, 4.8 LG, 5.0 LG, Depth: 7.7 mi) earthquake occurred 116.8 miles away from the city center
On 6/18/2002 at 17:37:15, a magnitude 5.0 (4.3 MB, 4.6 MW, 5.0 LG) earthquake occurred 146.2 miles away from the city center
On 5/4/1991 at 01:18:54, a magnitude 5.0 (4.4 MB, 4.6 LG, 5.0 LG, Depth: 3.1 mi) earthquake occurred 153.1 miles away from the city center
Magnitude types: regional Lg-wave magnitude (LG), body-wave magnitude (MB), surface-wave magnitude (MS), moment magnitude (MW)
Natural disasters:
The number of natural disasters in St. Louis County (2) is a lot smaller than the US average (15).Causes of natural disasters: Flood: 1, Storm: 1, Tornado: 1, Wind: 1, Other: 1 (Note: some incidents may be assigned to more than one category).
Hospitals and medical centers in Ferguson:
Heliports located in Ferguson:
Amtrak stations near Ferguson:
- 10 miles: ST. LOUIS (550 S. 16TH ST.) . Services: ticket office, partially wheelchair accessible, enclosed waiting area, public restrooms, public payphones, vending machines, free short-term parking, free long-term parking, call for car rental service, taxi stand.
- 13 miles: KIRKWOOD (110 W. ARGONNE RD.) . Services: ticket office, partially wheelchair accessible, enclosed waiting area, public restrooms, public payphones, free short-term parking, free long-term parking, taxi stand, intercity bus service, public transit connection.
- 15 miles: ALTON (3400 COLLEGE AVE.) . Services: ticket office, fully wheelchair accessible, public payphones, vending machines, free short-term parking, free long-term parking, call for taxi service.
Colleges/universities with over 2000 students nearest to Ferguson:
- University of Missouri-St Louis (about 3 miles; Saint Louis, MO; Full-time enrollment: 10,322)
- Washington University in St Louis (about 7 miles; Saint Louis, MO; FT enrollment: 10,823)
- Ranken Technical College (about 7 miles; Saint Louis, MO; FT enrollment: 2,134)
- Saint Louis University (about 9 miles; Saint Louis, MO; FT enrollment: 11,606)
- Saint Louis Community College (about 11 miles; Saint Louis, MO; FT enrollment: 18,019)
- Webster University (about 12 miles; Saint Louis, MO; FT enrollment: 12,406)
- Missouri Baptist University (about 12 miles; Saint Louis, MO; FT enrollment: 2,898)
Public high school in Ferguson:
- MCCLUER SOUTH-BERKELEY HIGH (Students: 719, Location: 201 BROTHERTON LN, Grades: 9-12)
Public elementary/middle schools in Ferguson:
- FERGUSON MIDDLE (Students: 720, Location: 701 JANUARY AVE, Grades: 7-8)
- WALNUT GROVE ELEM. (Students: 501, Location: 1248 N FLORISSANT RD, Grades: KG-6)
- JOHNSON WABASH ELEM. (Students: 458, Location: 685 JANUARY, Grades: KG-6)
- GRIFFITH ELEM. (Students: 349, Location: 200 DAY DR, Grades: KG-6)
- LEE HAMILTON ELEM. (Students: 326, Location: 401 POWELL AVE, Grades: KG-6)
- CENTRAL ELEM. (Students: 297, Location: 201 WESLEY AVE, Grades: KG-6)
- VOGT ELEM. (Location: 200 CHURCH ST, Grades: KG-6)
Private elementary/middle school in Ferguson:
Library in Ferguson:
- FERGUSON MUNICIPAL PUBLIC LIBRARY DISTRICT (Operating income: $494,473; Location: 35 N. FLORISSANT RD.; 76,886 books; 8,059 e-books; 2,048 audio materials; 4,064 video materials; 1 local licensed databases; 14 state licensed databases; 2 other licensed databases; 136 print serial subscriptions; 11 electronic serial subscriptions)
Points of interest:
Notable locations in Ferguson: Northland Golf Club (A), Ferguson Fire Department Station 2 (B), Happy Go Lucky Child Care Center (C), Ferguson Fire Department Station 1 (D). Display/hide their locations on the map
Shopping Center: Ferguson Square Shopping Center (1). Display/hide its location on the map
Churches in Ferguson include: Saint Joseph Convent (A), Saint Stephens Episcopal Church (B), Saint John and James Catholic Church (C), Oak Hill Baptist Church (D), North Hills United Methodist Church (E), Memorial Tabernacle Baptist Church (F), Immanuel United Church of Christ (G), Great Commission Church of God (H), First Presbyterian Church of Ferguson (I). Display/hide their locations on the map
Park in Ferguson: Jeske Park (1). Display/hide its location on the map
Birthplace of: Tyron Woodley - Martial artist.
| This city: | 2.6 people |
| Missouri: | 2.5 people |
| This city: | 67.1% |
| Whole state: | 65.3% |
| This city: | 7.4% |
| Whole state: | 6.7% |
Likely homosexual households (counted as self-reported same-sex unmarried-partner households)
- Lesbian couples: 0.4% of all households
- Gay men: 0.2% of all households
People in group quarters in Ferguson in 2010:
- 189 people in nursing facilities/skilled-nursing facilities
- 3 people in residential treatment centers for adults
- 2 people in other noninstitutional facilities
7 people in religious group quarters in 2000
Banks with branches in Ferguson (2011 data):
- UMB Bank, National Association: Ferguson Facility at 1 Church Street, branch established on 1920/06/09; Central City Branch at 10751 Old Hall's Ferry Road, branch established on 1973/12/26. Info updated 2007/12/13: Bank assets: $11,205.9 mil, Deposits: $8,538.8 mil, headquarters in Kansas City, MO, positive income, 107 total offices, Holding Company: Umb Financial Corporation
- U.S. Bank National Association: Ferguson Branch at 201 North Florissant Road, branch established on 1889/01/01. Info updated 2012/01/30: Bank assets: $330,470.8 mil, Deposits: $236,091.5 mil, headquarters in Cincinnati, OH, positive income, 3121 total offices, Holding Company: U.S. Bancorp
For population 15 years and over in Ferguson:
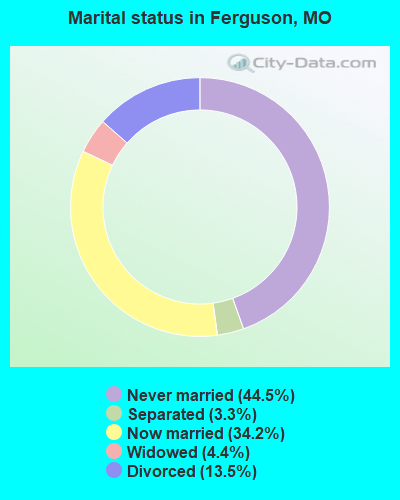
- Never married: 44.5%
- Now married: 34.2%
- Separated: 3.3%
- Widowed: 4.4%
- Divorced: 13.5%
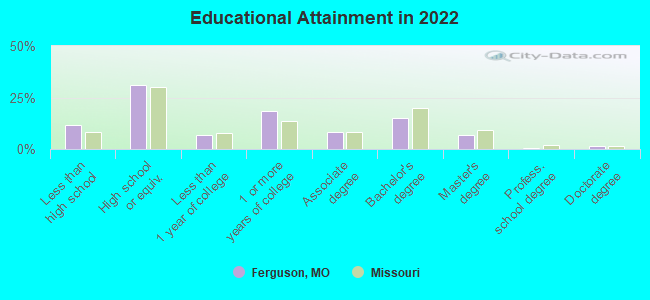
For population 25 years and over in Ferguson:
- High school or higher: 88.7%
- Bachelor's degree or higher: 22.1%
- Graduate or professional degree: 8.1%
- Unemployed: 7.3%
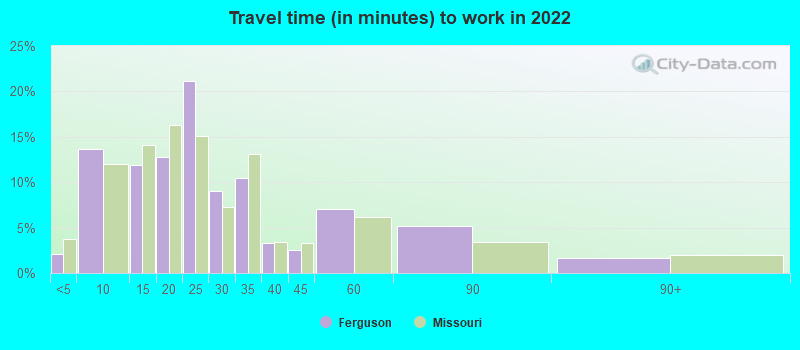
- Mean travel time to work (commute): 20.1 minutes
| Here: | 10.7 |
| Missouri average: | 11.1 |
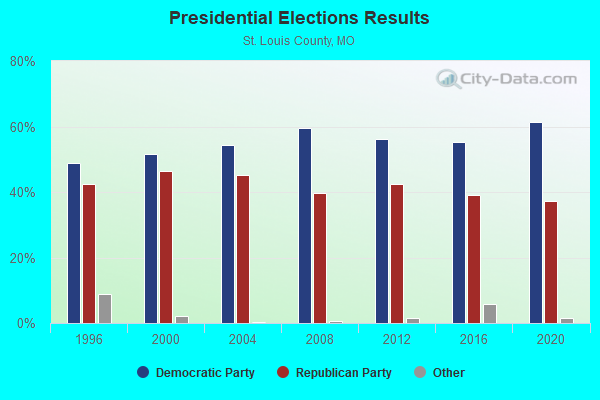
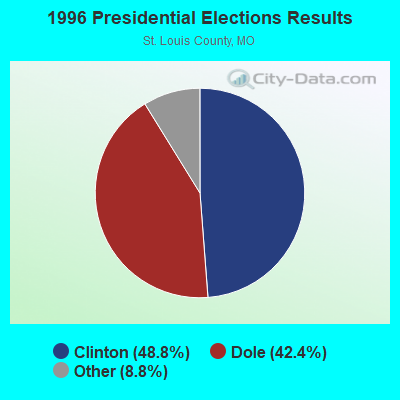
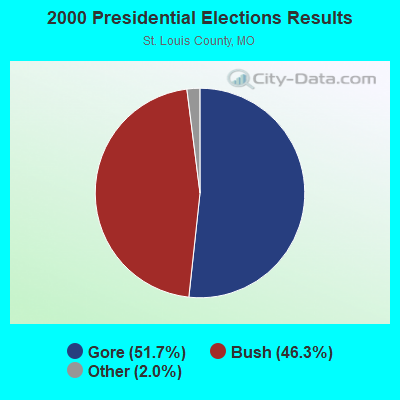
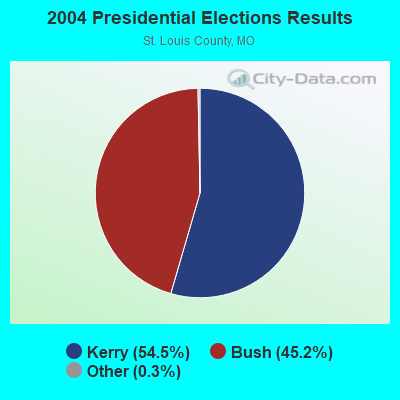
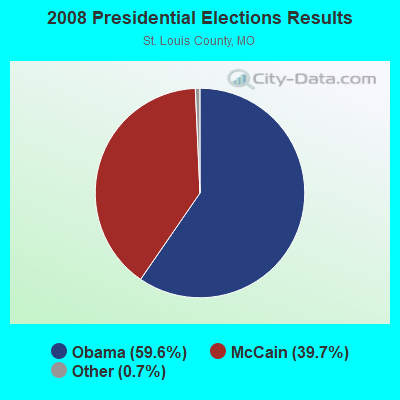
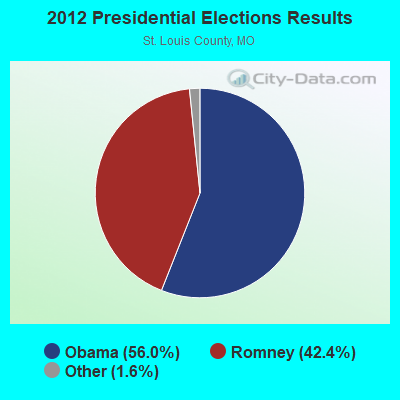
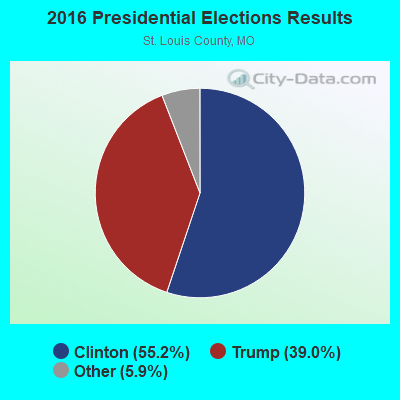
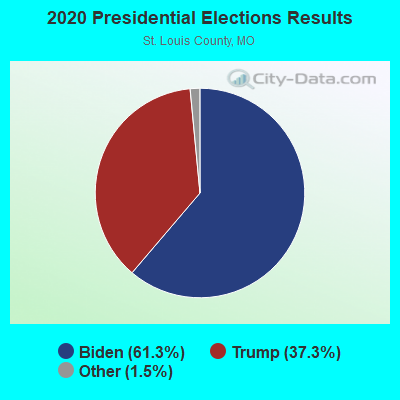
Graphs represent county-level data. Detailed 2008 Election Results
Religion statistics for Ferguson, MO (based on St. Louis County data)
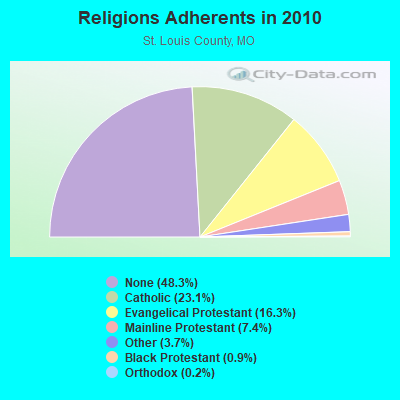
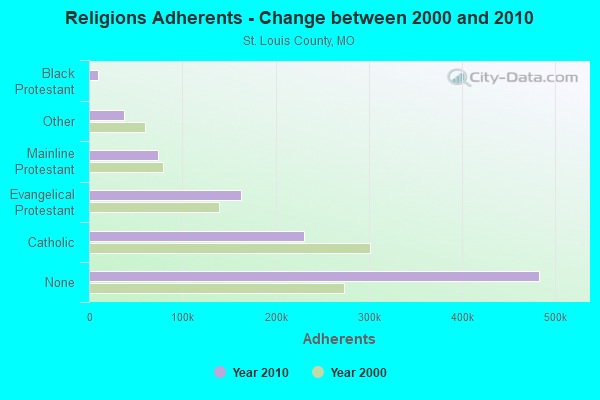
| Religion | Adherents | Congregations |
|---|---|---|
| Catholic | 230,488 | 74 |
| Evangelical Protestant | 162,614 | 384 |
| Mainline Protestant | 74,404 | 130 |
| Other | 37,156 | 87 |
| Black Protestant | 9,369 | 48 |
| Orthodox | 2,042 | 7 |
| None | 482,881 | - |
Food Environment Statistics:
| Here: | 1.77 / 10,000 pop. |
| Missouri: | 1.88 / 10,000 pop. |
| Here: | 0.09 / 10,000 pop. |
| Missouri: | 0.18 / 10,000 pop. |
| St. Louis County: | 0.50 / 10,000 pop. |
| State: | 0.60 / 10,000 pop. |
| St. Louis County: | 2.95 / 10,000 pop. |
| Missouri: | 4.34 / 10,000 pop. |
| St. Louis County: | 6.87 / 10,000 pop. |
| Missouri: | 7.37 / 10,000 pop. |
| St. Louis County: | 8.6% |
| Missouri: | 8.8% |
| St. Louis County: | 28.0% |
| Missouri: | 29.6% |
| Here: | 11.9% |
| Missouri: | 13.5% |
Health and Nutrition:
| This city: | 49.2% |
| Missouri: | 50.9% |
| Ferguson: | 47.6% |
| State: | 48.6% |
| Here: | 29.7 |
| Missouri: | 28.7 |
| Ferguson: | 19.4% |
| State: | 20.6% |
| Here: | 11.6% |
| Missouri: | 10.1% |
| Ferguson: | 6.7 |
| Missouri: | 6.8 |
| Here: | 36.9% |
| Missouri: | 34.3% |
| Ferguson: | 55.9% |
| Missouri: | 57.5% |
| This city: | 81.5% |
| Missouri: | 79.3% |
More about Health and Nutrition of Ferguson, MO Residents
| Local government employment and payroll (March 2022) | |||||
| Function | Full-time employees | Monthly full-time payroll | Average yearly full-time wage | Part-time employees | Monthly part-time payroll |
|---|---|---|---|---|---|
| Police Protection - Officers | 37 | $196,078 | $63,593 | 0 | $0 |
| Firefighters | 25 | $142,276 | $68,292 | 0 | $0 |
| Other and Unallocable | 7 | $28,132 | $48,226 | 0 | $0 |
| Streets and Highways | 7 | $28,126 | $48,216 | 0 | $0 |
| Other Government Administration | 6 | $17,757 | $35,514 | 5 | $1,350 |
| Parks and Recreation | 6 | $25,219 | $50,438 | 11 | $9,388 |
| Financial Administration | 4 | $19,376 | $58,128 | 1 | $1,934 |
| Police - Other | 3 | $14,408 | $57,632 | 0 | $0 |
| Fire - Other | 3 | $25,160 | $100,640 | 0 | $0 |
| Judicial and Legal | 2 | $6,894 | $41,364 | 0 | $0 |
| Totals for Government | 100 | $503,425 | $60,411 | 17 | $12,672 |
Ferguson government finances - Expenditure in 2021 (per resident):
- Construction - Regular Highways: $1,919,000 ($105.77)
- Current Operations - Police Protection: $4,109,000 ($226.48)
Parks and Recreation: $3,367,000 ($185.58)
Sewerage: $3,293,000 ($181.50)
Water Utilities: $2,964,000 ($163.37)
Local Fire Protection: $2,494,000 ($137.46)
Regular Highways: $1,694,000 ($93.37)
General - Other: $1,300,000 ($71.65)
Solid Waste Management: $1,230,000 ($67.79)
Protective Inspection and Regulation - Other: $915,000 ($50.43)
Central Staff Services: $843,000 ($46.46)
Air Transportation: $421,000 ($23.20)
Judicial and Legal Services: $421,000 ($23.20)
Financial Administration: $298,000 ($16.43)
Miscellaneous Commercial Activities - Other: $132,000 ($7.28)
Natural Resources - Other: $96,000 ($5.29)
- General - Interest on Debt: $72,000 ($3.97)
- Other Capital Outlay - Water Utilities: $526,000 ($28.99)
Parks and Recreation: $497,000 ($27.39)
General - Other: $244,000 ($13.45)
Police Protection: $181,000 ($9.98)
Regular Highways: $95,000 ($5.24)
Local Fire Protection: $93,000 ($5.13)
Sewerage: $90,000 ($4.96)
Protective Inspection and Regulation - Other: $42,000 ($2.31)
Miscellaneous Commercial Activities - Other: $12,000 ($0.66)
Air Transportation: $5,000 ($0.28)
- Total Salaries and Wages: $8,105,000 ($446.73)
- Water Utilities - Interest on Debt: $449,000 ($24.75)
Ferguson government finances - Revenue in 2021 (per resident):
- Charges - Sewerage: $4,303,000 ($237.17)
Solid Waste Management: $1,298,000 ($71.54)
Parks and Recreation: $547,000 ($30.15)
Air Transportation: $370,000 ($20.39)
Miscellaneous Commercial Activities: $70,000 ($3.86)
Other: $6,000 ($0.33)
- Local Intergovernmental - Housing and Community Development: $23,000 ($1.27)
General Local Government Support: $12,000 ($0.66)
- Miscellaneous - General Revenue - Other: $466,000 ($25.68)
Interest Earnings: $222,000 ($12.24)
Special Assessments: $97,000 ($5.35)
Fines and Forfeits: $35,000 ($1.93)
Donations From Private Sources: $6,000 ($0.33)
- Revenue - Water Utilities: $3,514,000 ($193.68)
- State Intergovernmental - Highways: $802,000 ($44.20)
Other: $87,000 ($4.80)
- Tax - General Sales and Gross Receipts: $10,828,000 ($596.81)
Public Utility License: $3,348,000 ($184.53)
Property: $2,853,000 ($157.25)
Occupation and Business License - Other: $423,000 ($23.31)
Other Selective Sales: $291,000 ($16.04)
Motor Vehicle License: $291,000 ($16.04)
Tobacco Products Sales: $156,000 ($8.60)
Other License: $81,000 ($4.46)
Alcoholic Beverage License: $38,000 ($2.09)
Ferguson government finances - Debt in 2021 (per resident):
- Long Term Debt - Beginning Outstanding - Unspecified Public Purpose: $9,656,000 ($532.22)
Outstanding Unspecified Public Purpose: $6,198,000 ($341.62)
Retired Unspecified Public Purpose: $3,458,000 ($190.60)
Ferguson government finances - Cash and Securities in 2021 (per resident):
- Other Funds - Cash and Securities: $20,812,000 ($1147.11)
5.97% of this county's 2021 resident taxpayers lived in other counties in 2020 ($70,859 average adjusted gross income)
| Here: | 5.97% |
| Missouri average: | 7.67% |
0.01% of residents moved from foreign countries ($97 average AGI)
St. Louis County: 0.01% Missouri average: 0.02%
Top counties from which taxpayers relocated into this county between 2020 and 2021:
| from St. Louis city, MO | |
| from St. Charles County, MO | |
| from Jefferson County, MO |
6.59% of this county's 2020 resident taxpayers moved to other counties in 2021 ($77,630 average adjusted gross income)
| Here: | 6.59% |
| Missouri average: | 7.51% |
0.01% of residents moved to foreign countries ($63 average AGI)
St. Louis County: 0.01% Missouri average: 0.01%
Top counties to which taxpayers relocated from this county between 2020 and 2021:
| to St. Louis city, MO | |
| to St. Charles County, MO | |
| to Jefferson County, MO |
| Businesses in Ferguson, MO | ||||
| Name | Count | Name | Count | |
|---|---|---|---|---|
| ALDI | 1 | Nike | 1 | |
| Church's Chicken | 1 | Popeyes | 1 | |
| Cricket Wireless | 3 | RadioShack | 1 | |
| Curves | 1 | SONIC Drive-In | 1 | |
| H&R Block | 1 | Steak 'n Shake | 1 | |
| Jones New York | 1 | Subway | 2 | |
| KFC | 1 | U.S. Cellular | 1 | |
| Little Caesars Pizza | 1 | Walgreens | 1 | |
| McDonald's | 2 | |||
Strongest AM radio stations in Ferguson:
- KXEN (1010 AM; 50 kW; FESTUS-ST. LOUIS, MO; Owner: BDJ RADIO ENTERPRISES, LLC)
- KMOX (1120 AM; 50 kW; ST. LOUIS, MO; Owner: INFINITY BROADCASTING OPERATIONS, INC.)
- KFUO (850 AM; 5 kW; CLAYTON, MO; Owner: LUTHERAN CHURCH-MISSOURI SYNOD)
- KTRS (550 AM; 5 kW; ST. LOUIS, MO; Owner: KTRS-AM LICENSE, L.L.C.)
- KJSL (630 AM; 5 kW; ST. LOUIS, MO; Owner: WMUZ RADIO, INC.)
- KRFT (1190 AM; 10 kW; DE SOTO, MO; Owner: ALL SPORTS RADIO, LLC)
- KSIV (1320 AM; 5 kW; CLAYTON, MO; Owner: BOTT COMMUNICATIONS, INC.)
- KIRL (1460 AM; 5 kW; ST. CHARLES, MO; Owner: BRONCO BROADCASTING CO., INC.)
- KATZ (1600 AM; 5 kW; ST. LOUIS, MO; Owner: CITICASTERS LICENSES, L.P.)
- WSDZ (1260 AM; 20 kW; BELLEVILLE, IL)
- KSLG (1380 AM; 5 kW; ST. LOUIS, MO; Owner: NEW HORIZON 7TH-DAY CHRISTIAN CHURCH, INC.)
- WRTH (1430 AM; 5 kW; ST. LOUIS, MO)
- KSTL (690 AM; 1 kW; ST. LOUIS, MO; Owner: WMUZ RADIO, INC.)
Strongest FM radio stations in Ferguson:
- KCFV (89.5 FM; FERGUSON, MO; Owner: ST. LOUIS COMMUNITY COLLEGE)
- KSIV-FM (91.5 FM; ST. LOUIS, MO; Owner: COMMUNITY BROADCASTING, INC.)
- KEZK-FM (102.5 FM; ST. LOUIS, MO; Owner: INFINITY RADIO SUBSIDIARY OPERATIONS INC.)
- KIHT (96.3 FM; ST. LOUIS, MO; Owner: EMMIS RADIO LICENSE CORPORATION)
- WFUN-FM (95.5 FM; BETHALTO, IL; Owner: RADIO ONE LICENSES, LLC)
- KWMU (90.7 FM; ST. LOUIS, MO; Owner: THE CURATORS OF THE UNIVERSITY OF MISSOURI)
- KSHE (94.7 FM; CRESTWOOD, MO; Owner: EMMIS RADIO LICENSE CORPORATION)
- KSLZ (107.7 FM; ST. LOUIS, MO; Owner: CITICASTERS LICENSES, L.P.)
- KFUO-FM (99.1 FM; CLAYTON, MO; Owner: THE LUTHERAN CHURCH-MISSOURI SYNOD)
- KYKY (98.1 FM; ST. LOUIS, MO; Owner: INFINITY RADIO SUBSIDIARY OPERATIONS INC.)
- WSSM (106.5 FM; GRANITE CITY, IL; Owner: BONNEVILLE HOLDING COMPANY)
- KSD (93.7 FM; ST. LOUIS, MO; Owner: CITICASTERS LICENSES, L.P.)
- WMLL (104.1 FM; JERSEYVILLE, IL; Owner: EMMIS RADIO LICENSE CORPORATION)
- WVRV (101.1 FM; EAST ST. LOUIS, IL; Owner: BONNEVILLE HOLDING COMPANY)
- KLOU (103.3 FM; ST. LOUIS, MO; Owner: CITICASTERS LICENSES, L.P.)
- KFTK-FM1 (97.1 FM; ST. LOUIS, MO; Owner: EMMIS RADIO LICENSE CORPORATION)
- WSIE (88.7 FM; EDWARDSVILLE, IL; Owner: BOARD OF TRUSTEES, S. ILLINOIS UNIV.)
- WIL-FM (92.3 FM; ST. LOUIS, MO; Owner: BONNEVILLE HOLDING COMPANY)
- KATZ-FM (100.3 FM; ALTON, IL; Owner: CITICASTERS LICENSES, L.P.)
- KWUR (90.3 FM; CLAYTON, MO; Owner: THE WASHINGTON UNIVERSITY)
TV broadcast stations around Ferguson:
- KSDK (Channel 5; ST. LOUIS, MO; Owner: MULTIMEDIA KSDK, INC.)
- KPLR-TV (Channel 11; ST. LOUIS, MO; Owner: KPLR, INC.)
- KDNL-TV (Channel 30; ST. LOUIS, MO; Owner: KDNL LICENSEE, LLC)
- KPTN-LP (Channel 58; ST. LOUIS, MO; Owner: KURT J. PETERSEN)
- K40FF (Channel 40; ST. LOUIS, MO; Owner: EBC ST. LOUIS, INC.)
- KTVI (Channel 2; ST. LOUIS, MO; Owner: KTVI LICENSE, INC.)
- KMOV (Channel 4; ST. LOUIS, MO; Owner: KMOV-TV, INC.)
- K49FC (Channel 49; ST. LOUIS, MO; Owner: THREE ANGELS BROADCASTING NETWORK)
- KETC (Channel 9; ST. LOUIS, MO; Owner: ST. LOUIS REGIONAL & EDUCATIONAL PUBLIC TV COMMISSION)
- K64DT (Channel 64; ST. LOUIS, MO; Owner: WORD OF GOD FELLOWSHIP, INC.)
- K18BT (Channel 18; ST. LOUIS, MO; Owner: TRINITY BROADCASTING NETWORK)
- K65FN (Channel 65; BATESVILLE, AR; Owner: MS COMMUNICATIONS, LLC)
- K38HD (Channel 38; ST. LOUIS, MO; Owner: VENTANA TELEVISION, INC.)
- WRBU (Channel 46; EAST ST. LOUIS, IL; Owner: ROBERTS BROADCASTING COMPANY)
- KNLC (Channel 24; ST. LOUIS, MO; Owner: NEW LIFE EVANGELISTIC CENTER, INC.)
- K59GP (Channel 59; ST. CHARLES, MO; Owner: TRINITY BROADCASTING NETWORK)
- K63FW (Channel 63; JAMESTOWN, MO; Owner: ROGER E. HARDERS)
- K62EG (Channel 62; ST. LOUIS, MO; Owner: ETERNAL FAMILY NETWORK)
- W50CH (Channel 50; ALTON, IL; Owner: LIBERTY CHRISTIAN CENTER)
- National Bridge Inventory (NBI) Statistics
- 23Number of bridges
- 148ft / 45.1mTotal length
- $1,915,000Total costs
- 596,076Total average daily traffic
- 83,136Total average daily truck traffic
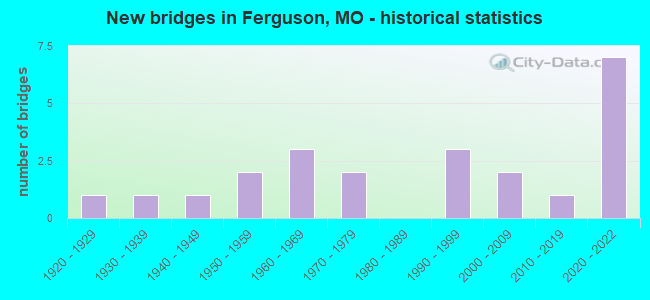
- New bridges - historical statistics
- 11920-1929
- 11930-1939
- 11940-1949
- 21950-1959
- 31960-1969
- 21970-1979
- 31990-1999
- 22000-2009
- 12010-2019
- 72020-2022
FCC Registered Antenna Towers:
84 (See the full list of FCC Registered Antenna Towers in Ferguson)FCC Registered Broadcast Land Mobile Towers:
6- 501 N Florissant Rd (Lat: 38.753111 Lon: -90.315389), Call Sign: KTS741,
Assigned Frequencies: 155.760 MHz, Grant Date: 12/13/2001, Expiration Date: 02/13/2012, Cancellation Date: 09/02/2011, Registrant: City Of Ferguson, 901 Ferguson Avenue, Ferguson, MO 63135, Phone: (314) 521-8373, Fax: (314) 521-5165, Email:
- 3400 Pershall Rd (Lat: 38.768611 Lon: -90.287361), Type: Bant, Structure height: 16 m, Overall height: 19 m, Call Sign: KLW330,
Assigned Frequencies: 155.535 MHz, 155.370 MHz, 155.535 MHz, Grant Date: 03/25/2014, Expiration Date: 06/20/2024, Registrant: St. Louis Community College, 3221 Mckelvey Road, Bridgeton, MO 63044, Phone: (314) 539-5060, Email:
- 15 S Florissant (Lat: 38.737556 Lon: -90.299833), Call Sign: KQR552,
Assigned Frequencies: 47.4200 MHz, Grant Date: 03/07/2024, Expiration Date: 03/21/2034, Registrant: American National Red Cross, 8550 Arlington Blvd., Suite 106, Fairfax, VA 22031, Phone: (571) 668-3371, Email:
- 3400 Pershall Rd Physical Plant Bldg (Lat: 38.792556 Lon: -90.327333), Call Sign: KSP880,
Assigned Frequencies: 464.975 MHz, Grant Date: 06/04/2015, Expiration Date: 08/23/2025, Registrant: St. Louis Community College, 3221 Mckelvey Road, Bridgeton, MO 63044, Phone: (314) 539-5060, Email:
- 9131 W Florissant (Lat: 38.734722 Lon: -90.277778), Call Sign: WQBL711,
Assigned Frequencies: 30.8400 MHz, 154.540 MHz, 33.4000 MHz, 33.1600 MHz, 31.2400 MHz, 468.487 MHz, 468.762 MHz, 468.837 MHz, 469.462 MHz, 469.637 MHz... (+22 more), Grant Date: 11/02/2004, Expiration Date: 11/02/2014, Cancellation Date: 01/03/2015, Certifier: Beth Cotner, Registrant: Dolfen Consulting Group, 95 Willow Lane, Bristol, IL 60512-9711, Phone: (630) 553-5886, Fax: (630) 566-1755, Email:
- Lat: 38.740667 Lon: -90.304083, Call Sign: WQLV439,
Assigned Frequencies: 456.950 MHz, Grant Date: 04/29/2020, Expiration Date: 05/03/2030, Certifier: Joe Wurm, Registrant: Rcc, Inc., 3057 Hwy. A, Washington, MO 63090, Phone: (636) 239-7192, Fax: (636) 239-1871, Email:
FCC Registered Microwave Towers:
2- MO-STL154B, 222 South Florissant (Lat: 38.740861 Lon: -90.302556), Type: Tower, Structure height: 48.8 m, Overall height: 53.3 m, Call Sign: WQLJ713,
Assigned Frequencies: 23025.0 MHz, 23175.0 MHz, Grant Date: 04/07/2020, Expiration Date: 02/16/2030, Cancellation Date: 09/10/2021, Certifier: Nadja S Sodos-Wallace, Registrant: T-Mobile Usa, Inc., 12920 Se 38th Street, Bellevue, WA 98006, Phone: (425) 383-8402, Fax: (425) 383-4840, Email:
- FERGUSON, 325 Paul Ave (Lat: 38.740306 Lon: -90.297889), Overall height: 51.8 m, Call Sign: WLV553,
Assigned Frequencies: 10623.7 MHz, Grant Date: 03/26/1991, Expiration Date: 02/01/2001, Cancellation Date: 09/03/1998, Registrant: Cybertel Rsa Cellular LP, 500 Maryville College Dr, St Louis, MO 63141
FCC Registered Amateur Radio Licenses:
31 (See the full list of FCC Registered Amateur Radio Licenses in Ferguson)FAA Registered Aircraft:
2- Aircraft: ROLLADEN-SCHNEIDER LS-6B (Category: Land, Weight: Up to 12,499 Pounds), Engine: None
N-Number: 54MA, N54MA, N-54MA, Serial Number: 6170, Year manufactured: 1987, Airworthiness Date: 02/17/1988, Certificate Issue Date: 02/24/2012
Registrant (Individual): David J Armbruster, 29 N Maple Ave, Ferguson, MO 63135 - Aircraft: PIPER PA-28R-201T (Category: Land, Seats: 4, Weight: Up to 12,499 Pounds, Speed: 108 mph), Engine: Reciprocating
N-Number: 582V, N582V, N-582V, Serial Number: 28R-7703332, Airworthiness Date: 08/31/1977, Certificate Issue Date: 08/08/2001
Registrant (LLC): Wingcap LLC, 33 N Elizabeth Ave, Ferguson, MO 63135
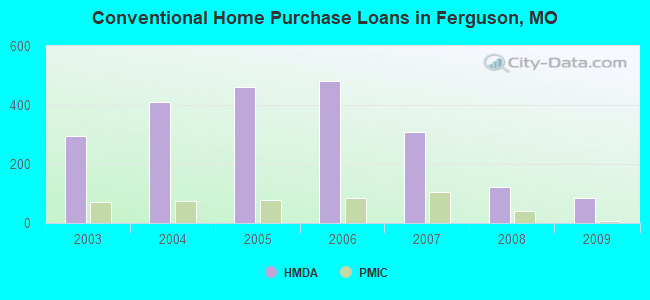
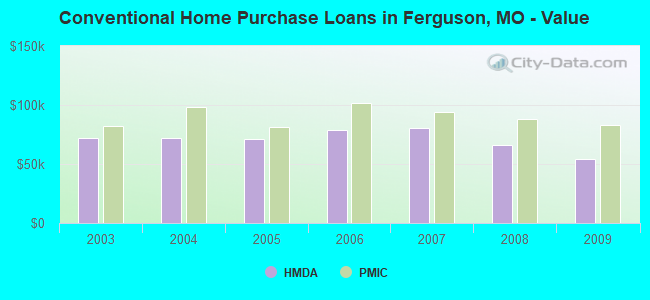
| Home Mortgage Disclosure Act Aggregated Statistics For Year 2009 (Based on 1 full and 6 partial tracts) | ||||||||||
| A) FHA, FSA/RHS & VA Home Purchase Loans | B) Conventional Home Purchase Loans | C) Refinancings | D) Home Improvement Loans | F) Non-occupant Loans on < 5 Family Dwellings (A B C & D) | ||||||
|---|---|---|---|---|---|---|---|---|---|---|
| Number | Average Value | Number | Average Value | Number | Average Value | Number | Average Value | Number | Average Value | |
| LOANS ORIGINATED | 97 | $92,670 | 84 | $54,419 | 287 | $98,793 | 18 | $19,336 | 96 | $69,759 |
| APPLICATIONS APPROVED, NOT ACCEPTED | 6 | $102,673 | 1 | $33,280 | 32 | $93,445 | 6 | $28,142 | 4 | $69,795 |
| APPLICATIONS DENIED | 13 | $75,662 | 10 | $61,115 | 167 | $89,159 | 51 | $22,406 | 23 | $61,881 |
| APPLICATIONS WITHDRAWN | 12 | $84,712 | 7 | $44,863 | 98 | $94,443 | 7 | $40,300 | 5 | $67,598 |
| FILES CLOSED FOR INCOMPLETENESS | 1 | $42,440 | 0 | $0 | 26 | $89,941 | 2 | $60,445 | 1 | $68,710 |
Detailed HMDA statistics for the following Tracts: 2117.00 , 2118.00, 2119.00, 2124.00, 2125.00, 2126.00, 2127.00
| Private Mortgage Insurance Companies Aggregated Statistics For Year 2009 (Based on 1 full and 6 partial tracts) | ||||||
| A) Conventional Home Purchase Loans | B) Refinancings | C) Non-occupant Loans on < 5 Family Dwellings (A & B) | ||||
|---|---|---|---|---|---|---|
| Number | Average Value | Number | Average Value | Number | Average Value | |
| LOANS ORIGINATED | 6 | $82,690 | 5 | $100,438 | 0 | $0 |
| APPLICATIONS APPROVED, NOT ACCEPTED | 2 | $130,940 | 3 | $144,013 | 0 | $0 |
| APPLICATIONS DENIED | 1 | $135,570 | 1 | $126,900 | 0 | $0 |
| APPLICATIONS WITHDRAWN | 1 | $90,500 | 4 | $203,670 | 1 | $90,500 |
| FILES CLOSED FOR INCOMPLETENESS | 2 | $81,190 | 0 | $0 | 1 | $34,110 |
Detailed PMIC statistics for the following Tracts: 2117.00 , 2118.00, 2119.00, 2124.00, 2125.00, 2126.00, 2127.00
2002 - 2018 National Fire Incident Reporting System (NFIRS) incidents
- Fire incident types reported to NFIRS in Ferguson, MO
- 1,04746.9%Structure Fires
- 63328.4%Outside Fires
- 28912.9%Mobile Property/Vehicle Fires
- 26311.8%Other
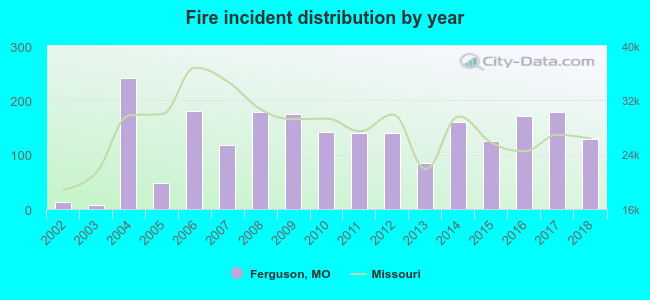 Based on the data from the years 2002 - 2018 the average number of fires per year is 131. The highest number of fires - 242 took place in 2004, and the least - 7 in 2003. The data has a growing trend.
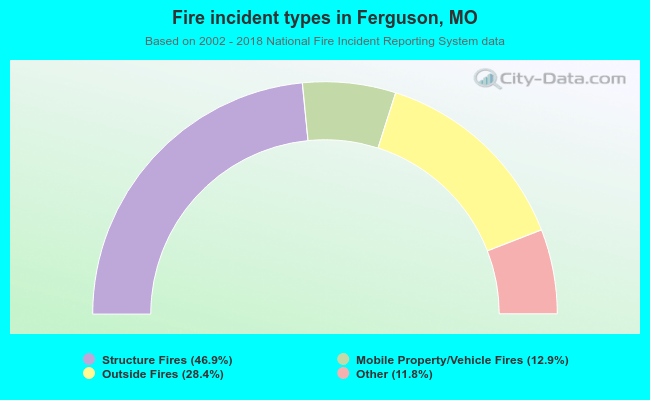 When looking into fire subcategories, the most incidents belonged to: Structure Fires (46.9%), and Outside Fires (28.4%).
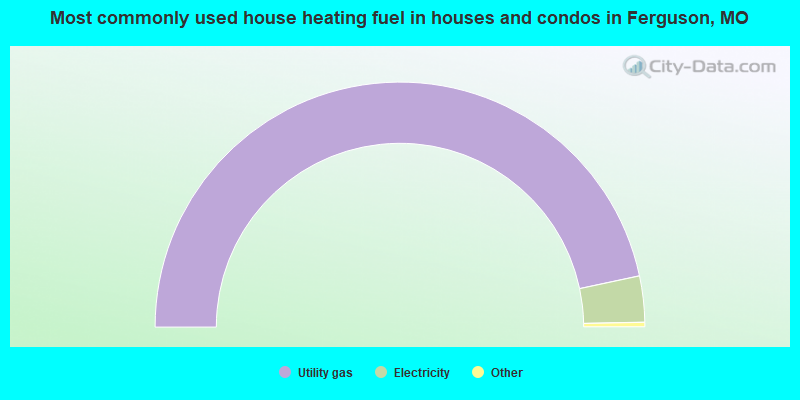
- 93.3%Utility gas
- 6.1%Electricity
- 0.4%Bottled, tank, or LP gas
- 0.2%Other fuel
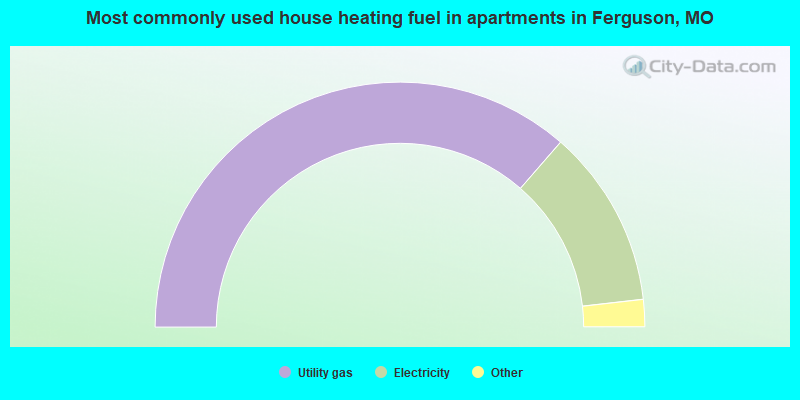
- 72.8%Utility gas
- 23.6%Electricity
- 3.1%No fuel used
- 0.4%Bottled, tank, or LP gas
Ferguson compared to Missouri state average:
- Median house value significantly below state average.
- Unemployed percentage below state average.
- Black race population percentage significantly above state average.
- Hispanic race population percentage significantly below state average.
- Foreign-born population percentage significantly below state average.
- Length of stay since moving in significantly above state average.
- House age above state average.
Ferguson on our top lists:
- #61 on the list of "Top 101 cities with the largest positive percentage difference between never married females and males (15+ years) (with at least 1,000 females never married)"
- #99 on the list of "Top 101 cities with the highest percentage of single-parent households, population 5,000+"
- #27 on the list of "Top 101 counties with the highest surface withdrawal of fresh water for public supply"
- #27 on the list of "Top 101 counties with the most Catholic congregations"
- #34 on the list of "Top 101 counties with the most Mainline Protestant adherents"
- #36 on the list of "Top 101 counties with the most Evangelical Protestant adherents"
- #39 on the list of "Top 101 counties with the highest total withdrawal of fresh water for public supply (pop. 50,000+)"

|
|
Total of 12 patent applications in 2008-2024.