St. Louis, Missouri

St. Louis: St. Louis
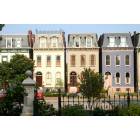
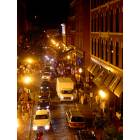
St. Louis: St. Louis' Lafayette Square Neighborhood
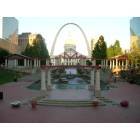
St. Louis: St. Louis Missouri

St. Louis: St. Louis Missouri
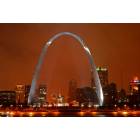
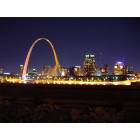
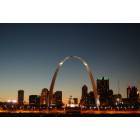
St. Louis: St. Louis Gateway Arch

St. Louis: From the arch, what a view!
St. Louis: The Arch viewed past downtown gathering place

St. Louis: St. Louis: Union Station
St. Louis: STL for the IL side
St. Louis: St. Louis Missouri
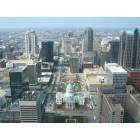
St. Louis: View of St. Louis from the top of the Arch
- see
243
more - add
your
Submit your own pictures of this city and show them to the world
- OSM Map
- General Map
- Google Map
- MSN Map
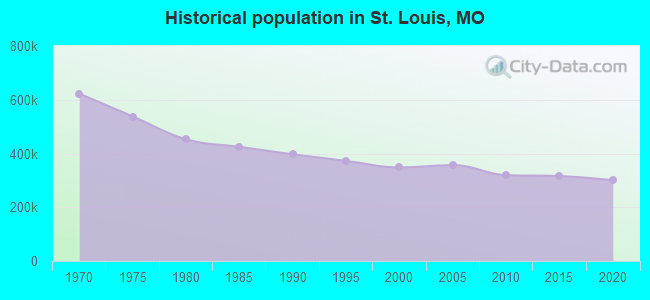
Population change since 2000: -17.7%
 |
| Males: 139,941 | |
| Females: 146,637 |
| Median resident age: | 36.8 years |
| Missouri median age: | 39.1 years |
Zip codes: 63101, 63102, 63103, 63104, 63106, 63107, 63108, 63109, 63110, 63111, 63112, 63113, 63115, 63116, 63118, 63139, 63147, 63155.
St. Louis Zip Code Map| St. Louis: | $52,847 |
| MO: | $64,811 |
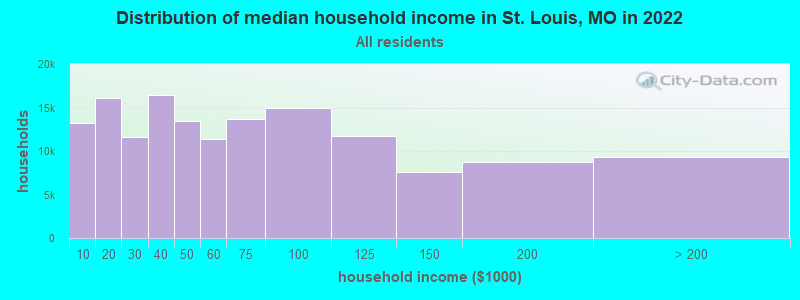
Estimated per capita income in 2022: $38,945 (it was $16,108 in 2000)
St. Louis city income, earnings, and wages data
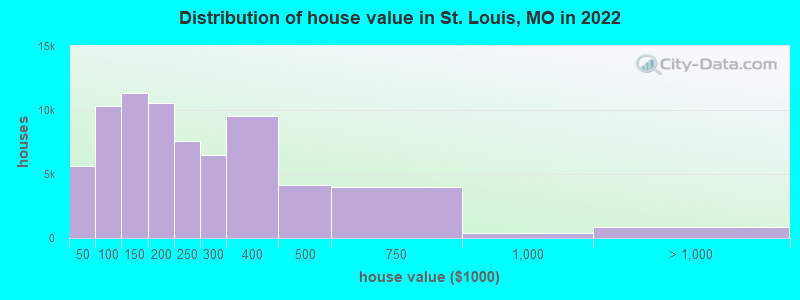
Estimated median house or condo value in 2022: $190,400 (it was $63,500 in 2000)
| St. Louis: | $190,400 |
| MO: | $221,200 |
Mean prices in 2022: all housing units: $242,561; detached houses: $237,512; townhouses or other attached units: $262,187; in 2-unit structures: $247,783; in 3-to-4-unit structures: $204,793; in 5-or-more-unit structures: $350,513; mobile homes: $105,121
Median gross rent in 2022: $911.
(11.7% for White Non-Hispanic residents, 30.1% for Black residents, 21.0% for Hispanic or Latino residents, 34.9% for American Indian residents, 1.0% for Native Hawaiian and other Pacific Islander residents, 16.8% for other race residents, 17.4% for two or more races residents)
Detailed information about poverty and poor residents in St. Louis, MO


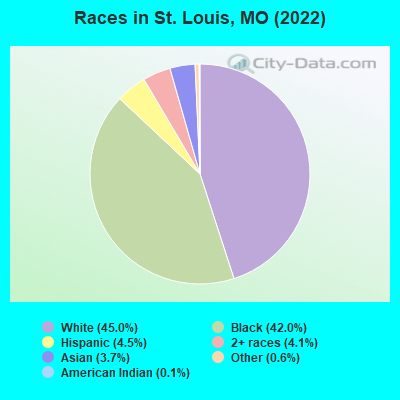
- 128,81745.0%White alone
- 120,30542.0%Black alone
- 12,9274.5%Hispanic
- 11,6114.1%Two or more races
- 10,7263.7%Asian alone
- 1,7140.6%Other race alone
- 3410.1%American Indian alone
- 1370.05%Native Hawaiian and Other
Pacific Islander alone
Races in St. Louis detailed stats: ancestries, foreign born residents, place of birth
According to our research of Missouri and other state lists, there were 2,532 registered sex offenders living in St. Louis, Missouri as of April 27, 2024.
The ratio of all residents to sex offenders in St. Louis is 123 to 1.
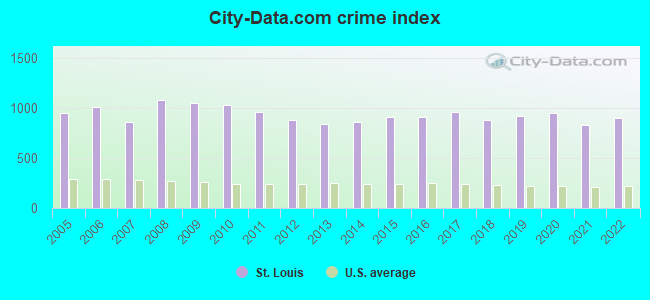
The City-Data.com crime index weighs serious crimes and violent crimes more heavily. Higher means more crime, U.S. average is 246.1. It adjusts for the number of visitors and daily workers commuting into cities.
- means the value is bigger than the state average.- means the value is much bigger than the state average.
Crime rate in St. Louis detailed stats: murders, rapes, robberies, assaults, burglaries, thefts, arson
Full-time law enforcement employees in 2021, including police officers: 1,511 (1,131 officers - 944 male; 187 female).
| Officers per 1,000 residents here: | 3.83 |
| Missouri average: | 2.54 |
 Recent articles from our blog. Our writers, many of them Ph.D. graduates or candidates, create easy-to-read articles on a wide variety of topics.


Latest news from St. Louis, MO collected exclusively by city-data.com from local newspapers, TV, and radio stations
Ancestries: German (9.2%), American (7.3%), Irish (4.7%), Italian (2.6%), English (2.4%), African (1.4%).
Current Local Time: CST time zone
Incorporated in 1809
Elevation: 465 feet
Land area: 61.9 square miles.
Population density: 4,628 people per square mile (average).
18,467 residents are foreign born (2.8% Asia, 1.2% Latin America, 1.2% Europe, 1.0% Africa).
| This city: | 6.4% |
| Missouri: | 4.2% |
Median real estate property taxes paid for housing units with mortgages in 2022: $2,292 (1.1%)
Median real estate property taxes paid for housing units with no mortgage in 2022: $1,434 (0.9%)
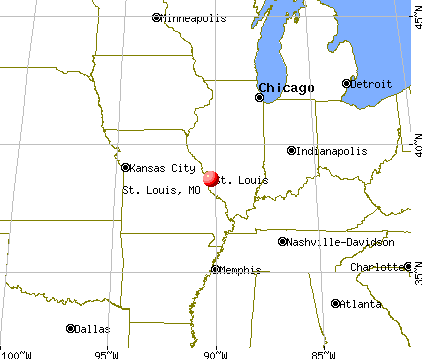
Nearest city with pop. 1,000,000+: Chicago, IL  (260.2 miles , pop. 2,896,016).
Nearest cities:
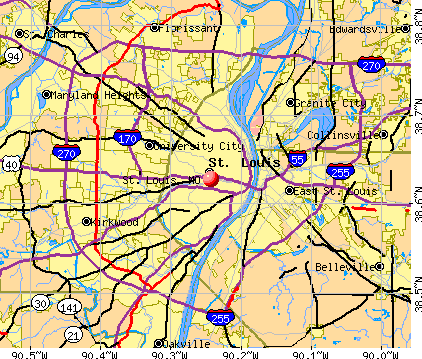
), ), ), ), ), )Latitude: 38.63 N, Longitude: 90.24 W
Daytime population change due to commuting: +80,217 (+28.0%)
Workers who live and work in this city: 91,537 (60.6%)
Property values in St. Louis, MO
Detailed articles:
- St Louis: Introduction
- St Louis Basic Facts
- St Louis: Communications
- St Louis: Convention Facilities
- St Louis: Economy
- St Louis: Education and Research
- St Louis: Geography and Climate
- St Louis: Health Care
- St Louis: History
- St Louis: Municipal Government
- St Louis: Population Profile
- St Louis: Recreation
- St Louis: Transportation
St. Louis tourist attractions:
- Anheuser Busch in St. Louis, Missouri
- Art and Entertainment District Grand Center in Saint Louis-St Louis MO-G rand Art Music Theater
- Busch Stadium in St. Louis, Missouri
- Casino Queen Saint Louis-St Louis MO-Casino Riverboat Gambling
- Cathedral Basilica in St. Louis, Missouri
- Central West End Neighborhood in Saint Louis-St Louis MO-Neighborhood As sociation Entertainment
- Chase Park Plaza - St Louis MO - Chase Park Plaza Hotel
- City Museum in St. Louis, Missouri
- Compton Heights Neighborhood in Saint Louis-St Louis MO-Compton Heights Tower St Louis
- Crowne Plaza Hotel - St Louis MO - Crowne Plaza Hotel Downtown
- Drury Plaza Hotel - St Louis MO - Drury Hotel Downtown Arch
- Edward Jones Dome - St. Louis, Missouri - home field for the St. Louis Rams NFL football team
- Four Seasons Hotel -St Louis MO - Four Seasons Luxury Hotel
- Grant's Farm in St. Louis, Missouri
- Hilton St Louis at the Ballpark - St Louis MO Hilton Hotel Ballpark Baseball
- Hilton St Louis Airport - St Louis MO - Hilton Hotel Airport
- Hilton St. Louis Downtown
- Hilton St Louis Frontenac - St Louis MO Hilton Frontenac Hotel Wedding Shopping
- Holy Corners District Neighborhood in Saint Louis-St Louis MO-Holy Corne rs Church Churches
- Hyatt Regency St Louis Riverfront - St Louis MO - Hyatt Hotel
- Hyatt Regency - St Louis MO - Hyatt Hotel
- Lafayette Square Neighborhood in Saint Louis-St Louis MO-Lafayette Squar e Historic Park
- Laumeier Sculpture Park Saint Louis-St. Louis MO-Scuplture Art Exhibit
- Magic House - St Louis MO-Children's Museum Fairy Magic
- Marriott St Louis Airport - St Louis MO - Marriott Hotel Airport
- Mildred Lane Kemper Art Museum Saint Louis-St Louis MO-Art Washington Un iversity
- Millennium Hotel - St Louis MO - Millenium Hotel Downtown
- Missouri Botanical Garden: St. Louis, Missouri
- Museum of Transportation Saint Louis MO-Museum Transportation History Train
- Museum of Westward Expansion Saint Louis-St. Louis MO-Lewis & Clark Westward Expansion Museum
- WS Hotel and Spa
- Moonrise Hotel
- St. Louis Union Station Marriott
- Hyatt Regency St. Louis at The Arch
- Omni Majestic Hotel - St Louis MO Omni Hotel downtown arch busch stadium
- Renaissance St Louis Grand & Suites - St Louis MO Renaissance Marriot Hotel Downtown
- Renaissance St Louis Hotel Airport - St Louis MO Renaissance Hotel Airport
- Ritz-Carlton St Louis - St Louis MO - Ritz-Carlton Luxury Hotel
- Saint Louis Zoo - Saint Louis, Missouri - large zoo with thousands of animals
- Scottrade Center, Saint Louis, Missouri
- Sheraton City Center - St Louis MO - Sheraton Hotel downtown
- Six Flags St Louis-St Louis MO-Six Flags Amusement Theme park
- Soulard Neighborhood in Saint Louis-St Louis MO-Soulard Blues Mardi Gras
- The St. Louis Zoo in St. Louis, Missouri
- St. Louis Art Museum in St. Louis, Missouri
- St. Louis Science Center-St. Louis MO-Science Center Planetarium
- St. Louis Walk of Fame-St. Louis MO-Walk Of Fame Stars
- The Butterfly House - St. Louis, Missouri - butterfly zoo that's part of the Missouri Botanical Garden
- Westin - St Louis MO - Westin Hotel Downtown
- Wyndham Roberts Mayfair - St Louis MO - Wyndham Hotel Downtown
St. Louis, Missouri accommodation & food services, waste management - Economy and Business Data
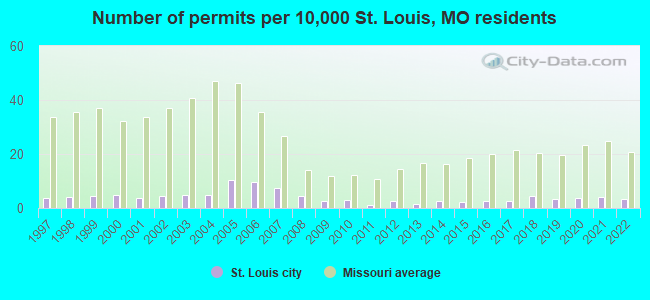
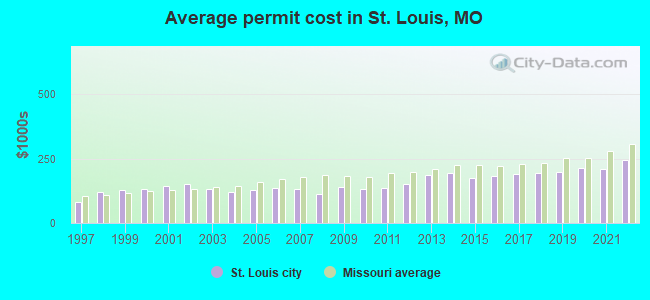
Single-family new house construction building permits:
- 2022: 122 buildings, average cost: $243,900
- 2021: 146 buildings, average cost: $208,300
- 2020: 124 buildings, average cost: $213,000
- 2019: 115 buildings, average cost: $199,200
- 2018: 161 buildings, average cost: $191,500
- 2017: 95 buildings, average cost: $189,900
- 2016: 85 buildings, average cost: $183,000
- 2015: 75 buildings, average cost: $174,000
- 2014: 96 buildings, average cost: $192,800
- 2013: 50 buildings, average cost: $185,800
- 2012: 84 buildings, average cost: $150,600
- 2011: 41 buildings, average cost: $137,000
- 2010: 102 buildings, average cost: $131,200
- 2009: 91 buildings, average cost: $139,400
- 2008: 157 buildings, average cost: $111,600
- 2007: 261 buildings, average cost: $132,700
- 2006: 340 buildings, average cost: $136,000
- 2005: 360 buildings, average cost: $127,300
- 2004: 171 buildings, average cost: $120,800
- 2003: 167 buildings, average cost: $132,900
- 2002: 150 buildings, average cost: $150,600
- 2001: 126 buildings, average cost: $143,900
- 2000: 162 buildings, average cost: $132,800
- 1999: 154 buildings, average cost: $127,200
- 1998: 138 buildings, average cost: $119,400
- 1997: 127 buildings, average cost: $80,300
| Here: | 3.5% |
| Missouri: | 2.8% |
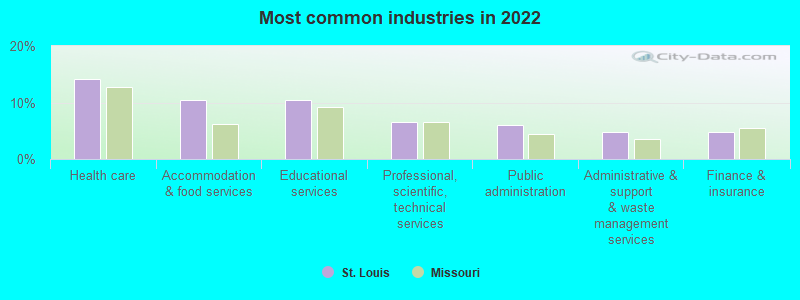
- Health care (14.2%)
- Accommodation & food services (10.5%)
- Educational services (10.4%)
- Professional, scientific, technical services (6.5%)
- Public administration (5.9%)
- Administrative & support & waste management services (4.8%)
- Finance & insurance (4.7%)
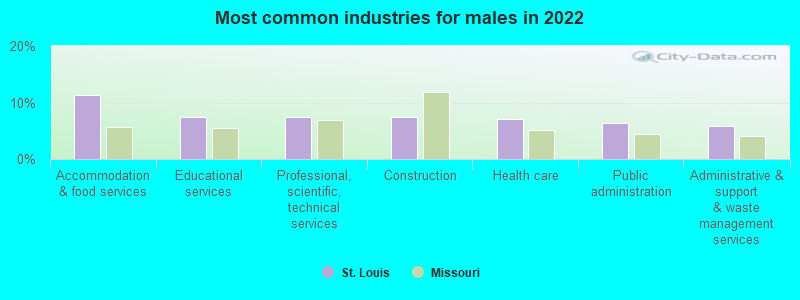
- Accommodation & food services (11.4%)
- Educational services (7.5%)
- Professional, scientific, technical services (7.4%)
- Construction (7.3%)
- Health care (7.0%)
- Public administration (6.5%)
- Administrative & support & waste management services (5.9%)
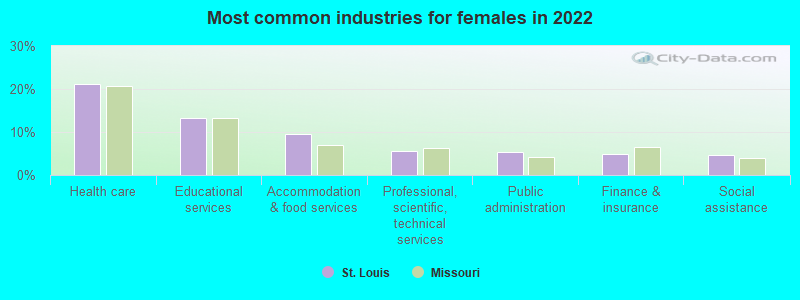
- Health care (21.2%)
- Educational services (13.2%)
- Accommodation & food services (9.6%)
- Professional, scientific, technical services (5.6%)
- Public administration (5.4%)
- Finance & insurance (4.8%)
- Social assistance (4.7%)
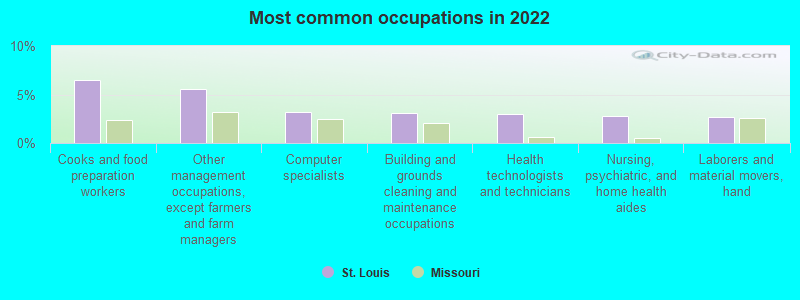
- Cooks and food preparation workers (6.5%)
- Other management occupations, except farmers and farm managers (5.5%)
- Computer specialists (3.2%)
- Building and grounds cleaning and maintenance occupations (3.1%)
- Health technologists and technicians (3.0%)
- Nursing, psychiatric, and home health aides (2.7%)
- Laborers and material movers, hand (2.7%)
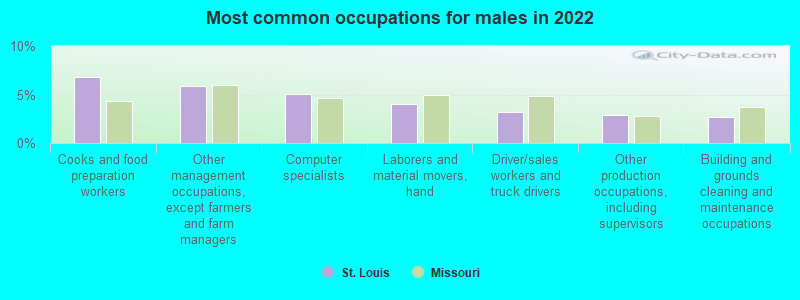
- Cooks and food preparation workers (6.8%)
- Other management occupations, except farmers and farm managers (5.9%)
- Computer specialists (5.0%)
- Laborers and material movers, hand (4.0%)
- Driver/sales workers and truck drivers (3.2%)
- Other production occupations, including supervisors (2.9%)
- Building and grounds cleaning and maintenance occupations (2.7%)
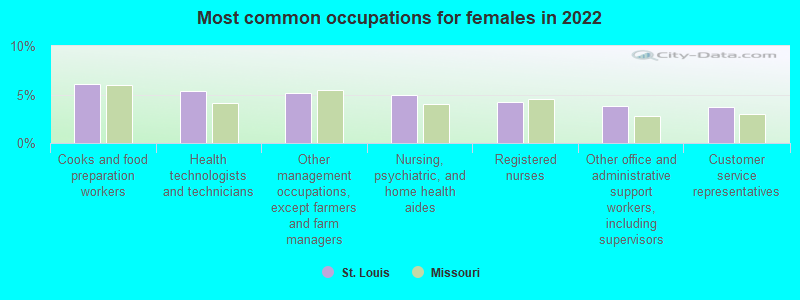
- Cooks and food preparation workers (6.1%)
- Health technologists and technicians (5.3%)
- Other management occupations, except farmers and farm managers (5.2%)
- Nursing, psychiatric, and home health aides (5.0%)
- Registered nurses (4.2%)
- Other office and administrative support workers, including supervisors (3.8%)
- Customer service representatives (3.7%)
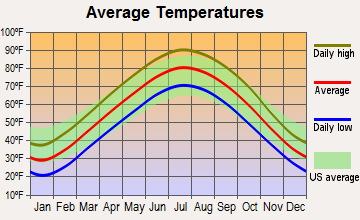
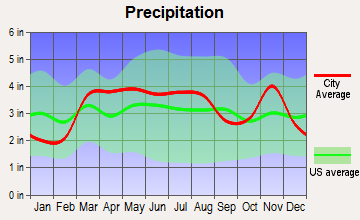
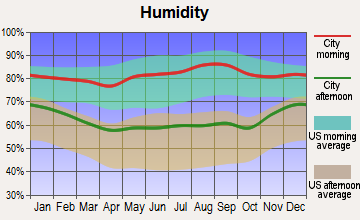
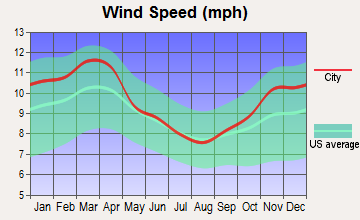
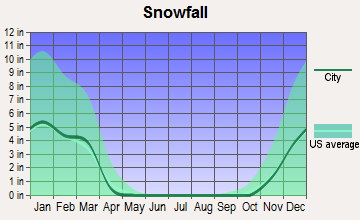
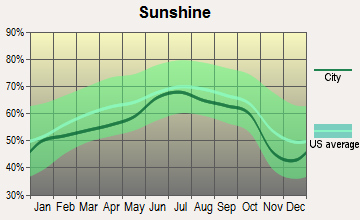
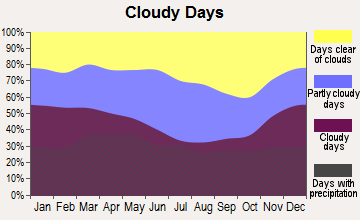
Average climate in St. Louis, Missouri
Based on data reported by over 4,000 weather stations
|
|

(lower is better)
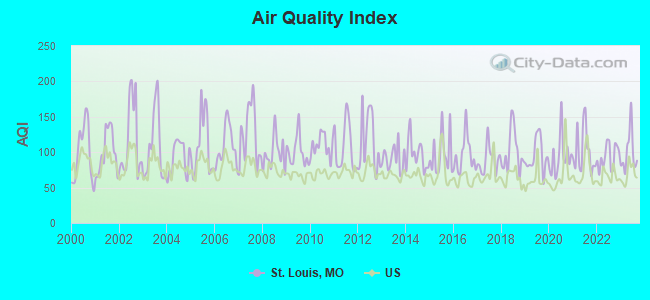
Air Quality Index (AQI) level in 2023 was 99.6. This is worse than average.
| City: | 99.6 |
| U.S.: | 72.6 |
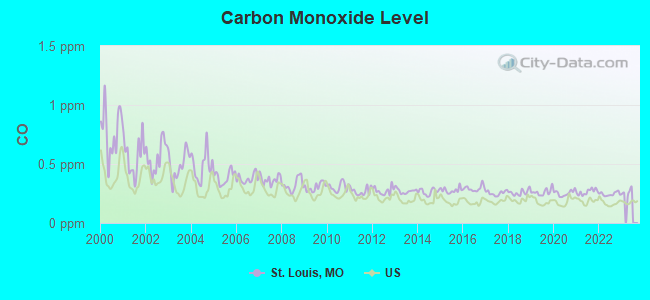
Carbon Monoxide (CO) [ppm] level in 2022 was 0.246. This is about average. Closest monitor was 0.6 miles away from the city center.
| City: | 0.246 |
| U.S.: | 0.251 |
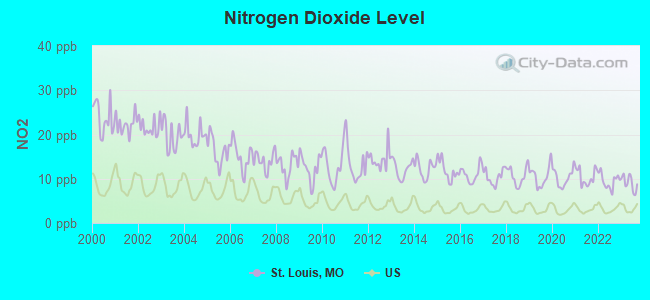
Nitrogen Dioxide (NO2) [ppb] level in 2023 was 9.06. This is significantly worse than average. Closest monitor was 0.6 miles away from the city center.
| City: | 9.06 |
| U.S.: | 5.11 |
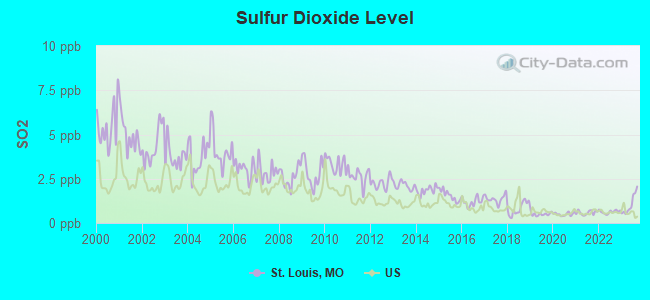
Sulfur Dioxide (SO2) [ppb] level in 2023 was 1.05. This is significantly better than average. Closest monitor was 0.6 miles away from the city center.
| City: | 1.05 |
| U.S.: | 1.51 |
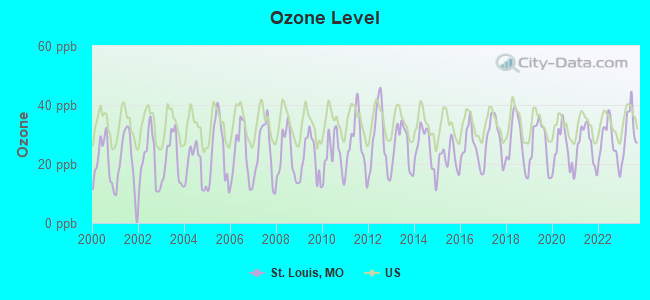
Ozone [ppb] level in 2023 was 31.3. This is about average. Closest monitor was 0.6 miles away from the city center.
| City: | 31.3 |
| U.S.: | 33.3 |
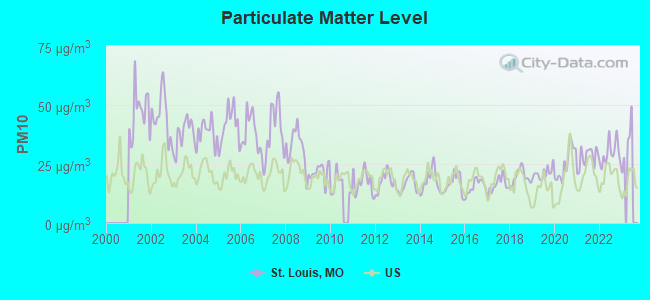
Particulate Matter (PM10) [µg/m3] level in 2022 was 29.6. This is significantly worse than average. Closest monitor was 2.1 miles away from the city center.
| City: | 29.6 |
| U.S.: | 19.2 |
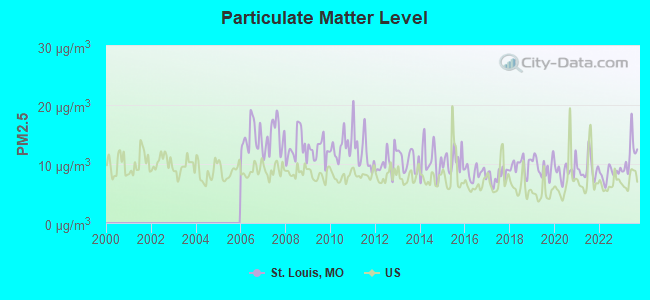
Particulate Matter (PM2.5) [µg/m3] level in 2023 was 11.5. This is significantly worse than average. Closest monitor was 3.1 miles away from the city center.
| City: | 11.5 |
| U.S.: | 8.1 |
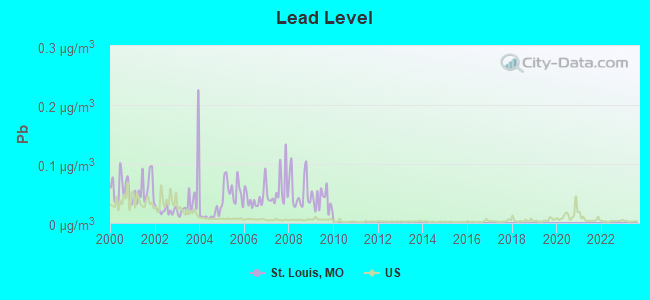
Lead (Pb) [µg/m3] level in 2009 was 0.0393. This is significantly worse than average. Closest monitor was 0.6 miles away from the city center.
| City: | 0.0393 |
| U.S.: | 0.0093 |
Tornado activity:
St. Louis-area historical tornado activity is slightly above Missouri state average. It is 82% greater than the overall U.S. average.
On 2/10/1959, a category F4 (max. wind speeds 207-260 mph) tornado 5.8 miles away from the St. Louis city center killed 21 people and injured 345 people and caused between $5,000,000 and $50,000,000 in damages.
On 4/3/1981, a category F4 tornado 8.8 miles away from the city center injured 32 people and caused between $5,000,000 and $50,000,000 in damages.
Earthquake activity:
St. Louis-area historical earthquake activity is significantly above Missouri state average. It is 313% greater than the overall U.S. average.On 4/18/2008 at 09:36:59, a magnitude 5.4 (5.1 MB, 4.8 MS, 5.4 MW, 5.2 MW, Class: Moderate, Intensity: VI - VII) earthquake occurred 128.1 miles away from the city center
On 4/18/2008 at 09:36:59, a magnitude 5.2 (5.2 MW, Depth: 8.9 mi) earthquake occurred 128.1 miles away from the city center
On 6/10/1987 at 23:48:54, a magnitude 5.1 (4.9 MB, 4.4 MS, 4.6 MS, 5.1 LG) earthquake occurred 127.9 miles away from St. Louis center
On 9/26/1990 at 13:18:51, a magnitude 5.0 (4.7 MB, 4.8 LG, 5.0 LG, Depth: 7.7 mi) earthquake occurred 108.2 miles away from St. Louis center
On 6/18/2002 at 17:37:15, a magnitude 5.0 (4.3 MB, 4.6 MW, 5.0 LG) earthquake occurred 140.8 miles away from St. Louis center
On 5/4/1991 at 01:18:54, a magnitude 5.0 (4.4 MB, 4.6 LG, 5.0 LG, Depth: 3.1 mi) earthquake occurred 144.6 miles away from the city center
Magnitude types: regional Lg-wave magnitude (LG), body-wave magnitude (MB), surface-wave magnitude (MS), moment magnitude (MW)
Main business address for: SOLUTIA INC (CHEMICALS & ALLIED PRODUCTS), STIFEL FINANCIAL CORP (SECURITY BROKERS, DEALERS & FLOTATION COMPANIES), ARCH WESTERN RESOURCES LLC (BITUMINOUS COAL & LIGNITE SURFACE MINING), BELDEN CDT INC. (DRAWING AND INSULATING NONFERROUS WIRE), CHARTER COMMUNICATIONS HOLDINGS LLC (CABLE & OTHER PAY TELEVISION SERVICES), D & K HEALTHCARE RESOURCES INC (WHOLESALE-DRUGS PROPRIETARIES & DRUGGISTS' SUNDRIES), INTERNATIONAL FUEL TECHNOLOGY INC (PETROLEUM REFINING).
Hospitals and medical centers in St. Louis:
- ST LOUIS-JOHN COCHRAN VA MEDICAL CENTER (Government Federal, 915 NORTH GRAND)
- ALGONQUIN NURSES HOME HEALTH CARE, INC (10135 MANCHESTER ROAD - SUITE 201)
Other hospitals and medical centers near St. Louis:
- SAINT LOUIS RENAL CARE, L L C (Dialysis Facility, about 1 miles away; SAINT LOUIS, MO)
- BETHESDA GEN HOSP SNF (Nursing Home, about 1 miles away; SAINT LOUIS, MO)
- ST LOUIS UNIVERSITY HOSPITAL Acute Care Hospitals (about 1 miles away; SAINT LOUIS, MO)
- LIFE CARE CENTER OF ST LOUIS (Nursing Home, about 1 miles away; SAINT LOUIS, MO)
- CARDINAL GLENNON CHILDRENS HOSPITAL DIALYSIS (Dialysis Facility, about 1 miles away; SAINT LOUIS, MO)
- SSM CARDINAL GLENNON CHILDREN'S HOSPIT (Hospital, about 1 miles away; SAINT LOUIS, MO)
- BARNES JEWISH DIALYSIS CENTER (Dialysis Facility, about 1 miles away; SAINT LOUIS, MO)
Airports and heliports located in St. Louis:
- Lambert-St Louis International Airport (STL) (Runways: 5, Commercial Ops: 122,858, Air Taxi Ops: 52,687, Itinerant Ops: 8,217, Military Ops: 1,712)
- Creve Coeur Airport (1H0) (Runways: 2, Air Taxi Ops: 390, Itinerant Ops: 9,200, Local Ops: 25,900, Military Ops: 50)
- Heliports: 12
Colleges/Universities in St. Louis:
- L'Ecole Culinaire-St Louis (Full-time enrollment: 686; Location: 9811 South Forty Drive; Private, for-profit; Website: www.lecoleculinaire.com)
- Chamberlain College of Nursing-Missouri (Full-time enrollment: 609; Location: 11830 Westline Industrial Dr., Ste. 106; Private, for-profit; Website: www.chamberlain.edu)
- Paul Mitchell the School-St Louis (Full-time enrollment: 222; Location: 30 Maryland Plaza Suite 200; Private, for-profit; Website: school.paulmitchell.edu/st-louis-mo)
- Vatterott College-ex'treme Institute by Nelly-St Louis (Full-time enrollment: 130; Location: 800 North 3rd Street; Private, for-profit; Website: www.eibynelly.com)
- Grabber School of Hair Design (Full-time enrollment: 100; Location: 9833 Watson Road; Private, for-profit; Website: grabberschool.edu)
- Healing Arts Center (Full-time enrollment: 64; Location: 10073 Manchester Road, Suite 100; Private, for-profit; Website: https://www.thehealingartscenter.com)
Colleges/universities with over 2000 students nearest to St. Louis:
- Saint Louis University (about 1 miles; Saint Louis, MO; Full-time enrollment: 11,606)
- Ranken Technical College (about 2 miles; Saint Louis, MO; FT enrollment: 2,134)
- Saint Louis Community College (about 3 miles; Saint Louis, MO; FT enrollment: 18,019)
- Washington University in St Louis (about 4 miles; Saint Louis, MO; FT enrollment: 10,823)
- Webster University (about 7 miles; Saint Louis, MO; FT enrollment: 12,406)
- University of Missouri-St Louis (about 7 miles; Saint Louis, MO; FT enrollment: 10,322)
- Missouri Baptist University (about 12 miles; Saint Louis, MO; FT enrollment: 2,898)
Biggest public high schools in St. Louis:
- RIVERVIEW GARDENS SR. HIGH (Students: 2,053, Location: 1218 SHEPLEY, Grades: 9-12)
- OAKVILLE SR. HIGH (Students: 2,035, Location: 5557 MILBURN RD, Grades: 9-12)
- MEHLVILLE HIGH SCHOOL (Students: 1,944, Location: 3200 LEMAY FERRY RD, Grades: 9-12)
- RITENOUR SR. HIGH (Students: 1,934, Location: 9100 ST CHARLES ROCK RD, Grades: 9-12)
- HAZELWOOD EAST HIGH (Students: 1,846, Location: 11300 DUNN RD, Grades: 9-12)
- NORTH HIGH (Students: 1,445, Location: 12860 FEE FEE RD, Grades: 9-12)
- WEBSTER GROVES HIGH (Students: 1,378, Location: 100 SELMA AVE, Grades: 9-12)
- NORMANDY HIGH (Students: 1,271, Location: 6701 ST CHARLES ROCK RD, Grades: 9-12)
- GATEWAY HIGH (Students: 1,250, Location: 5101 MCREE AVE, Grades: 9-12)
- BEAUMONT CTE HIGH SCHOOL (Students: 1,218, Location: 3836 NATURAL BRIDGE AVE, Grades: 9-12)
Biggest public elementary/middle schools in St. Louis:
- WASHINGTON ELEM. (Students: 1,516, Location: 1730 N HANLEY RD, Grades: KG-5)
- ROBERT H. SPERRENG MIDDLE (Students: 1,303, Location: 12111 TESSON FERRY RD, Grades: 6-8)
- EAST MIDDLE (Students: 1,180, Location: 1865 DUNN RD, Grades: 6-8)
- NORMANDY MIDDLE (Students: 959, Location: 7855 NATURAL BRIDGE RD, Grades: 6-8)
- LUCAS CROSSING ELEM. COMPLEX (Students: 867, Location: 7837 NATURAL BRIDGE RD, Grades: KG-5)
- LADUE MIDDLE (Students: 768, Location: 9701 CONWAY RD, Grades: 6-8)
- BERNARD MIDDLE (Students: 731, Location: 1054 FORDER RD, Grades: 6-8)
- RITENOUR MIDDLE (Students: 719, Location: 2500 MARSHALL AVE, Grades: 6-8)
- R. G. CENTRAL MIDDLE (Students: 712, Location: 9800 PATRICIA BARKALOW DR, Grades: 6-8)
- OAKVILLE MIDDLE (Students: 702, Location: 5950 TELEGRAPH RD, Grades: 6-8)
Libraries in St. Louis:
- SAINT LOUIS COUNTY LIBRARY (Operating income: $32,217,422; Location: 1640 SOUTH LINDBERGH BLVD; 2,142,753 books; 119,587 audio materials; 105,790 video materials; 320 local licensed databases; 14 state licensed databases; 5 other licensed databases; 6,599 print serial subscriptions; 310 electronic serial subscriptions)
- SAINT LOUIS PUBLIC LIBRARY (Operating income: $23,323,021; Location: 1301 OLIVE STREET; 2,816,794 books; 91,912 audio materials; 28,548 video materials; 39 local licensed databases; 14 state licensed databases; 6,743 print serial subscriptions; 11 electronic serial subscriptions)
User-submitted facts and corrections:
- This isn't a mistake, but the story is not clear. The City of St. Louis, Missouri was named for Saint Louis, Louis the Ninth (IX) who happened to be the patron saint of King of France when the city was named, Louis XV. The web page ( http://www.city-data.com/us-cities/The-Midwest/St-Louis-History.html) seems to state that all a bit unclearly, at least to me, and I'd bet that only a few dozen St Louisans know which king the town was named for. Hell, only a few more probably know he was French. added by K René
Points of interest:
Notable locations in St. Louis: The Gate District (A), Northshore Country Club (B), Triple A Golf Club (C), Union Station (D), Saint Louis Centre (E), Old Post Office (F), Johns Creek Lodge (G), Fairground Neighborhood (H), Mark Twain Interstate 70 Industrial Park (I), Saint Louis Fire Department Station 24 (J), Saint Louis Fire Department Station 23 (K), Saint Louis Fire Department Station 22 (L), Saint Louis Fire Department Station 20 (M), Saint Louis Fire Department Station 19 (N), Saint Louis Fire Department Station 14 (O), Saint Louis Fire Department Station 13 (P), Saint Louis Fire Department Station 12 (Q), Saint Louis Fire Department Station 10 (R), Saint Louis Fire Department Station 1 (S), Saint John the Baptist Catholic Convent (T). Display/hide their locations on the map
Shopping Centers: Saint Louis Center Shopping Center (1), Saint Louis Marketplace Shopping Center (2), South Towne Plaza Shopping Center (3), Southtown Centre Shopping Center (4), Hampton Village Shopping Center (5), Loughborough Shopping Center (6), Aloe Plaza Shopping Center (7), American Plaza Shopping Center (8), Charlton Square Shopping Center (9). Display/hide their locations on the map
Main business address in St. Louis: STIFEL FINANCIAL CORP (A). Display/hide its location on the map
Churches in St. Louis include: Christ Church Cathedral (A), Saint Wenceslaus Church (B), Saint Raymond Church (C), Saint Marys Assumption Church (D), Saint Johns Church (E), Saint Henry Church (F), Saint Anthony of Padua Church (G), Olive Branch Church (H), Saint Thomas of Aquin Church (I). Display/hide their locations on the map
Cemeteries: Saints Peter and Paul Cemetery (1), Saint Matthew Cemetery (2), Old Saint Marcus Cemetery (3), Gatewood Gardens Cemetery (4), Concordia Cemetery (5), Calvary Cemetery (6), Bellefontaine Cemetery (7). Display/hide their locations on the map
Reservoir: Compton Hill Reservoir (A). Display/hide its location on the map
Creeks: Watkins Creek (A), Deer Creek (B), Gravois Creek (C), Maline Creek (D). Display/hide their locations on the map
Parks in St. Louis include: Saint Louis Zoo (1), Bellerive Park (2), Benton Park (3), Busch Stadium (4), Busche Park (5), Carondelet Park (6), Chain of Rocks Park (7), Christy Park (8), Clifton Park (9). Display/hide their locations on the map
Birthplace of: Brandon Mroz - Figure skater, Joyce Meyer - Self-help writer, Dick Gephardt - Politician, Akon - Singer-songwriter, Dick Gregory - Activist, Freddie Blassie - Professional wrestler, Betty Grable - Dancer, Harry Caray - Radio sports announcer, Dolores Cannon - Writer, L. Patrick Gray - Director of the Federal Bureau of Investigation.
| This city: | 2.2 people |
| Missouri: | 2.5 people |
| This city: | 47.5% |
| Whole state: | 65.3% |
| This city: | 8.6% |
| Whole state: | 6.7% |
Likely homosexual households (counted as self-reported same-sex unmarried-partner households)
- Lesbian couples: 0.5% of all households
- Gay men: 0.8% of all households
People in group quarters in St. Louis in 2010:
- 4,167 people in college/university student housing
- 2,060 people in nursing facilities/skilled-nursing facilities
- 1,025 people in correctional facilities intended for juveniles
- 948 people in other noninstitutional facilities
- 728 people in correctional residential facilities
- 715 people in emergency and transitional shelters (with sleeping facilities) for people experiencing homelessness
- 572 people in local jails and other municipal confinement facilities
- 527 people in group homes intended for adults
- 526 people in workers' group living quarters and job corps centers
- 273 people in residential treatment centers for adults
- 224 people in mental (psychiatric) hospitals and psychiatric units in other hospitals
- 108 people in hospitals with patients who have no usual home elsewhere
- 58 people in residential treatment centers for juveniles (non-correctional)
- 35 people in residential schools for people with disabilities
- 12 people in group homes for juveniles (non-correctional)
People in group quarters in St. Louis in 2000:
- 2,943 people in nursing homes
- 2,829 people in college dormitories (includes college quarters off campus)
- 1,070 people in other noninstitutional group quarters
- 1,016 people in local jails and other confinement facilities (including police lockups)
- 713 people in homes or halfway houses for drug/alcohol abuse
- 387 people in job corps and vocational training facilities
- 358 people in religious group quarters
- 344 people in mental (psychiatric) hospitals or wards
- 190 people in other nonhousehold living situations
- 178 people in homes for the mentally ill
- 157 people in homes for the mentally retarded
- 148 people in institutions for the deaf
- 65 people in halfway houses
- 56 people in other group homes
- 51 people in homes for abused, dependent, and neglected children
- 45 people in hospitals/wards and hospices for chronically ill
- 45 people in other hospitals or wards for chronically ill
- 25 people in hospitals or wards for drug/alcohol abuse
- 21 people in agriculture workers' dormitories on farms
- 19 people in training schools for juvenile delinquents
- 10 people in residential treatment centers for emotionally disturbed children
- 6 people in military ships
Banks with most branches in St. Louis (2011 data):
- PNC Bank, National Association: 8 branches. Info updated 2012/03/20: Bank assets: $263,309.6 mil, Deposits: $197,343.0 mil, headquarters in Wilmington, DE, positive income, Commercial Lending Specialization, 3085 total offices, Holding Company: Pnc Financial Services Group, Inc., The
- Regions Bank: Concord Village Branch, Kingshighway, South Broadway Branch, St Louis Gateway One Banking Center, Hampton Avenue Branch. Info updated 2011/02/24: Bank assets: $123,368.2 mil, Deposits: $98,301.3 mil, headquarters in Birmingham, AL, positive income, Commercial Lending Specialization, 1778 total offices, Holding Company: Regions Financial Corporation
- Southern Commercial Bank: Oakville Branch, South Broadway Branch, Meramec Branch, Gravois Branch. Info updated 2010/07/14: Bank assets: $528.0 mil, Deposits: $457.6 mil, headquarters in Saint Louis, MO, negative income in the last year, Commercial Lending Specialization, 10 total offices, Holding Company: Southern Bancshares Corp.
- First Bank: Hampton Branch, Riverview Branch, Tesson Ferry Road Branch. Info updated 2007/12/04: Bank assets: $6,579.8 mil, Deposits: $5,800.6 mil, headquarters in Creve Coeur, MO, negative income in the last year, Commercial Lending Specialization, 148 total offices, Holding Company: First Banks, Inc.
- Lindell Bank & Trust Company: at 6900 Clayton Avenue, branch established on 1923/01/01; Hampton Branch at 3921 Hampton Avenue, branch established on 1994/02/10. Info updated 2010/01/07: Bank assets: $506.6 mil, Deposits: $373.2 mil, local headquarters, positive income, Commercial Lending Specialization, 10 total offices, Holding Company: First Illinois Bancorp, Inc.
- Jefferson Bank and Trust Company: Concord Village Branch at 5475 Southfield Center, branch established on 1997/12/29; Market Street Branch at 2301 Market Street, branch established on 1912/08/30. Info updated 2006/11/03: Bank assets: $555.6 mil, Deposits: $395.8 mil, headquarters in Eureka, MO, positive income, Commercial Lending Specialization, 5 total offices, Holding Company: Delta Bancshares Company
- Pulaski Bank: South Grand Branch at 3760 South Grand, branch established on 1922/01/01. Info updated 2011/07/21: Bank assets: $1,331.7 mil, Deposits: $1,129.9 mil, headquarters in Saint Louis, MO, positive income, Commercial Lending Specialization, 13 total offices
- Concord Bank: at 12040 Tesson Ferry Road, branch established on 1996/01/22. Info updated 2006/11/03: Bank assets: $156.6 mil, Deposits: $141.7 mil, local headquarters, positive income, Commercial Lending Specialization, 1 total offices, Holding Company: Concord Bancshares, Inc.
- UMB Bank, National Association: St. Louis Branch at 2 South Broadway, branch established on 1972/08/01. Info updated 2007/12/13: Bank assets: $11,205.9 mil, Deposits: $8,538.8 mil, headquarters in Kansas City, MO, positive income, 107 total offices, Holding Company: Umb Financial Corporation
- 3 other banks with 3 local branches
For population 15 years and over in St. Louis:

- Never married: 47.1%
- Now married: 34.2%
- Separated: 2.4%
- Widowed: 4.7%
- Divorced: 11.6%
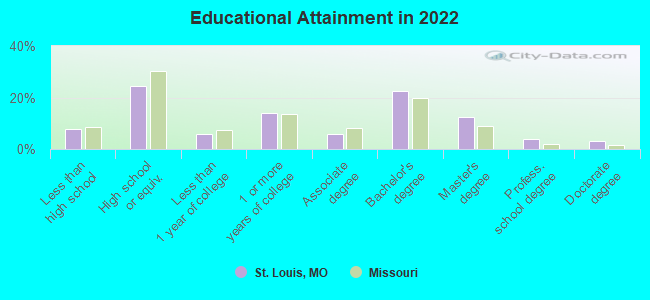
For population 25 years and over in St. Louis:
- High school or higher: 92.1%
- Bachelor's degree or higher: 41.9%
- Graduate or professional degree: 19.4%
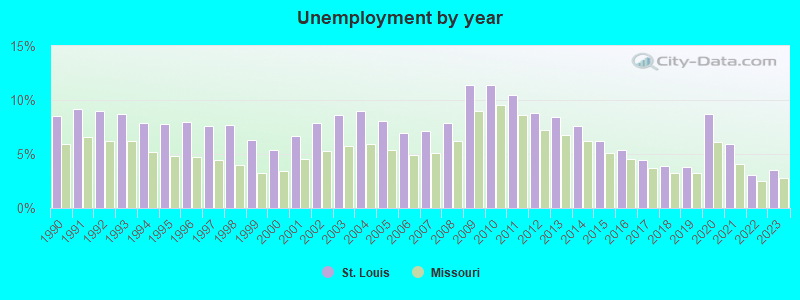
- Unemployed: 11.3%
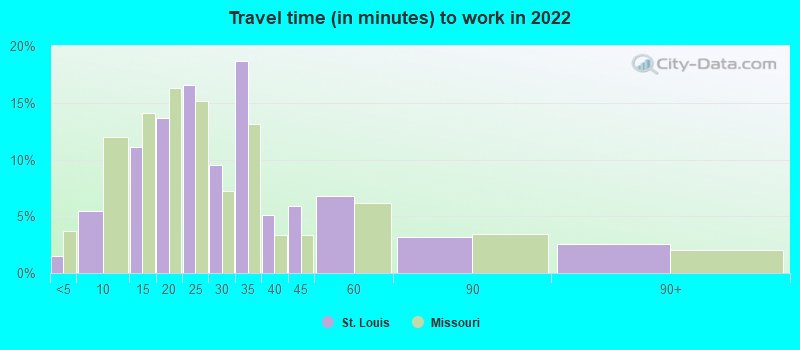
- Mean travel time to work (commute): 18.7 minutes
| Here: | 12.2 |
| Missouri average: | 11.1 |
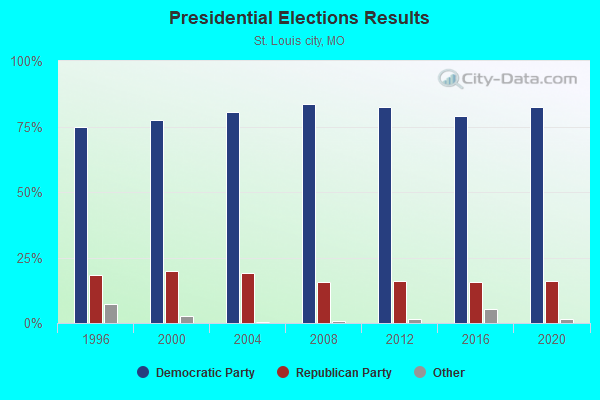
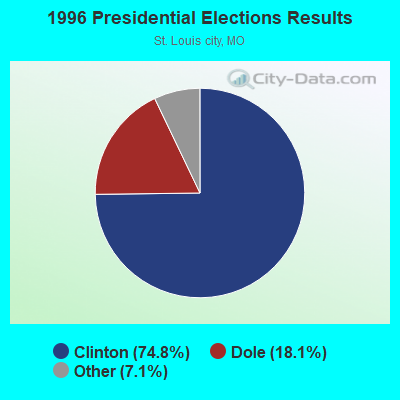
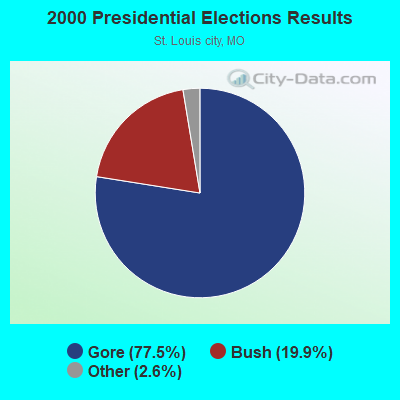
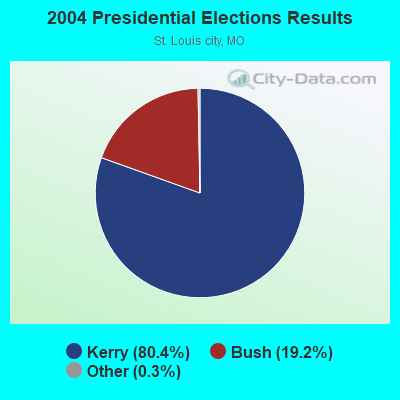
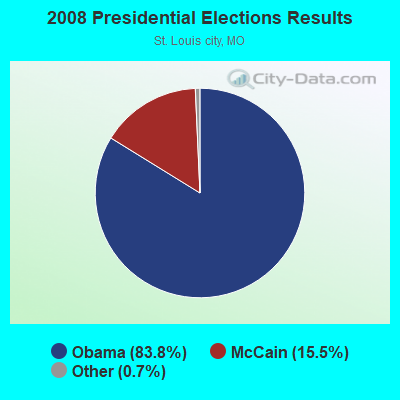
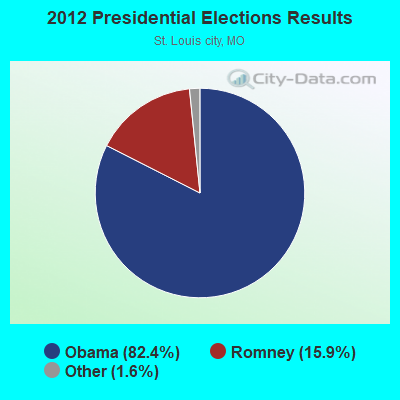
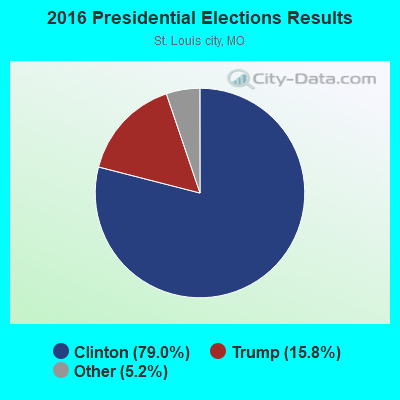

Graphs represent county-level data. Detailed 2008 Election Results
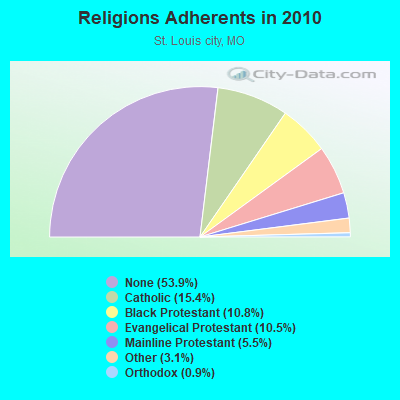
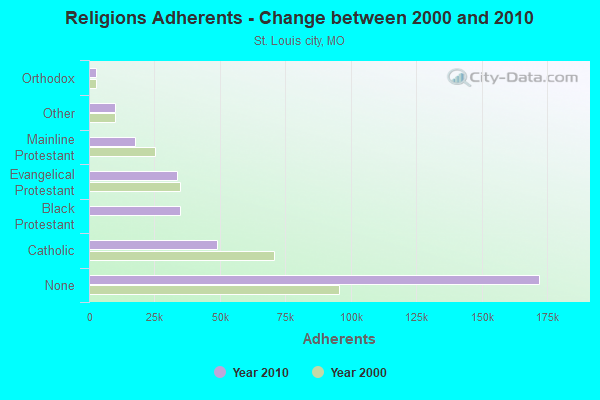
Religion statistics for St. Louis, MO (based on St. Louis city County data)
| Religion | Adherents | Congregations |
|---|---|---|
| Catholic | 49,014 | 40 |
| Black Protestant | 34,563 | 97 |
| Evangelical Protestant | 33,664 | 157 |
| Mainline Protestant | 17,527 | 72 |
| Other | 9,832 | 40 |
| Orthodox | 2,753 | 5 |
| None | 171,941 | - |
Food Environment Statistics:
| Here: | 2.76 / 10,000 pop. |
| State: | 1.88 / 10,000 pop. |
| St. Louis city: | 1.18 / 10,000 pop. |
| State: | 0.60 / 10,000 pop. |
| This county: | 2.47 / 10,000 pop. |
| Missouri: | 4.34 / 10,000 pop. |
| This county: | 8.94 / 10,000 pop. |
| Missouri: | 7.37 / 10,000 pop. |
| This county: | 10.6% |
| State: | 8.8% |
| St. Louis city: | 31.9% |
| Missouri: | 29.6% |
| St. Louis city: | 13.3% |
| Missouri: | 13.5% |
Health and Nutrition:
| St. Louis: | 50.5% |
| Missouri: | 50.9% |
| This city: | 48.7% |
| State: | 48.6% |
| Here: | 29.0 |
| State: | 28.7 |
| St. Louis: | 18.5% |
| Missouri: | 20.6% |
| Here: | 11.8% |
| Missouri: | 10.1% |
| St. Louis: | 6.8 |
| Missouri: | 6.8 |
| Here: | 33.8% |
| Missouri: | 34.3% |
| Here: | 56.9% |
| Missouri: | 57.5% |
| This city: | 82.1% |
| State: | 79.3% |
More about Health and Nutrition of St. Louis, MO Residents
St. Louis government finances - Expenditure in 2021 (per resident):
- Construction - General - Other: $59,758,000 ($208.52)
Air Transportation: $31,721,000 ($110.69)
Water Utilities: $9,233,000 ($32.22)
- Current Operations - Police Protection: $202,215,000 ($705.62)
General - Other: $118,692,000 ($414.17)
Health - Other: $105,923,000 ($369.61)
Local Fire Protection: $80,030,000 ($279.26)
Air Transportation: $78,457,000 ($273.77)
Judicial and Legal Services: $48,160,000 ($168.05)
Water Utilities: $46,463,000 ($162.13)
Housing and Community Development: $42,596,000 ($148.64)
Regular Highways: $40,374,000 ($140.88)
Correctional Institutions: $32,323,000 ($112.79)
Parks and Recreation: $23,131,000 ($80.71)
Financial Administration: $21,799,000 ($76.07)
Solid Waste Management: $18,230,000 ($63.61)
Corrections - Other: $15,884,000 ($55.43)
Central Staff Services: $14,880,000 ($51.92)
General Public Buildings: $14,804,000 ($51.66)
Parking Facilities: $10,636,000 ($37.11)
Protective Inspection and Regulation - Other: $7,474,000 ($26.08)
Sewerage: $2,399,000 ($8.37)
- General - Interest on Debt: $77,816,000 ($271.54)
- Intergovernmental to Local - Other - Transit Utilities: $31,445,000 ($109.73)
- Other Capital Outlay - General - Other: $657,000 ($2.29)
- Water Utilities - Interest on Debt: $274,000 ($0.96)
St. Louis government finances - Revenue in 2021 (per resident):
- Charges - Air Transportation: $135,027,000 ($471.17)
Other: $55,480,000 ($193.59)
Regular Highways: $20,760,000 ($72.44)
Parking Facilities: $9,204,000 ($32.12)
Sewerage: $2,855,000 ($9.96)
Parks and Recreation: $297,000 ($1.04)
- Federal Intergovernmental - Housing and Community Development: $957,000 ($3.34)
Air Transportation: $702,000 ($2.45)
- Miscellaneous - General Revenue - Other: $27,370,000 ($95.51)
Fines and Forfeits: $2,467,000 ($8.61)
Interest Earnings: $684,000 ($2.39)
Sale of Property: $323,000 ($1.13)
- Revenue - Water Utilities: $51,545,000 ($179.86)
- State Intergovernmental - Other: $131,821,000 ($459.98)
General Local Government Support: $13,408,000 ($46.79)
Highways: $8,206,000 ($28.63)
- Tax - General Sales and Gross Receipts: $199,347,000 ($695.61)
Individual Income: $196,562,000 ($685.89)
Property: $90,921,000 ($317.26)
Public Utilities Sales: $44,187,000 ($154.19)
Corporation Net Income: $38,657,000 ($134.89)
Other License: $33,804,000 ($117.96)
Other Selective Sales: $9,690,000 ($33.81)
Amusements Sales: $6,121,000 ($21.36)
Occupation and Business License - Other: $5,946,000 ($20.75)
Motor Vehicle License: $1,589,000 ($5.54)
Tobacco Products Sales: $1,381,000 ($4.82)
Alcoholic Beverage License: $549,000 ($1.92)
Other: $493,000 ($1.72)
St. Louis government finances - Debt in 2021 (per resident):
- Long Term Debt - Outstanding Unspecified Public Purpose: $1,644,233,000 ($5737.47)
Beginning Outstanding - Unspecified Public Purpose: $1,588,039,000 ($5541.38)
Issue, Unspecified Public Purpose: $163,827,000 ($571.67)
Retired Unspecified Public Purpose: $107,633,000 ($375.58)
St. Louis government finances - Cash and Securities in 2021 (per resident):
- Bond Funds - Cash and Securities: $161,021,000 ($561.87)
- Other Funds - Cash and Securities: $920,460,000 ($3211.90)
- Sinking Funds - Cash and Securities: $12,289,000 ($42.88)
10.87% of this county's 2021 resident taxpayers lived in other counties in 2020 ($47,783 average adjusted gross income)
| Here: | 10.87% |
| Missouri average: | 7.67% |
0.02% of residents moved from foreign countries ($205 average AGI)
St. Louis city: 0.02% Missouri average: 0.02%
Top counties from which taxpayers relocated into this county between 2020 and 2021:
| from St. Louis County, MO | |
| from St. Charles County, MO | |
| from St. Clair County, IL |
13.33% of this county's 2020 resident taxpayers moved to other counties in 2021 ($57,944 average adjusted gross income)
| Here: | 13.33% |
| Missouri average: | 7.51% |
0.02% of residents moved to foreign countries ($115 average AGI)
St. Louis city: 0.02% Missouri average: 0.01%
Top counties to which taxpayers relocated from this county between 2020 and 2021:
| to St. Louis County, MO | |
| to St. Charles County, MO | |
| to Jefferson County, MO |
| Businesses in St. Louis, MO | ||||
| Name | Count | Name | Count | |
|---|---|---|---|---|
| ALDI | 3 | Jones New York | 4 | |
| AT&T | 9 | Kmart | 1 | |
| Advance Auto Parts | 1 | La Quinta | 1 | |
| Aeropostale | 1 | Macy's | 4 | |
| American Eagle Outfitters | 2 | Marriott | 11 | |
| Ann Taylor | 3 | MasterBrand Cabinets | 10 | |
| Apple Store | 1 | Mazda | 2 | |
| Arby's | 5 | McDonald's | 13 | |
| Bakers | 1 | Men's Wearhouse | 2 | |
| Bath & Body Works | 1 | Motherhood Maternity | 7 | |
| Ben & Jerry's | 3 | New York & Co | 1 | |
| Bentleymotors.Com | 1 | Nike | 19 | |
| Blockbuster | 7 | Nordstrom | 1 | |
| Brooks Brothers | 1 | OfficeMax | 4 | |
| Brookstone | 1 | Outback | 1 | |
| Budget Car Rental | 3 | Outback Steakhouse | 1 | |
| Burger King | 2 | Pac Sun | 1 | |
| CVS | 1 | Panera Bread | 10 | |
| Cache | 1 | Papa John's Pizza | 1 | |
| Chipotle | 2 | Popeyes | 3 | |
| Chuck E. Cheese's | 1 | Pottery Barn | 1 | |
| Church's Chicken | 11 | Pottery Barn Kids | 1 | |
| Cinnabon | 1 | Qdoba Mexican Grill | 6 | |
| Clarks | 2 | Quality | 2 | |
| Cold Stone Creamery | 1 | Ramada | 1 | |
| Coldwater Creek | 1 | Ryder Rental & Truck Leasing | 2 | |
| Comfort Inn | 2 | Saks Fifth Avenue | 1 | |
| Costco | 1 | Sephora | 1 | |
| Cracker Barrel | 1 | Sheraton | 4 | |
| Cricket Wireless | 25 | Shoe Carnival | 2 | |
| Days Inn | 1 | Slumberland | 1 | |
| Decora Cabinetry | 8 | Soma Intimates | 1 | |
| Domino's Pizza | 9 | Sprint Nextel | 1 | |
| DressBarn | 1 | Starbucks | 7 | |
| Dressbarn | 1 | Steak 'n Shake | 12 | |
| Eddie Bauer | 1 | Subway | 1 | |
| Express | 3 | T-Mobile | 1 | |
| Finish Line | 1 | The Cheesecake Factory | 1 | |
| Foot Locker | 7 | Toyota | 2 | |
| Forever 21 | 2 | True Value | 2 | |
| GNC | 1 | U.S. Cellular | 4 | |
| Gymboree | 2 | Urban Outfitters | 1 | |
| Holiday Inn | 11 | Value City Furniture | 1 | |
| HomeTown Buffet | 1 | Westin | 1 | |
| J. Jill | 1 | Wet Seal | 2 | |
| J.Crew | 3 | White Castle | 11 | |
| Jimmy Jazz | 1 | YMCA | 11 | |
| Johnny Rockets | 1 | |||
Strongest AM radio stations in St. Louis:
- KFUO (850 AM; 5 kW; CLAYTON, MO; Owner: LUTHERAN CHURCH-MISSOURI SYNOD)
- KMOX (1120 AM; 50 kW; ST. LOUIS, MO; Owner: INFINITY BROADCASTING OPERATIONS, INC.)
- KXEN (1010 AM; 50 kW; FESTUS-ST. LOUIS, MO; Owner: BDJ RADIO ENTERPRISES, LLC)
- KTRS (550 AM; 5 kW; ST. LOUIS, MO; Owner: KTRS-AM LICENSE, L.L.C.)
- KJSL (630 AM; 5 kW; ST. LOUIS, MO; Owner: WMUZ RADIO, INC.)
- KSIV (1320 AM; 5 kW; CLAYTON, MO; Owner: BOTT COMMUNICATIONS, INC.)
- KSTL (690 AM; 1 kW; ST. LOUIS, MO; Owner: WMUZ RADIO, INC.)
- KATZ (1600 AM; 5 kW; ST. LOUIS, MO; Owner: CITICASTERS LICENSES, L.P.)
- WRTH (1430 AM; 5 kW; ST. LOUIS, MO)
- KSLG (1380 AM; 5 kW; ST. LOUIS, MO; Owner: NEW HORIZON 7TH-DAY CHRISTIAN CHURCH, INC.)
- KRFT (1190 AM; 10 kW; DE SOTO, MO; Owner: ALL SPORTS RADIO, LLC)
- WSDZ (1260 AM; 20 kW; BELLEVILLE, IL)
- WESL (1490 AM; 1 kW; EAST ST. LOUIS, IL; Owner: M&R ENTERPRISES, INC)
Strongest FM radio stations in St. Louis:
- KSIV-FM (91.5 FM; ST. LOUIS, MO; Owner: COMMUNITY BROADCASTING, INC.)
- KFTK-FM1 (97.1 FM; ST. LOUIS, MO; Owner: EMMIS RADIO LICENSE CORPORATION)
- KEZK-FM (102.5 FM; ST. LOUIS, MO; Owner: INFINITY RADIO SUBSIDIARY OPERATIONS INC.)
- KIHT (96.3 FM; ST. LOUIS, MO; Owner: EMMIS RADIO LICENSE CORPORATION)
- KSHE (94.7 FM; CRESTWOOD, MO; Owner: EMMIS RADIO LICENSE CORPORATION)
- KWMU (90.7 FM; ST. LOUIS, MO; Owner: THE CURATORS OF THE UNIVERSITY OF MISSOURI)
- KSLZ (107.7 FM; ST. LOUIS, MO; Owner: CITICASTERS LICENSES, L.P.)
- KFUO-FM (99.1 FM; CLAYTON, MO; Owner: THE LUTHERAN CHURCH-MISSOURI SYNOD)
- KYKY (98.1 FM; ST. LOUIS, MO; Owner: INFINITY RADIO SUBSIDIARY OPERATIONS INC.)
- WSSM (106.5 FM; GRANITE CITY, IL; Owner: BONNEVILLE HOLDING COMPANY)
- KSD (93.7 FM; ST. LOUIS, MO; Owner: CITICASTERS LICENSES, L.P.)
- WCBW-FM (89.7 FM; EAST ST. LOUIS, IL; Owner: NEW LIFE EVANGELISTIC CENTER, INC.)
- KLOU (103.3 FM; ST. LOUIS, MO; Owner: CITICASTERS LICENSES, L.P.)
- KMJM-FM (104.9 FM; COLUMBIA, IL; Owner: CITICASTERS LICENSES, L.P.)
- WIL-FM (92.3 FM; ST. LOUIS, MO; Owner: BONNEVILLE HOLDING COMPANY)
- KWUR (90.3 FM; CLAYTON, MO; Owner: THE WASHINGTON UNIVERSITY)
- WSIE (88.7 FM; EDWARDSVILLE, IL; Owner: BOARD OF TRUSTEES, S. ILLINOIS UNIV.)
- WVRV (101.1 FM; EAST ST. LOUIS, IL; Owner: BONNEVILLE HOLDING COMPANY)
- KDHX (88.1 FM; ST. LOUIS, MO; Owner: DOUBLE HELIX CORPORATION)
- WMLL (104.1 FM; JERSEYVILLE, IL; Owner: EMMIS RADIO LICENSE CORPORATION)
TV broadcast stations around St. Louis:
- K49FC (Channel 49; ST. LOUIS, MO; Owner: THREE ANGELS BROADCASTING NETWORK)
- K38HD (Channel 38; ST. LOUIS, MO; Owner: VENTANA TELEVISION, INC.)
- K40FF (Channel 40; ST. LOUIS, MO; Owner: EBC ST. LOUIS, INC.)
- K64DT (Channel 64; ST. LOUIS, MO; Owner: WORD OF GOD FELLOWSHIP, INC.)
- KPLR-TV (Channel 11; ST. LOUIS, MO; Owner: KPLR, INC.)
- KSDK (Channel 5; ST. LOUIS, MO; Owner: MULTIMEDIA KSDK, INC.)
- KDNL-TV (Channel 30; ST. LOUIS, MO; Owner: KDNL LICENSEE, LLC)
- KPTN-LP (Channel 58; ST. LOUIS, MO; Owner: KURT J. PETERSEN)
- KMOV (Channel 4; ST. LOUIS, MO; Owner: KMOV-TV, INC.)
- KTVI (Channel 2; ST. LOUIS, MO; Owner: KTVI LICENSE, INC.)
- K18BT (Channel 18; ST. LOUIS, MO; Owner: TRINITY BROADCASTING NETWORK)
- K65FN (Channel 65; BATESVILLE, AR; Owner: MS COMMUNICATIONS, LLC)
- KETC (Channel 9; ST. LOUIS, MO; Owner: ST. LOUIS REGIONAL & EDUCATIONAL PUBLIC TV COMMISSION)
- WRBU (Channel 46; EAST ST. LOUIS, IL; Owner: ROBERTS BROADCASTING COMPANY)
- KNLC (Channel 24; ST. LOUIS, MO; Owner: NEW LIFE EVANGELISTIC CENTER, INC.)
- K62EG (Channel 62; ST. LOUIS, MO; Owner: ETERNAL FAMILY NETWORK)
- K63FW (Channel 63; JAMESTOWN, MO; Owner: ROGER E. HARDERS)
- K59GP (Channel 59; ST. CHARLES, MO; Owner: TRINITY BROADCASTING NETWORK)
- WPXS (Channel 13; MT. VERNON, IL; Owner: EBC ST. LOUIS, INC.)
Medal of Honor Recipients
Medal of Honor Recipients born in St. Louis: Alexander R. Skinker, Arthur J. Forrest, August Holtz, Bernard Taylor, Edward Henry O'Hare, Edwin L. Elwood, Edwin Phoenix, Herman Henry Hanneken, Louis Rene Gaiennie, Michael B. Ellis, William M. Wherry, William Robert Button.
- National Bridge Inventory (NBI) Statistics
- 608Number of bridges
- 12,736ft / 3,882mTotal length
- $695,294,000Total costs
- 13,779,107Total average daily traffic
- 1,792,072Total average daily truck traffic
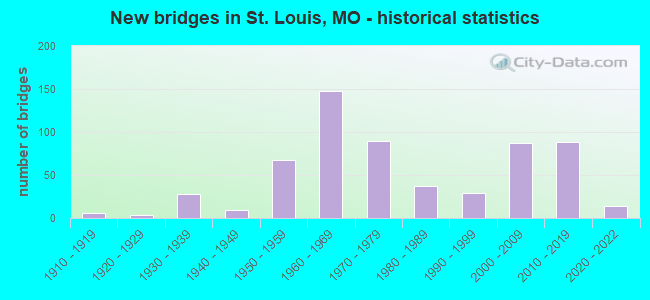
- New bridges - historical statistics
- 1Before 1900
- 11900-1909
- 61910-1919
- 31920-1929
- 281930-1939
- 91940-1949
- 671950-1959
- 1481960-1969
- 901970-1979
- 371980-1989
- 291990-1999
- 872000-2009
- 882010-2019
- 142020-2022
FCC Registered Antenna Towers: 903 (See the full list of FCC Registered Antenna Towers)
FCC Registered Commercial Land Mobile Towers: 1 (See the full list of FCC Registered Commercial Land Mobile Towers in St. Louis, MO)
FCC Registered Private Land Mobile Towers: 7 (See the full list of FCC Registered Private Land Mobile Towers)
FCC Registered Broadcast Land Mobile Towers: 428 (See the full list of FCC Registered Broadcast Land Mobile Towers)
FCC Registered Microwave Towers: 318 (See the full list of FCC Registered Microwave Towers in this town)
FCC Registered Paging Towers: 31 (See the full list of FCC Registered Paging Towers)
FCC Registered Maritime Coast & Aviation Ground Towers: 12 (See the full list of FCC Registered Maritime Coast & Aviation Ground Towers)
FCC Registered Amateur Radio Licenses: 91 (See the full list of FCC Registered Amateur Radio Licenses in St. Louis)
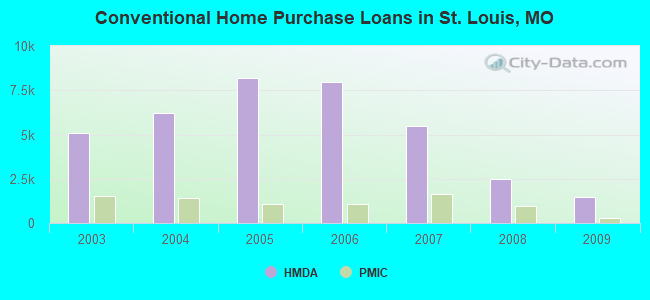
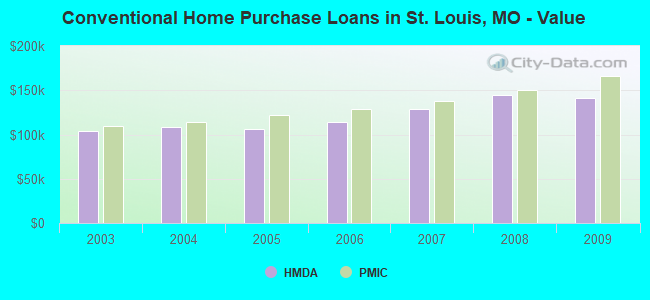
| Home Mortgage Disclosure Act Aggregated Statistics For Year 2009 (Based on 113 full tracts) | ||||||||||||||
| A) FHA, FSA/RHS & VA Home Purchase Loans | B) Conventional Home Purchase Loans | C) Refinancings | D) Home Improvement Loans | E) Loans on Dwellings For 5+ Families | F) Non-occupant Loans on < 5 Family Dwellings (A B C & D) | G) Loans On Manufactured Home Dwelling (A B C & D) | ||||||||
|---|---|---|---|---|---|---|---|---|---|---|---|---|---|---|
| Number | Average Value | Number | Average Value | Number | Average Value | Number | Average Value | Number | Average Value | Number | Average Value | Number | Average Value | |
| LOANS ORIGINATED | 1,531 | $127,944 | 1,442 | $141,076 | 5,345 | $152,408 | 241 | $57,743 | 68 | $875,941 | 763 | $110,145 | 1 | $25,000 |
| APPLICATIONS APPROVED, NOT ACCEPTED | 77 | $125,870 | 105 | $165,943 | 481 | $142,306 | 54 | $40,019 | 1 | $500,000 | 59 | $113,695 | 0 | $0 |
| APPLICATIONS DENIED | 202 | $116,658 | 247 | $124,255 | 2,219 | $136,461 | 424 | $33,689 | 18 | $1,078,000 | 339 | $97,150 | 3 | $69,333 |
| APPLICATIONS WITHDRAWN | 174 | $123,770 | 198 | $152,586 | 1,254 | $139,416 | 73 | $59,466 | 8 | $4,417,000 | 178 | $107,899 | 1 | $57,000 |
| FILES CLOSED FOR INCOMPLETENESS | 26 | $104,077 | 32 | $138,031 | 312 | $141,272 | 14 | $54,143 | 0 | $0 | 32 | $133,500 | 0 | $0 |
Detailed mortgage data for all 113 tracts in St. Louis, MO
| Private Mortgage Insurance Companies Aggregated Statistics For Year 2009 (Based on 88 full tracts) | ||||||
| A) Conventional Home Purchase Loans | B) Refinancings | C) Non-occupant Loans on < 5 Family Dwellings (A & B) | ||||
|---|---|---|---|---|---|---|
| Number | Average Value | Number | Average Value | Number | Average Value | |
| LOANS ORIGINATED | 309 | $165,948 | 252 | $175,964 | 3 | $136,667 |
| APPLICATIONS APPROVED, NOT ACCEPTED | 105 | $171,686 | 90 | $165,656 | 7 | $138,429 |
| APPLICATIONS DENIED | 62 | $184,484 | 51 | $154,765 | 1 | $32,000 |
| APPLICATIONS WITHDRAWN | 27 | $165,037 | 22 | $206,091 | 1 | $248,000 |
| FILES CLOSED FOR INCOMPLETENESS | 21 | $145,571 | 9 | $156,889 | 4 | $135,000 |
2002 - 2011 National Fire Incident Reporting System (NFIRS) incidents
- Fire incident types reported to NFIRS in St. Louis, MO
- 16,52649.3%Structure Fires
- 10,13530.3%Outside Fires
- 5,40516.1%Mobile Property/Vehicle Fires
- 1,4304.3%Other
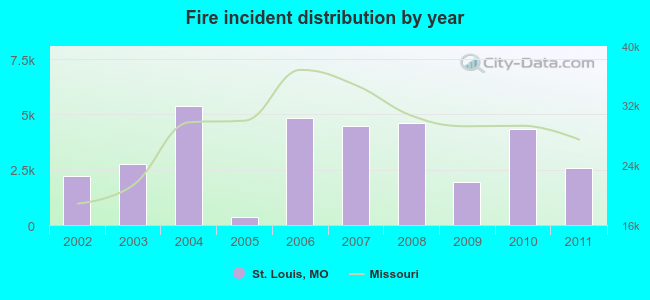 According to the data from the years 2002 - 2011 the average number of fire incidents per year is 3350. The highest number of fires - 5,397 took place in 2004, and the least - 340 in 2005. The data has a rising trend.
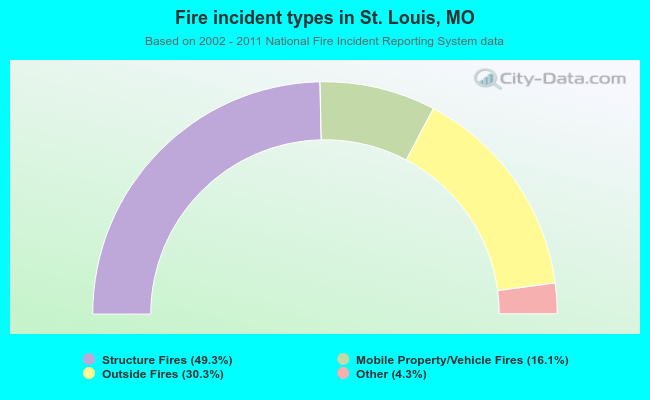 When looking into fire subcategories, the most reports belonged to: Structure Fires (49.3%), and Outside Fires (30.3%).
Fire-safe hotels and motels in St. Louis, Missouri:
- Comfort Inn St. Louis - Westport, 12031 Lackland Rd, St. Louis, Missouri 63146 , Phone: (314) 878-1400, Fax: (314) 878-0905
- St. Louis Union Station Hotel, 1820 Market St, St. Louis, Missouri 63103 , Phone: (314) 621-5262, Fax: (314) 434-5885
- St. Louis City Center Hotel, 400 S 14th St, St. Louis, Missouri 63103 , Phone: (314) 231-5007, Fax: (314) 613-6417
- Marriott St. Louis Grand Hotel, 800 Washington Ave, St. Louis, Missouri 63101 , Phone: (314) 621-9600, Fax: (314) 621-9601
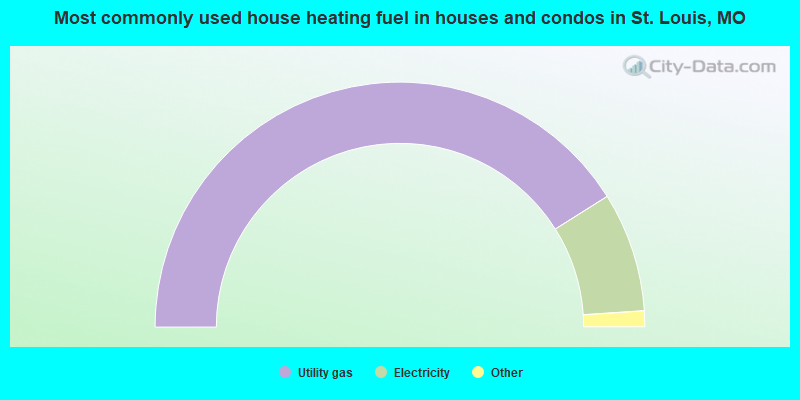
- 82.1%Utility gas
- 15.8%Electricity
- 1.3%Bottled, tank, or LP gas
- 0.3%Wood
- 0.2%No fuel used
- 0.1%Other fuel
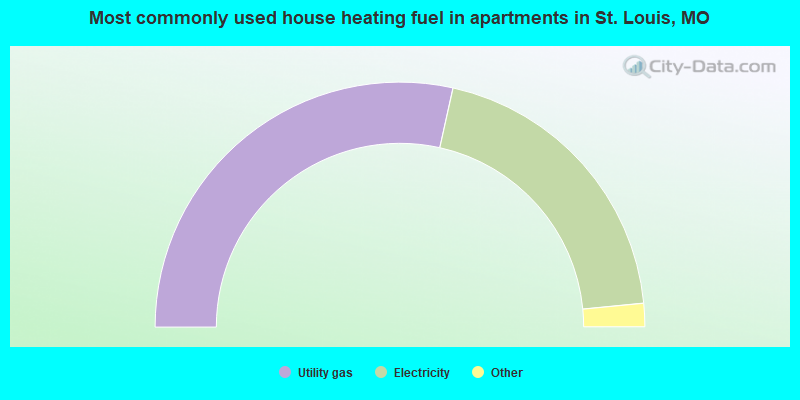
- 56.9%Utility gas
- 39.9%Electricity
- 1.5%Bottled, tank, or LP gas
- 1.0%No fuel used
- 0.5%Other fuel
St. Louis compared to Missouri state average:
- Black race population percentage significantly above state average.
- Renting percentage above state average.
- Number of rooms per house below state average.
- House age significantly above state average.
- Percentage of population with a bachelor's degree or higher above state average.
St. Louis, MO compared to other similar cities:
St. Louis on our top lists:
- #4 on the list of "Top 101 cities with largest percentage population decreases in the 1990s) (population 50,000+)"
- #5 on the list of "Top 100 least-safe cities (highest city-data.com crime index) (pop. 50,000+)"
- #7 on the list of "Top 101 cities with the highest city-data.com crime index, excludes tourist destinations and others with a lot of outsiders visiting based on city industries data (population 50,000+)"
- #7 on the list of "Top 101 cities with the highest number of police officers per 1000 residents (population 50,000+)"
- #9 on the list of "Top 101 cities with the highest number of assaults per 100,000 residents, excludes tourist destinations and others with a lot of outsiders visiting based on city industries data (population 50,000+)"
- #10 on the list of "Top 101 cities with the highest number of murders per 100,000 residents, excludes tourist destinations and others with a lot of outsiders visiting based on city industries data (population 50,000+)"
- #14 on the list of "Top 101 cities with the highest number of auto thefts per 100,000 residents, excludes tourist destinations and others with a lot of outsiders visiting based on city industries data (population 50,000+)"
- #17 on the list of "Top 100 cities with declining populations from 2000 to 2014 (pop. 50,000+)"
- #17 on the list of "Top 101 cities with the highest number of robberies per 100,000 residents, excludes tourist destinations and others with a lot of outsiders visiting based on city industries data (population 50,000+)"
- #19 on the list of "Top 100 cities with oldest houses (pop. 50,000+)"
- #20 on the list of "Top 101 cities with the largest percentage population decrease from 2000 (population 50,000+)"
- #21 on the list of "Top 100 cities with old houses but young residents (pop. 50,000+)"
- #22 on the list of "Top 101 cities with the highest ratio of murders to rapes between 2002 and 2012 (population 50,000+)"
- #24 on the list of "Top 101 cities with the lowest percentage of family households, population 100,000+"
- #25 on the list of "Top 101 cities with the largest percentage of likely gay men couples (counted as self-reported male-male unmarried-partner households) (population 50,000+)"
- #25 on the list of "Top 101 cities with the largest percentage of people in institutions for the deaf (population 1,000+)"
- #33 on the list of "Top 101 cities with the highest number of arson incidents per 100,000 residents, excludes tourist destinations and others with a lot of outsiders visiting based on city industries data (population 50,000+)"
- #33 on the list of "Top 101 cities with the highest average snowfall in a year (population 50,000+)"
- #34 on the list of "Top 101 cities with the largest percentage of likely homosexual households (counted as self-reported same-sex unmarried-partner households) (population 50,000+)"
- #37 on the list of "Top 101 cities with the highest number of thefts per 100,000 residents, excludes tourist destinations and others with a lot of outsiders visiting based on city industries data (population 50,000+)"
- #2 (63106) on the list of "Top 101 zip codes with the smallest percentage of taxpayers reporting net capital gain/loss in 2012 (pop 1,000+)"
- #12 (63106) on the list of "Top 101 zip codes with the lowest 2012 average taxable interest for individuals (pop 5,000+)"
- #16 (63106) on the list of "Top 101 zip codes with the lowest 2012 average Adjusted Gross Income (AGI) for individuals (pop 5,000+)"
- #24 (63106) on the list of "Top 101 zip codes with the lowest 2012 average net capital gain/loss (pop 5,000+)"
- #28 (63106) on the list of "Top 101 zip codes with the smallest percentage of taxpayers reporting taxable interest in 2012 (pop 5,000+)"
- #28 (63106) on the list of "Top 101 zip codes with the lowest average reported salary/wage in 2012 (pop 5,000+)"
- #33 (63147) on the list of "Top 101 zip codes with the largest percentage of Subsaharan African first ancestries"
- #65 (63113) on the list of "Top 101 zip codes with the largest percentage of Swiss first ancestries (pop 5,000+)"
- #73 (63107) on the list of "Top 101 zip codes with the largest percentage of Czech first ancestries (pop 5,000+)"
- #86 (63101) on the list of "Top 101 zip codes with the highest 2012 average taxable interest for individuals (pop 1,000+)"
- #4 on the list of "Top 101 counties with the lowest percentage of residents that visited a dentist within the past year"
- #7 on the list of "Top 101 counties with the largest increase in the number of births per 1000 residents 2000-2006 to 2007-2013 (pop 50,000+)"
- #7 on the list of "Top 101 counties with the highest number of infant deaths per 1000 residents 2007-2013 (pop. 50,000+)"
- #13 on the list of "Top 101 counties with highest percentage of residents voting for Obama (Democrat) in the 2012 Presidential Election (pop. 50,000+)"
- #14 on the list of "Top 101 counties with the largest decrease in the number of deaths per 1000 residents 2000-2006 to 2007-2013 (pop. 50,000+)"
State forum archive:

|
|
Total of 5455 patent applications in 2008-2024.


