St. Louis, MO (Missouri) Houses and Residents
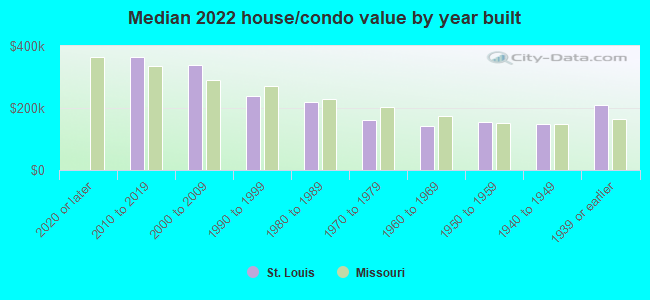
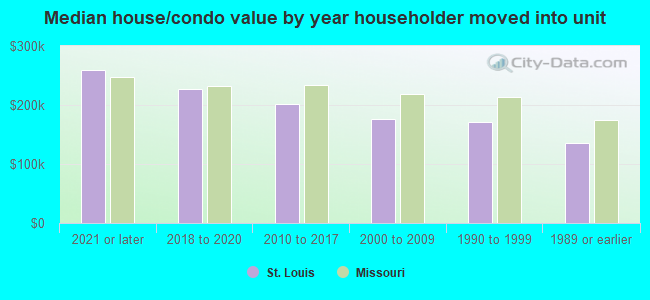
| St. Louis: | $190,400 |
| Missouri: | $221,200 |
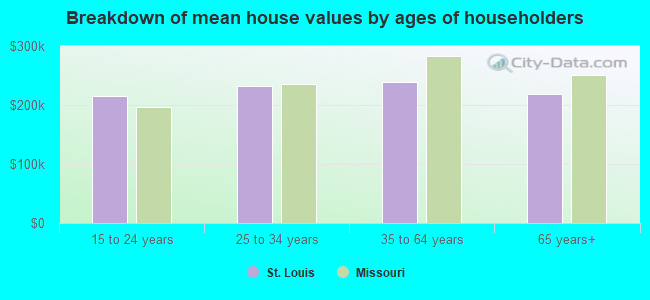
Mean price in 2022:
Detached houses: $237,512
Here: $237,512 State: $278,068 Townhouses or other attached units: $262,187
Here: $262,187 State: $260,773 In 2-unit structures: $247,783
Here: $247,783 State: $172,667 In 3-to-4-unit structures: $204,793
Here: $204,793 State: $181,162 In 5-or-more-unit structures: $350,513
Here: $350,513 State: $263,082 Mobile homes: $105,121
Here: $105,121 State: $95,912
Total population: 317,419 (All urban)
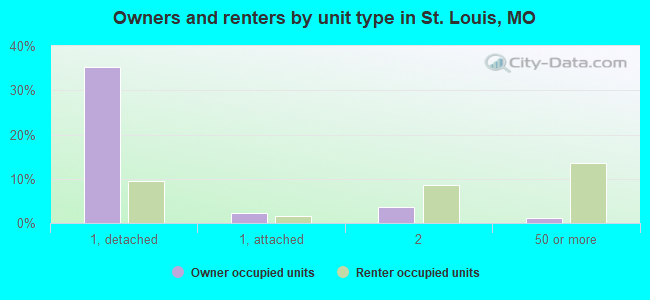
Houses: 174,049 (148,348 occupied: 69,313 owner occupied, 79,035 renter occupied)
| % of renters here: | 53% |
| State: | 32% |
Housing density: 2,811 houses/condos per square mile
Median price asked for vacant for-sale houses and condos in 2022: $53,531.
Median contract rent in 2022: $744 (lower quartile is $570, upper quartile is $988)
Median rent asked for vacant for-rent units in 2022: $857
Median gross rent in St. Louis, MO in 2022: $910
Housing units in St. Louis with a mortgage: 44,232 (4,808 second mortgage, 157 home equity loan, 4,107 both second mortgage and home equity loan)
Houses without a mortgage: 518
Median household income for houses/condos with a mortgage: $93,848
Median household income for apartments without a mortgage: $53,221
Median monthly housing costs: $960
Compare current foreclosures near St. Louis, MO:
| Photo | Address | Area | Beds / Baths | Price | Details |
|---|---|---|---|---|---|

|
#1
Deer St
Saint Louis, MO 63113
|
1,646 sq. feet
|
1 baths 3 beds |
$250,000
|
show details |

|
#2
Concord Pl
Saint Louis, MO 63147
|
768 sq. feet
|
1 baths 2 beds |
$62,000
|
show details |

|
#3
3rd St
Madison, IL 62060
|
1,232 sq. feet
|
1 baths 3 beds |
$24,900
|
show details |

|
#4
Kingston Dr
Saint Louis, MO 63125
|
1,108 sq. feet
|
1 baths 2 beds |
$189,900
|
show details |

|
#5
Cricket Ct
Florissant, MO 63033
|
1,557 sq. feet
|
2 baths 4 beds |
$90,250
|
show details |

|
#6
Adelaide Ave
Saint Louis, MO 63115
|
1,890 sq. feet
|
1 baths 4 beds |
$27,500
|
show details |

|
#7
N 15th St
Belleville, IL 62220
|
1,467 sq. feet
|
1 baths 4 beds |
$154,900
|
show details |

|
#8
Idaho Ave
Saint Louis, MO 63111
|
979 sq. feet
|
1 baths 2 beds |
$132,900
|
show details |

|
#9
Frey Ln
Fairview Heights, IL 62208
|
1,258 sq. feet
|
2 baths 3 beds |
$173,000
|
show details |

|
#10
Canton Ave
Saint Louis, MO 63130
|
1,516 sq. feet
|
1 baths 3 beds |
$179,900
|
show details |
| Photo | Address | Area | Beds / Baths | Price | Details |
|---|---|---|---|---|---|

|
#11
Ridge Ave
Saint Louis, MO 63113
|
1,868 sq. feet
|
2 baths 6 beds |
$114,900
|
show details |

|
#12
E Milton Ave
Saint Louis, MO 63114
|
1,325 sq. feet
|
1 baths 2 beds |
$184,900
|
show details |

|
#13
Rosewood Ave
Saint Louis, MO 63120
|
1,152 sq. feet
|
1 baths 2 beds |
$129,000
|
show details |

|
#14
Grants Pkwy
Florissant, MO 63031
|
986 sq. feet
|
1 baths 3 beds |
$167,000
|
show details |

|
#15
Jerries Ln
Saint Louis, MO 63136
|
1,380 sq. feet
|
1 baths 3 beds |
$229,000
|
show details |

|
#16
Saint Charles St Apt 801
Saint Louis, MO 63101
|
1,688 sq. feet
|
2 baths 1 beds |
$154,900
|
show details |

|
#17
Bagley Dr
Saint Louis, MO 63136
|
982 sq. feet
|
1 baths 2 beds |
$119,900
|
show details |

|
#18
Willow Wren Ct Unit 308
Florissant, MO 63033
|
955 sq. feet
|
2 baths 2 beds |
$78,000
|
show details |

|
#19
Ross Ave
Saint Louis, MO 63146
|
1,520 sq. feet
|
2 baths 3 beds |
$218,400
|
show details |

|
#20
Velma Ave
South Roxana, IL 62087
|
1,008 sq. feet
|
1 baths 3 beds |
$39,900
|
show details |
| Photo | Address | Area | Beds / Baths | Price | Details |
|---|---|---|---|---|---|

|
#21
Lucinda Dr
Fairview Heights, IL 62208
|
1,040 sq. feet
|
2 baths 2 beds |
$165,000
|
show details |

|
#22
Louisiana Ave
Saint Louis, MO 63118
|
2,360 sq. feet
|
2 baths 2 beds |
$187,000
|
show details |

|
#23
Miami St
Saint Louis, MO 63118
|
3,732 sq. feet
|
4 baths 4 beds |
$89,900
|
show details |

|
#24
Hodiamont Ave # E4
Saint Louis, MO 63112
|
1 sq. feet
|
2 baths 2 beds |
$167,000
|
show details |

|
#25
Old Jamestown Rd
Florissant, MO 63034
|
1,440 sq. feet
|
2 baths 3 beds |
$112,300
|
show details |

|
#26
Hannover Ave
Saint Louis, MO 63123
|
912 sq. feet
|
1 baths 2 beds |
$159,900
|
show details |

|
#27
Hamilton Ave
Saint Louis, MO 63136
|
832 sq. feet
|
1 baths 2 beds |
$17,900
|
show details |

|
#28
Optimist Dr
Belleville, IL 62220
|
- sq. feet
|
1 baths 3 beds |
$57,200
|
show details |

|
#29
Oregon Ave
Saint Louis, MO 63118
|
1,782 sq. feet
|
2 baths - beds |
$12,000
|
show details |

|
#30
S 18th St
Belleville, IL 62226
|
- sq. feet
|
1 baths 4 beds |
$47,250
|
show details |
| Photo | Address | Area | Beds / Baths | Price | Details |
|---|---|---|---|---|---|

|
#31
Majella Dr
Bridgeton, MO 63044
|
- sq. feet
|
1 baths 3 beds |
$88,400
|
show details |

|
#32
Saint Norbert Dr
East Saint Louis, IL 62206
|
1,232 sq. feet
|
1 baths 3 beds |
$1
|
show details |

|
#33
Bunkum Rd
Fairview Heights, IL 62208
|
- sq. feet
|
2 baths 3 beds |
$94,900
|
show details |

|
#34
Summit Pl
Saint Louis, MO 63136
|
1,039 sq. feet
|
1 baths - beds |
$15,900
|
show details |

|
#35
Paris Ave
Saint Louis, MO 63115
|
1,650 sq. feet
|
1 baths - beds |
$24,900
|
show details |

|
#36
S Spring Ave
Saint Louis, MO 63116
|
1,592 sq. feet
|
1 baths 3 beds |
show details | |

|
#37
Bexley Station Dr # 8j
Saint Louis, MO 63123
|
951 sq. feet
|
2 baths 2 beds |
show details | |

|
#38
Northland Pl
Saint Louis, MO 63113
|
1,736 sq. feet
|
1 baths - beds |
$23,900
|
show details |

|
#39
Grover St
Saint Louis, MO 63112
|
792 sq. feet
|
1 baths - beds |
$12,000
|
show details |

|
#40
Edwards St
Granite City, IL 62040
|
828 sq. feet
|
- baths 2 beds |
$39,900
|
show details |
| Photo | Address | Area | Beds / Baths | Price | Details |
|---|---|---|---|---|---|

|
#41
Vernon Ave
Saint Louis, MO 63113
|
2,512 sq. feet
|
2 baths 5 beds |
show details | |

|
#42
Taylor Ave
Bridgeton, MO 63044
|
2,252 sq. feet
|
3 baths 4 beds |
show details | |

|
#43
Pershing Blvd
Granite City, IL 62040
|
535 sq. feet
|
1 baths 1 beds |
show details | |

|
#44
N 80th St
East Saint Louis, IL 62203
|
952 sq. feet
|
1 baths 3 beds |
show details | |

|
#45
Decatur Dr
Saint Louis, MO 63123
|
792 sq. feet
|
2 baths 2 beds |
show details | |

|
#46
& 636 Lincoln Street
Venice, IL 62090
|
- sq. feet
|
1 baths 1 beds |
show details | |

|
#47
Lotus Ave
Saint Louis, MO 63113
|
960 sq. feet
|
1 baths 3 beds |
show details | |

|
#48
Astoria Dr
Saint Louis, MO 63137
|
982 sq. feet
|
1 baths 2 beds |
show details | |

|
#49
Huckleberry Dr
Florissant, MO 63033
|
1,329 sq. feet
|
2 baths 4 beds |
show details | |

|
Check over 1 million property listings on Foreclosure.com!
|
browse all offers | |||


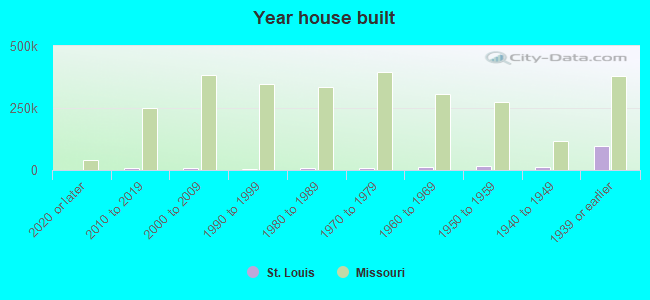
Median year apartment built: 1947
Household type by relationship:
Households: 286,578- Male householders: 67,288 (34,782 living alone), Female householders: 81,060 (35,731 living alone)
37,495 spouses (36,089 opposite-sex spouses), 11,770 unmarried partners, (10,548 opposite-sex unmarried partners), 57,076 children (54,055 natural, 931 adopted, 2,090 stepchildren), 6,119 grandchildren, 3,427 brothers or sisters, 1,845 parents, 959 foster children, 1,603 other relatives, 7,051 non-relatives
- In group quarters: 10,885
Size of family households: 34,270 2-persons, 13,942 3-persons, 9,314 4-persons, 4,017 5-persons, 2,225 6-persons, 311 7-or-more-persons.
Size of nonfamily households: 70,513 1-person, 11,900 2-persons, 1,444 3-persons, 75 4-persons, 295 5-persons, 42 6-persons.
21,067 married couples with children.
22,768 single-parent households (4,437 men, 18,331 women).
90.6% of residents of St. Louis speak English at home.
2.8% of residents speak Spanish at home (72% speak English very well, 12% speak English well, 10% speak English not well, 6% don't speak English at all).
2.8% of residents speak other Indo-European language at home (73% speak English very well, 14% speak English well, 12% speak English not well, 1% don't speak English at all).
2.1% of residents speak Asian or Pacific Island language at home (54% speak English very well, 25% speak English well, 19% speak English not well, 2% don't speak English at all).
1.7% of residents speak other language at home (71% speak English very well, 17% speak English well, 11% speak English not well, 2% don't speak English at all).
Foreign born population: 17,611 (6.1%)
(42.9% of them are naturalized citizens)
| Here: | 5.9 |
| State: | 6.4 |
| Here: | 3.9 |
| State: | 4.4 |
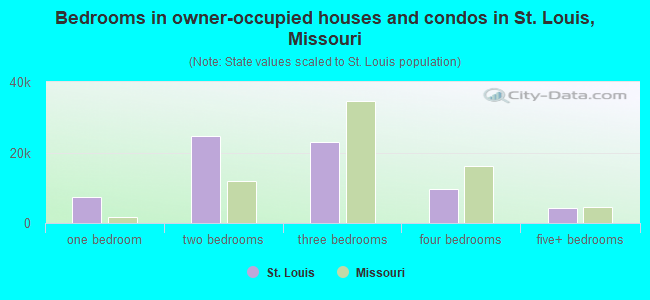
- Bedrooms in owner-occupied houses and condos in St. Louis, Missouri
- 71no bedroom
- 7,4361 bedroom
- 24,6562 bedrooms
- 23,0883 bedrooms
- 9,7024 bedrooms
- 4,3605+ bedrooms
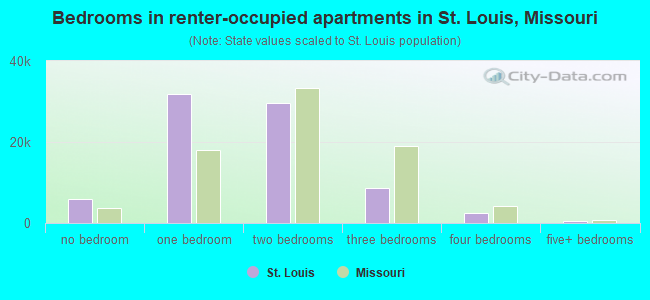
- Bedrooms in renter-occupied apartments in St. Louis, Missouri
- 5,831no bedroom
- 31,9341 bedroom
- 29,7062 bedrooms
- 8,6573 bedrooms
- 2,3534 bedrooms
- 5545+ bedrooms
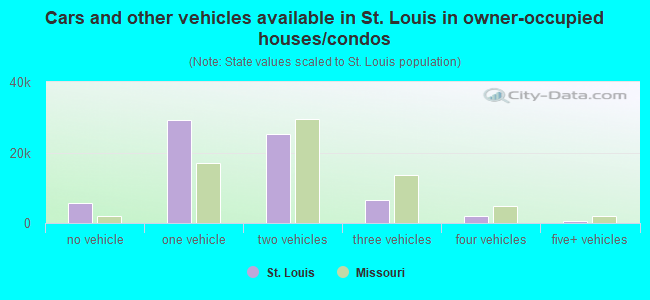
- Cars and other vehicles available in St. Louis in owner-occupied houses/condos
- 5,554no vehicle
- 29,2721 vehicle
- 25,1472 vehicles
- 6,6613 vehicles
- 2,1274 vehicles
- 5525+ vehicles
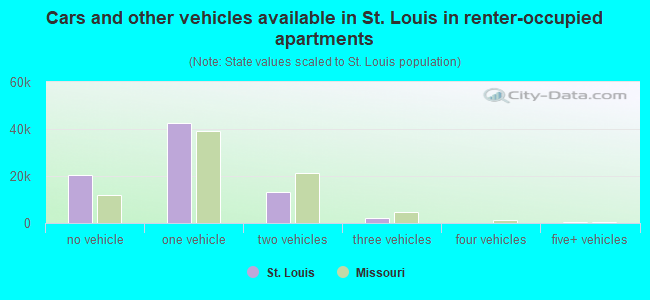
- Cars and other vehicles available in St. Louis in renter-occupied apartments
- 20,627no vehicle
- 42,6751 vehicle
- 12,9972 vehicles
- 2,2303 vehicles
- 1984 vehicles
- 3085+ vehicles
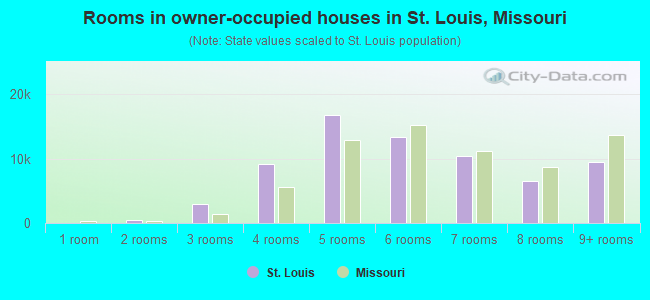
- Rooms in owner-occupied houses in St. Louis, Missouri
- 711 room
- 5072 rooms
- 2,8883 rooms
- 9,2434 rooms
- 16,8015 rooms
- 13,4156 rooms
- 10,3997 rooms
- 6,5478 rooms
- 9,4429+ rooms
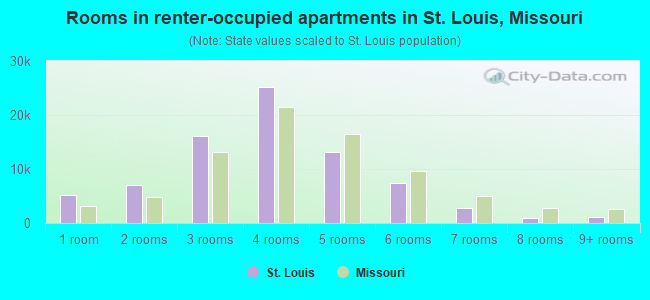
- Rooms in renter-occupied apartments in St. Louis, Missouri
- 5,2141 room
- 7,0502 rooms
- 16,0923 rooms
- 25,2524 rooms
- 13,1915 rooms
- 7,3286 rooms
- 2,7967 rooms
- 9848 rooms
- 1,1289+ rooms
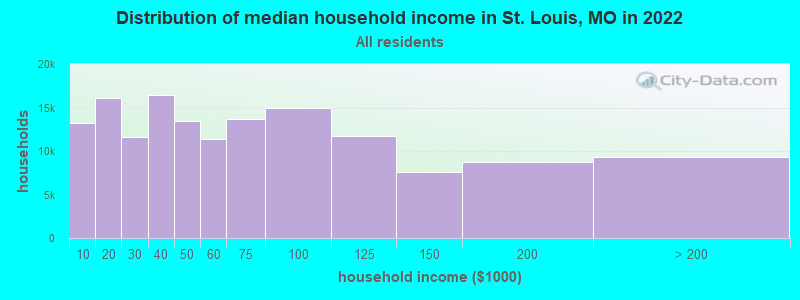
St. Louis, MO household income distribution

- 13,224Less than $10,000
- 16,104$10,000 to $19,999
- 11,592$20,000 to $29,999
- 16,460$30,000 to $39,999
- 13,447$40,000 to $49,999
- 11,416$50,000 to $59,999
- 13,696$60,000 to $74,999
- 14,962$75,000 to $99,999
- 11,767$100,000 to $124,999
- 7,596$125,000 to $149,999
- 8,768$150,000 to $199,999
- 9,316$200,000 or more
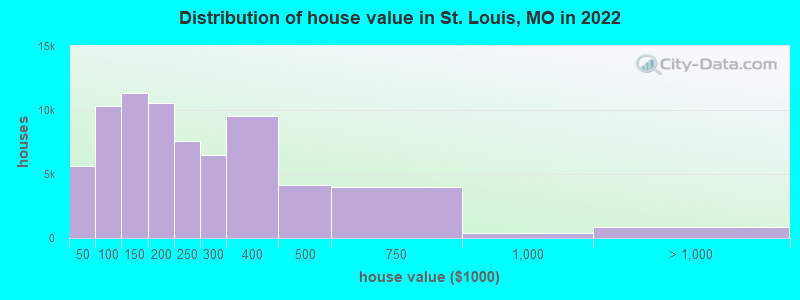
Home value of owner - occupied houses in 2022 in St. Louis, MO
-
- 650Less than $10,000
- 304$10,000 to $14,999
- 291$15,000 to $19,999
- 616$20,000 to $24,999
- 502$25,000 to $29,999
- 1,359$30,000 to $34,999
- 483$35,000 to $39,999
- 1,445$40,000 to $49,999
- 1,160$50,000 to $59,999
- 1,729$60,000 to $69,999
- 1,961$70,000 to $79,999
- 2,446$80,000 to $89,999
- 1,578$90,000 to $99,999
- 5,880$100,000 to $124,999
- 5,432$125,000 to $149,999
- 6,036$150,000 to $174,999
- 4,519$175,000 to $199,999
- 7,570$200,000 to $249,999
- 6,501$250,000 to $299,999
- 9,528$300,000 to $399,999
- 4,172$400,000 to $499,999
- 3,961$500,000 to $749,999
- 352$750,000 to $999,999
- 407$1,000,000 to $1,499,999
- 160$1,500,000 to $1,999,999
- 271$2,000,000 or more
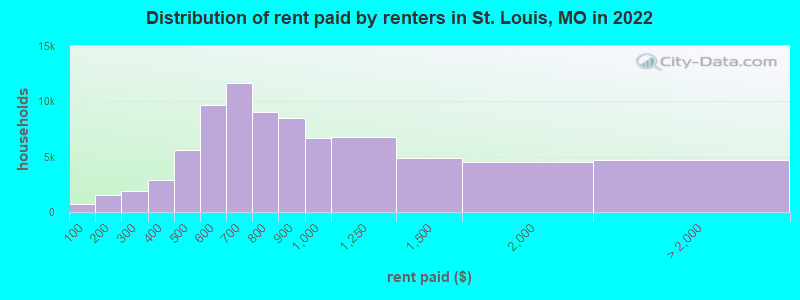
Rent paid by renters in 2022 in St. Louis, MO
-
- 712Less than $100
- 1,039$100 to $149
- 541$150 to $199
- 868$200 to $249
- 991$250 to $299
- 1,059$300 to $349
- 1,865$350 to $399
- 3,165$400 to $449
- 2,412$450 to $499
- 4,319$500 to $549
- 5,315$550 to $599
- 7,276$600 to $649
- 4,425$650 to $699
- 4,823$700 to $749
- 4,191$750 to $799
- 8,511$800 to $899
- 6,681$900 to $999
- 6,753$1,000 to $1,249
- 4,844$1,250 to $1,499
- 4,520$1,500 to $1,999
- 1,062$2,000 to $2,499
- 962$2,500 to $2,999
- 168$3,500 or more
- 2,533No cash rent
Percentage of workers working in this county: 60.6%
Number of people working at home: 26,543 (17.6% of all workers)
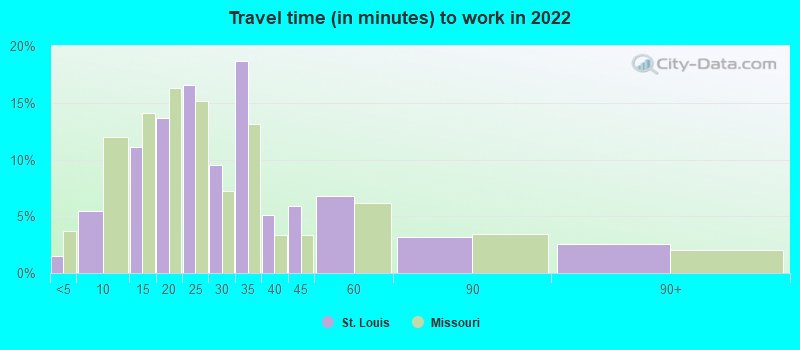
Travel time to work (commute)
- Less than 5 minutes: 2,230
- 5 to 9 minutes: 9,742
- 10 to 14 minutes: 21,169
- 15 to 19 minutes: 19,214
- 20 to 24 minutes: 27,773
- 25 to 29 minutes: 8,704
- 30 to 34 minutes: 17,330
- 35 to 39 minutes: 4,098
- 40 to 44 minutes: 5,535
- 45 to 59 minutes: 4,248
- 60 to 89 minutes: 1,976
- 90 or more minutes: 2,593
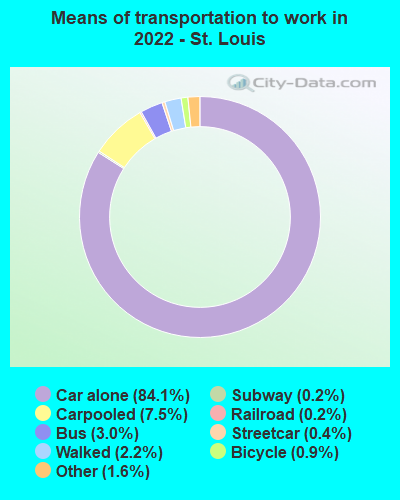
Means of transportation to work:
- Drove a car alone: 172,183 (74.4%)
- Carpooled: 15,275 (6.6%)
- Bus: 6,119 (2.6%)
- Subway or elevated rail: 720 (0.3%)
- Long-distance train or commuter rail: 362 (0.2%)
- Light rail, streetcar or trolley: 457 (0.2%)
- Taxi: 3,302 (1.4%)
- Bicycle: 1,842 (0.8%)
- Walked: 4,569 (2.0%)
- Worked at home: 26,543 (11.5%)
- Unemployment by race in 2022
- Unemployment rate for White non-Hispanic residents
- 3.2%Males
- 2.6%Females
- Unemployment rate for Black residents
- 9.2%Males
- 5.0%Females
- Unemployment rate for American Indian and Alaska Native residents
- 9.9%Females
- Unemployment rate for Asian residents
- 1.7%Males
- 3.1%Females
- Unemployment rate for other race residents
- 1.1%Males
- 1.3%Females
- Unemployment rate for two or more race residents
- 5.1%Males
- 4.3%Females
- Unemployment rate for Hispanic or Latino residents
- 2.0%Males
- 1.6%Females
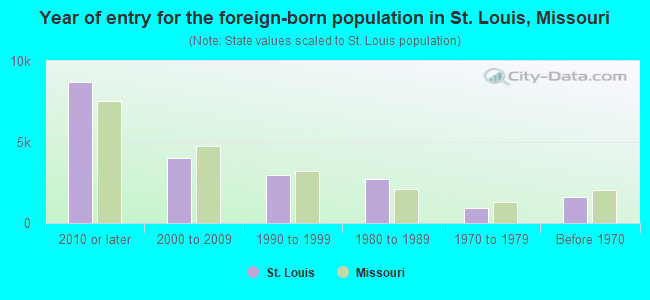
- Year of entry for the foreign-born population in St. Louis, Missouri
- 8,6782010 or later
- 3,9872000 to 2009
- 2,9841990 to 1999
- 2,7271980 to 1989
- 9451970 to 1979
- 1,633Before 1970
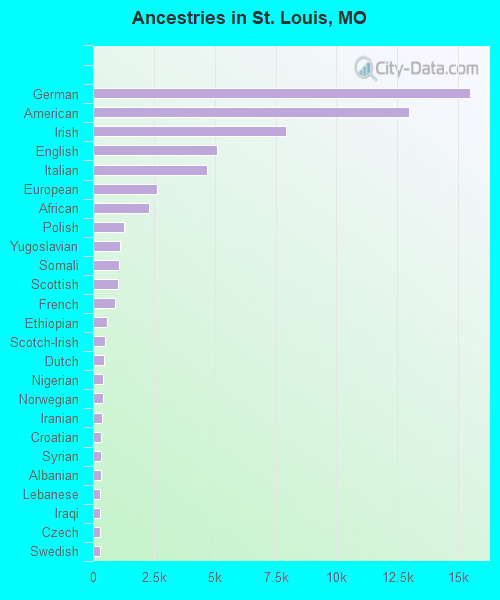
First ancestries reported:
- German: 15,492 (9.2%)
- American: 12,975 (7.7%)
- Irish: 7,946 (4.7%)
- English: 5,107 (3.0%)
- Italian: 4,695 (2.8%)
- European: 2,636 (1.6%)
- African: 2,311 (1.4%)
- Polish: 1,272 (0.8%)
- Yugoslavian: 1,100 (0.7%)
- Somali: 1,060 (0.6%)
- Scottish: 1,030 (0.6%)
- French: 920 (0.5%)
- Ethiopian: 574 (0.3%)
- Scotch-Irish: 488 (0.3%)
- Dutch: 453 (0.3%)
- Nigerian: 428 (0.3%)
- Norwegian: 408 (0.2%)
- Iranian: 378 (0.2%)
- Croatian: 347 (0.2%)
- Syrian: 337 (0.2%)
- Albanian: 332 (0.2%)
- Lebanese: 302 (0.2%)
- Iraqi: 291 (0.2%)
- Czech: 281 (0.2%)
- Swedish: 268 (0.2%)
- Eastern European: 263 (0.2%)
- Romanian: 227 (0.1%)
- Russian: 226 (0.1%)
- Hungarian: 217 (0.1%)
- British: 204 (0.1%)
- Scandinavian: 200 (0.1%)
- Greek: 189 (0.1%)
- Haitian: 181 (0.1%)
- Ukrainian: 179 (0.1%)
- Kenyan: 177 (0.1%)
- Bulgarian: 157 (0.09%)
- Northern European: 152 (0.09%)
- Ghanaian: 149 (0.09%)
- Austrian: 141 (0.08%)
- Sierra Leonean: 132 (0.08%)
- Swiss: 127 (0.08%)
- French Canadian: 96 (0.06%)
- Jamaican: 89 (0.05%)
- Canadian: 88 (0.05%)
- Liberian: 88 (0.05%)
- Lithuanian: 87 (0.05%)
- Welsh: 83 (0.05%)
- Slovak: 82 (0.05%)
- Australian: 78 (0.05%)
- Israeli: 68 (0.04%)
- Czechoslovakian: 65 (0.04%)
- Slovene: 63 (0.04%)
- Afghan: 59 (0.04%)
- Sudanese: 53 (0.03%)
- Moroccan: 50 (0.03%)
- Danish: 50 (0.03%)
- Belgian: 47 (0.03%)
- Turkish: 44 (0.03%)
- Portuguese: 40 (0.02%)
- Serbian: 40 (0.02%)
- Slavic: 39 (0.02%)
- Bermudan: 39 (0.02%)
- British West Indian: 39 (0.02%)
- Arab: 38 (0.02%)
- Macedonian: 31 (0.02%)
- Palestinian: 26 (0.02%)
- Icelander: 20 (0.01%)
- Egyptian: 18 (0.01%)
- Brazilian: 13 (0.01%)
- Trinidadian and Tobagonian: 11 (0.01%)
- Cypriot: 9 (0.01%)
Most common places of birth for foreign-born residents (%):
| St. Louis: | 10.5% (1,944) |
| Missouri: | 14.9% (38,568) |
| St. Louis: | 5.5% (1,024) |
| Missouri: | 6.6% (17,002) |
| St. Louis: | 5.5% (1,021) |
| Missouri: | 4.1% (10,700) |
| St. Louis: | 4.9% (906) |
| Missouri: | 8.9% (22,932) |
| St. Louis: | 3.9% (720) |
| Missouri: | 4.2% (10,873) |
| St. Louis: | 3.8% (701) |
| Missouri: | 3.2% (8,168) |
| St. Louis: | 3.8% (696) |
| Missouri: | 2.9% (7,525) |
| St. Louis: | 3.7% (689) |
| Missouri: | 1.7% (4,518) |
| St. Louis: | 2.4% (442) |
| Missouri: | 1.9% (4,806) |
| St. Louis: | 2.4% (438) |
| Missouri: | 3.0% (7,803) |
| St. Louis: | 2.3% (422) |
| Missouri: | 1.4% (3,640) |
| St. Louis: | 2.2% (411) |
| Missouri: | 0.3% (657) |
| St. Louis: | 2.1% (383) |
| Missouri: | 0.6% (1,478) |
| St. Louis: | 1.8% (332) |
| Missouri: | 0.1% (379) |
| St. Louis: | 1.7% (318) |
| Missouri: | 0.6% (1,625) |
| St. Louis: | 1.6% (292) |
| Missouri: | 0.7% (1,818) |
Place of birth for U.S.-born residents:
- This state: 186,603
- Other state: 81,370
- Northeast: 9,151
- Midwest: 36,448
- South: 25,252
- West: 10,519
85.0% of St. Louis residents lived in the same house 1 years ago.
Out of people who lived in different houses, 30.6% lived in this county.
Out of people who lived in different counties, 52.8% lived in Missouri.
| St. Louis: | 85.0% |
| State average: | 87.1% |
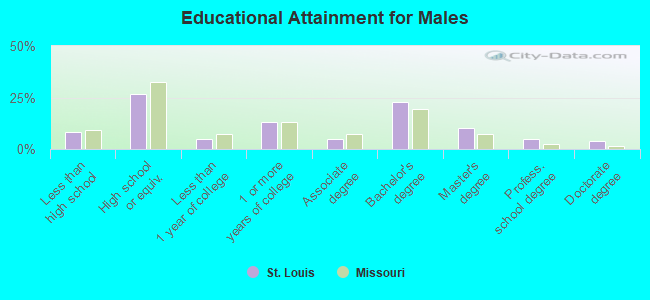
Education attainment for males 25 years and older:
- No schooling: 1,333
- Nursery to 4th grade: 271
- 5th and 6th grade: 93
- 7th and 8th grade: 1,263
- 9th grade: 870
- 10th grade: 2,268
- 11th grade: 1,085
- 12th grade, no diploma: 1,291
- High school graduate (or equivalency): 26,857
- Less than 1 year of college: 4,716
- Some college more than 1 year, no degree: 13,374
- Associate degree: 5,019
- Bachelor's degree: 23,008
- Master's degree: 10,171
- Professional school degree: 4,749
- Doctorate degree: 3,946
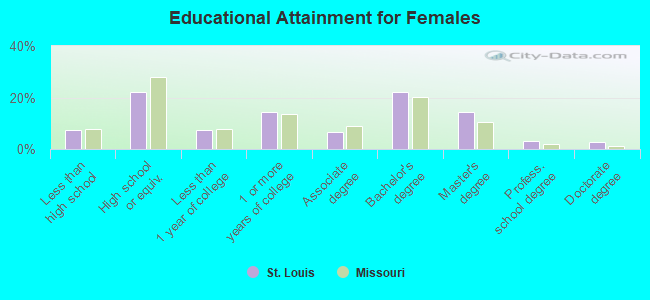
Education attainment for females 25 years and older:
- No schooling: 1,676
- Nursery to 4th grade: 0
- 5th and 6th grade: 309
- 7th and 8th grade: 1,460
- 9th grade: 548
- 10th grade: 975
- 11th grade: 1,461
- 12th grade, no diploma: 1,725
- High school graduate (or equivalency): 24,266
- Less than 1 year of college: 7,883
- Some college more than 1 year, no degree: 15,807
- Associate degree: 7,301
- Bachelor's degree: 24,042
- Master's degree: 15,769
- Professional school degree: 3,211
- Doctorate degree: 2,834
Housing units in structures:
- One, detached: 78,876
- One, attached: 5,895
- Two: 23,829
- 3 or 4: 24,286
- 5 to 9: 7,491
- 10 to 19: 4,513
- 20 to 49: 7,107
- 50 or more: 20,911
- Mobile homes: 1,040
- Boats, RVs, vans, etc.: 101
Housing units lacking complete kitchen facilities in 2022: 6.6%
House/condo owner moved in on average 13 years ago
Renter moved in on average 3 years ago
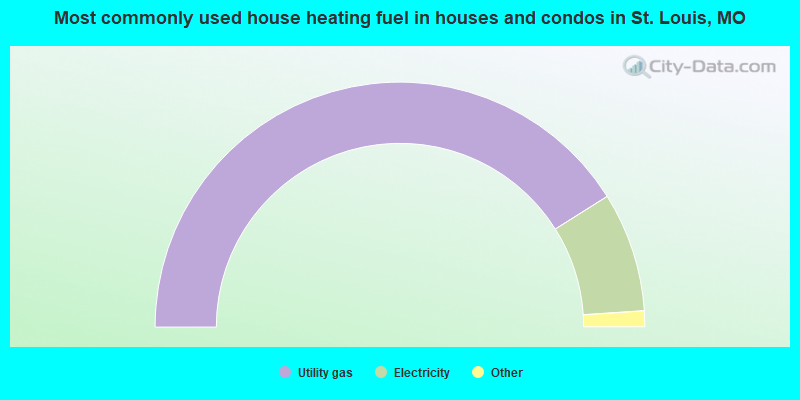
- 82.1%Utility gas
- 15.8%Electricity
- 1.3%Bottled, tank, or LP gas
- 0.3%Wood
- 0.2%No fuel used
- 0.1%Other fuel
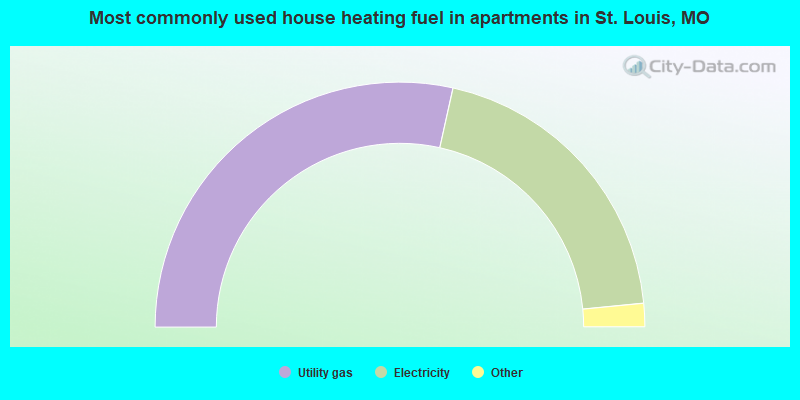
- 56.9%Utility gas
- 39.9%Electricity
- 1.5%Bottled, tank, or LP gas
- 1.0%No fuel used
- 0.5%Other fuel
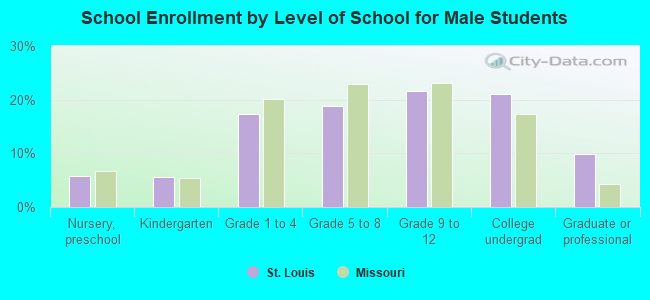
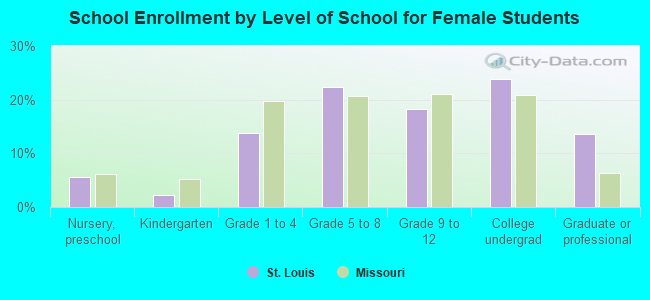
Private vs. public school enrollment:
| Here: | 14.6% |
| Missouri: | 15.4% |
| Here: | 19.0% |
| Missouri: | 13.9% |
| Here: | 43.6% |
| Missouri: | 22.6% |