Estimated zip code population in 2022: 25,885 Zip code population in 2010: 26,946 Zip code population in 2000: 29,264
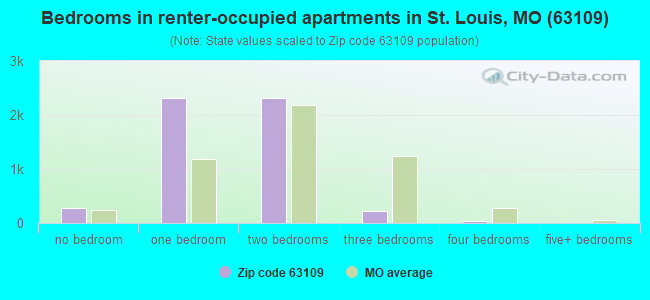
Houses and condos: 15,069 Renter-occupied apartments: 5,154
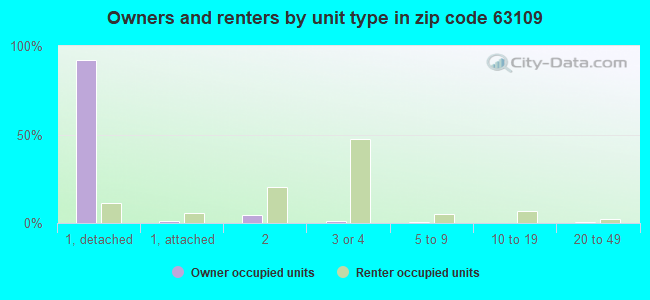
% of renters here:
36%
State:
32%
March 2022 cost of living index in zip code 63109: 95.8 (near average, U.S. average is 100)
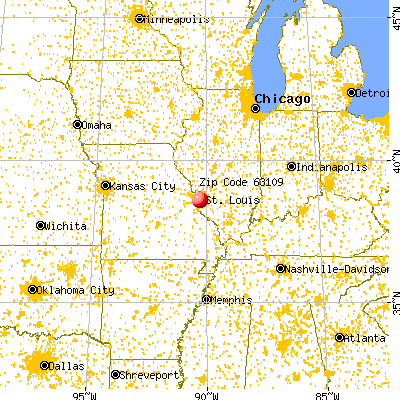
Land area: 3.6 sq. mi. Water area: 0.1 sq. mi.
Population density: 7,249 people per square mile
(high).
OSM Map
General Map
Google Map
MSN Map
OSM Map
General Map
Google Map
MSN Map
OSM Map
General Map
Google Map
MSN Map
OSM Map
General Map
Google Map
MSN Map
Please wait while loading the map...
Real estate property taxes paid for housing units in 2022:
This zip code:
1.1% ($2,675)
Missouri:
0.8% ($1,810)
Median real estate property taxes paid for housing units with mortgages in 2022: $2,602 (1.0%) Median real estate property taxes paid for housing units with no mortgage in 2022: $2,850 (1.2%)
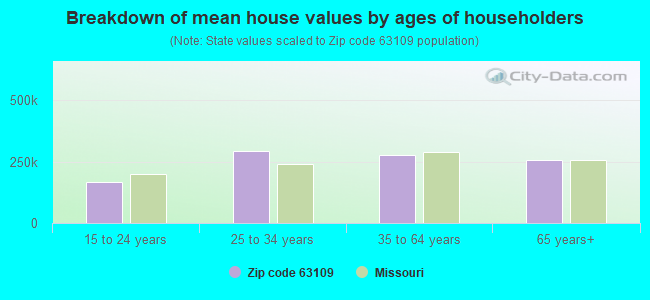
Estimated median house/condo value in 2022: $251,928
63109:
$251,928
Missouri:
$221,200
According to our research of Missouri and other state lists, there were 68 registered sex offenders living in 63109 zip code as of April 27, 2024. The ratio of all residents to sex offenders in zip code 63109 is 404 to 1. The ratio of registered sex offenders to all residents in this zip code is near the state average.
Median resident age:
This zip code:
42.1 years
Missouri median age:
39.1 years
Average household size:
This zip code:
1.8 people
Missouri:
2.4 people
Averages for the 2020 tax year for zip code 63109, filed in 2021:
Average Adjusted Gross Income (AGI) in 2020: $68,651 (Individual Income Tax Returns)
Here:
$68,651
State:
$68,151
Salary/wage: $62,917 (reported on 84.7% of returns)
Here:
$62,917
State:
$56,131
(% of AGI for various income ranges: 1267.5% for AGIs below $25k, 4041.3% for AGIs $25k-50k, 7061.1% for AGIs $50k-75k, 10278.5% for AGIs $75k-100k, 18890.1% for AGIs $100k-200k, 68741.1% for AGIs over 200k)
Taxable interest for individuals: $886 (reported on 34.1% of returns)
This zip code:
$886
Missouri:
$1,586
(% of AGI for various income ranges: 18.1% for AGIs below $25k, 19.9% for AGIs $25k-50k, 29.9% for AGIs $50k-75k, 51.4% for AGIs $75k-100k, 85.4% for AGIs $100k-200k, 604.2% for AGIs over 200k)
Ordinary dividends: $4,988 (reported on 26.3% of returns)
Here:
$4,988
State:
$10,947
(% of AGI for various income ranges: 47.3% for AGIs below $25k, 47.6% for AGIs $25k-50k, 92.8% for AGIs $50k-75k, 183.3% for AGIs $75k-100k, 357.8% for AGIs $100k-200k, 4319.5% for AGIs over 200k)
Net capital gain/loss in AGI: +$8,238 (reported on 22.7% of returns)
Here:
+$8,238
State:
+$18,453
(% of AGI for various income ranges: 19.2% for AGIs below $25k, 39.1% for AGIs $25k-50k, 86.0% for AGIs $50k-75k, 179.8% for AGIs $75k-100k, 440.3% for AGIs $100k-200k, 8636.3% for AGIs over 200k)
Profit/loss from business: +$13,562 (reported on 14.7% of returns)
Here:
+$13,562
State:
+$12,260
(% of AGI for various income ranges: 130.7% for AGIs below $25k, 126.2% for AGIs $25k-50k, 223.3% for AGIs $50k-75k, 274.0% for AGIs $75k-100k, 576.8% for AGIs $100k-200k, 3877.9% for AGIs over 200k)
Taxable individual retirement arrangement distribution: $16,933 (reported on 9.1% of returns)
63109:
$16,933
Missouri:
$19,719
(% of AGI for various income ranges: 73.2% for AGIs below $25k, 85.3% for AGIs $25k-50k, 177.7% for AGIs $50k-75k, 303.9% for AGIs $75k-100k, 566.8% for AGIs $100k-200k, 2085.8% for AGIs over 200k)
Self-employed (Keogh) retirement plans: $29,678 (reported on 0.6% of returns)
63109:
$29,678
Missouri:
$24,851
(% of AGI for various income ranges: 6.0% for AGIs $25k-50k, 30.9% for AGIs $100k-200k, 1086.8% for AGIs over 200k)
Total itemized deductions: $25,857 (reported on 9.0% of returns)
Here:
$25,857
State:
$36,651
(% of AGI for various income ranges: 61.7% for AGIs below $25k, 102.5% for AGIs $25k-50k, 233.1% for AGIs $50k-75k, 530.3% for AGIs $75k-100k, 774.6% for AGIs $100k-200k, 4664.7% for AGIs over 200k)
Charity contributions: $7,943 (reported on 6.9% of returns)
Here:
$7,943
State:
$15,671
(% of AGI for various income ranges: 4.0% for AGIs below $25k, 12.1% for AGIs $25k-50k, 29.2% for AGIs $50k-75k, 62.5% for AGIs $75k-100k, 174.7% for AGIs $100k-200k, 2094.7% for AGIs over 200k)
Taxes paid: $7,556 (reported on 9.0% of returns)
63109:
$7,556
State:
$7,608
(% of AGI for various income ranges: 9.2% for AGIs below $25k, 16.3% for AGIs $25k-50k, 70.9% for AGIs $50k-75k, 197.2% for AGIs $75k-100k, 281.2% for AGIs $100k-200k, 1016.8% for AGIs over 200k)
Earned income credit: $1,509 (reported on 8.9% of returns)
Here:
$1,509
State:
$2,315
(% of AGI for various income ranges: 54.8% for AGIs below $25k, 23.0% for AGIs $25k-50k)
Percentage of individuals using paid preparers for their 2020 taxes: 91.4%
Here:
91%
State:
93%
(% for various income ranges: 89.6% for AGIs below $25k, 91.5% for AGIs $25k-50k, 92.0% for AGIs $50k-75k, 93.1% for AGIs $75k-100k, 92.1% for AGIs $100k-200k, 93.1% for AGIs over 200k)
Averages for the 2012 tax year for zip code 63109, filed in 2013:
Average Adjusted Gross Income (AGI) in 2012: $53,023 (Individual Income Tax Returns)
Here:
$53,023
State:
$55,896
Salary/wage: $49,496 (reported on 85.2% of returns)
Here:
$49,496
State:
$46,205
(% of AGI for various income ranges: 73.7% for AGIs below $25k, 83.9% for AGIs $25k-50k, 82.1% for AGIs $50k-75k, 83.8% for AGIs $75k-100k, 81.4% for AGIs $100k-200k, 62.5% for AGIs over 200k)
Taxable interest for individuals: $1,064 (reported on 36.3% of returns)
This zip code:
$1,064
Missouri:
$1,559
(% of AGI for various income ranges: 1.8% for AGIs below $25k, 0.6% for AGIs $25k-50k, 0.8% for AGIs $50k-75k, 0.6% for AGIs $75k-100k, 0.5% for AGIs $100k-200k, 0.8% for AGIs over 200k)
Ordinary dividends: $3,766 (reported on 25.6% of returns)
Here:
$3,766
State:
$7,410
(% of AGI for various income ranges: 2.3% for AGIs below $25k, 1.5% for AGIs $25k-50k, 1.7% for AGIs $50k-75k, 1.5% for AGIs $75k-100k, 1.5% for AGIs $100k-200k, 3.3% for AGIs over 200k)
Net capital gain/loss in AGI: +$3,195 (reported on 18.2% of returns)
Here:
+$3,195
State:
+$11,579
(% of AGI for various income ranges: 0.2% for AGIs $25k-50k, 0.3% for AGIs $50k-75k, 0.7% for AGIs $75k-100k, 1.1% for AGIs $100k-200k, 5.5% for AGIs over 200k)
Profit/loss from business: +$12,765 (reported on 13.1% of returns)
Here:
+$12,765
State:
+$11,688
(% of AGI for various income ranges: 7.1% for AGIs below $25k, 2.9% for AGIs $25k-50k, 1.8% for AGIs $50k-75k, 1.4% for AGIs $75k-100k, 3.1% for AGIs $100k-200k, 5.6% for AGIs over 200k)
Taxable individual retirement arrangement distribution: $12,436 (reported on 10.5% of returns)
63109:
$12,436
Missouri:
$14,773
(% of AGI for various income ranges: 3.7% for AGIs below $25k, 1.9% for AGIs $25k-50k, 2.5% for AGIs $50k-75k, 2.3% for AGIs $75k-100k, 2.5% for AGIs $100k-200k, 2.7% for AGIs over 200k)
Self-employment retirement plans: $17,438 (reported on 0.5% of returns)
63109:
$17,438
Missouri:
$20,502
(% of AGI for various income ranges: 0.2% for AGIs $100k-200k, 0.9% for AGIs over 200k)
Total itemized deductions: $17,666 (20% of AGI, reported on 36.8% of returns)
Here:
$17,666
State:
$22,730
Here:
19.6% of AGI
State:
19.2% of AGI
(% of AGI for various income ranges: 10.0% for AGIs below $25k, 8.8% for AGIs $25k-50k, 12.5% for AGIs $50k-75k, 13.7% for AGIs $75k-100k, 14.3% for AGIs $100k-200k, 12.3% for AGIs over 200k)
Charity contributions: $2,659 (reported on 30.0% of returns)
Here:
$2,659
State:
$4,745
(% of AGI for various income ranges: 0.8% for AGIs below $25k, 0.8% for AGIs $25k-50k, 1.3% for AGIs $50k-75k, 1.5% for AGIs $75k-100k, 2.0% for AGIs $100k-200k, 2.3% for AGIs over 200k)
Taxes paid: $7,127 (reported on 36.7% of returns)
63109:
$7,127
State:
$8,399
(% of AGI for various income ranges: 1.9% for AGIs below $25k, 2.5% for AGIs $25k-50k, 4.4% for AGIs $50k-75k, 5.5% for AGIs $75k-100k, 6.7% for AGIs $100k-200k, 6.7% for AGIs over 200k)
Earned income credit: $1,870 (reported on 12.0% of returns)
Here:
$1,870
State:
$2,288
(% of AGI for various income ranges: 4.2% for AGIs below $25k, 0.5% for AGIs $25k-50k)
Percentage of individuals using paid preparers for their 2012 taxes: 46.1%
Here:
46%
State:
55%
(% for various income ranges: 46.4% for AGIs below $25k, 42.0% for AGIs $25k-50k, 47.7% for AGIs $50k-75k, 46.8% for AGIs $75k-100k, 49.7% for AGIs $100k-200k, 66.7% for AGIs over 200k)
Averages for the 2004 tax year for zip code 63109, filed in 2005:
Average Adjusted Gross Income (AGI) in 2004: $43,551 (Individual Income Tax Returns)
Here:
$43,551
State:
$44,591
Salary/wage: $41,697 (reported on 84.1% of returns)
Here:
$41,697
State:
$38,941
(% of AGI for various income ranges: 83.4% for AGIs below $10k, 74.2% for AGIs $10k-25k, 84.2% for AGIs $25k-50k, 83.0% for AGIs $50k-75k, 85.5% for AGIs $75k-100k, 73.6% for AGIs over 100k)
Taxable interest for individuals: $1,761 (reported on 48.1% of returns)
This zip code:
$1,761
Missouri:
$1,801
(% of AGI for various income ranges: 6.2% for AGIs below $10k, 3.8% for AGIs $10k-25k, 1.8% for AGIs $25k-50k, 1.9% for AGIs $50k-75k, 1.4% for AGIs $75k-100k, 1.5% for AGIs over 100k)
Taxable dividends: $3,142 (reported on 31.0% of returns)
Here:
$3,142
State:
$3,677
(% of AGI for various income ranges: 4.3% for AGIs below $10k, 2.8% for AGIs $10k-25k, 1.7% for AGIs $25k-50k, 1.8% for AGIs $50k-75k, 1.7% for AGIs $75k-100k, 3.2% for AGIs over 100k)
Net capital gain/loss: +$4,064 (reported on 22.1% of returns)
Here:
+$4,064
State:
+$8,915
(% of AGI for various income ranges: -1.4% for AGIs below $10k, 0.3% for AGIs $10k-25k, 0.6% for AGIs $25k-50k, 0.7% for AGIs $50k-75k, 1.1% for AGIs $75k-100k, 6.1% for AGIs over 100k)
Profit/loss from business: +$10,440 (reported on 11.3% of returns)
Here:
+$10,440
State:
+$9,793
(% of AGI for various income ranges: 6.2% for AGIs below $10k, 4.0% for AGIs $10k-25k, 1.9% for AGIs $25k-50k, 1.9% for AGIs $50k-75k, 2.1% for AGIs $75k-100k, 3.8% for AGIs over 100k)
IRA payment deduction: $2,708 (reported on 2.4% of returns)
63109:
$2,708
Missouri:
$2,972
(% of AGI for various income ranges: 0.3% for AGIs $10k-25k, 0.2% for AGIs $25k-50k, 0.1% for AGIs $50k-75k, 0.1% for AGIs $75k-100k, 0.1% for AGIs over 100k)
Self-employed pension: $11,143 (reported on 0.6% of returns)
Here:
$11,143
Missouri:
$14,365
(% of AGI for various income ranges: 0.1% for AGIs $10k-25k, 0.1% for AGIs $25k-50k, 0.0% for AGIs $50k-75k, 0.1% for AGIs $75k-100k, 0.4% for AGIs over 100k)
Total itemized deductions: $14,795 (21% of AGI, reported on 38.1% of returns)
Here:
$14,795
State:
$18,261
Here:
20.7% of AGI
State:
20.5% of AGI
(% of AGI for various income ranges: 13.2% for AGIs below $10k, 9.8% for AGIs $10k-25k, 10.9% for AGIs $25k-50k, 14.2% for AGIs $50k-75k, 15.1% for AGIs $75k-100k, 13.5% for AGIs over 100k)
Charity contributions deductions: $2,410 (3% of AGI, reported on 33.6% of returns)
Here:
$2,410
State:
$3,665
Here:
3.3% of AGI
State:
3.9% of AGI
(% of AGI for various income ranges: 0.8% for AGIs below $10k, 1.2% for AGIs $10k-25k, 1.3% for AGIs $25k-50k, 1.8% for AGIs $50k-75k, 2.0% for AGIs $75k-100k, 2.7% for AGIs over 100k)
Total tax: $5,865 (reported on 81.6% of returns)
63109:
$5,865
State:
$6,999
(% of AGI for various income ranges: 2.2% for AGIs below $10k, 4.7% for AGIs $10k-25k, 8.5% for AGIs $25k-50k, 10.2% for AGIs $50k-75k, 10.8% for AGIs $75k-100k, 16.9% for AGIs over 100k)
Earned income credit: $1,407 (reported on 9.5% of returns)
Here:
$1,407
State:
$1,728
Percentage of individuals using paid preparers for their 2004 taxes: 51.8%
Here:
52%
State:
62%
(% for various income ranges: 47.6% for AGIs below $10k, 55.6% for AGIs $10k-25k, 49.0% for AGIs $25k-50k, 53.5% for AGIs $50k-75k, 53.3% for AGIs $75k-100k, 55.3% for AGIs over 100k)
Likely homosexual households (counted as self-reported same-sex unmarried-partner households)
Lesbian couples: 0.3% of all households
Gay men: 0.2% of all households
Household received Food Stamps/SNAP in the past 12 months: 783 Household did not receive Food Stamps/SNAP in the past 12 months: 13,505
Women who had a birth in the past 12 months: 363 (326 now married, 25 unmarried) Women who did not have a birth in the past 12 months: 5,729 (2,271 now married, 3,462 unmarried)
Housing units in zip code 63109 with a mortgage: 6,137 (502 second mortgage, 4 home equity loan, 486 both second mortgage and home equity loan) Houses without a mortgage: 87
Median monthly owner costs for units with a mortgage: $1,479 Median monthly owner costs for units without a mortgage: $618
Residents with income below the poverty level in 2022:
This zip code:
8.3%
Whole state:
13.2%
Residents with income below 50% of the poverty level in 2022:
This zip code:
5.2%
Whole state:
6.8%
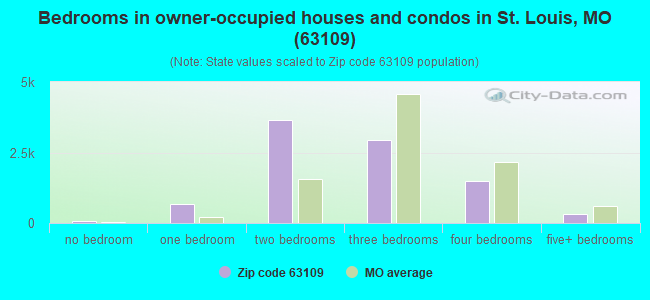
Median number of rooms in houses and condos:
Here:
5.9
State:
6.4
Median number of rooms in apartments:
Here:
4.1
State:
4.4
Notable locations in this zip code not listed on our city pages
Notable locations in zip code 63109: Saint Louis City Engine House Number 36 Fire Station (A), Saint Louis Fire Department Station 31 (B). Display/hide their locations on the map
Churches in zip code 63109 include: Saint Mary Magdalen Church (A), Saint Gabriel the Archangel Church (B), Saint Raphael the Archangel Catholic Church (C), Saint Marks Episcopal Church (D), Saint Gabriels Convent (E), Saint Andrew Presbyterian Church (F), Redeemer Evangelical United Church of Christ (G), Our Lady of Sorrow Catholic Church (H), Lindenwood Baptist Church (I). Display/hide their locations on the map
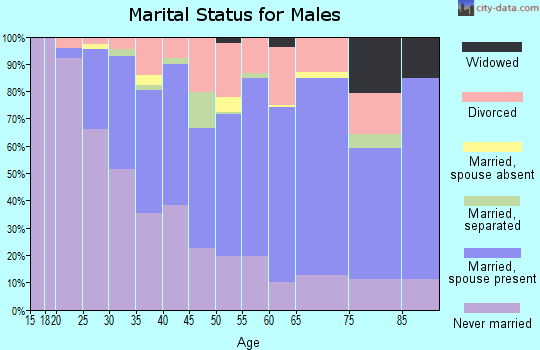
2,890 married couples with children.
871 single-parent households (364 men, 507 women).
93.8% of residents of 63109 zip code speak English at home.
1.5% of residents speak Spanish at home (66% very well, 15% well, 19% not well).
3.4% of residents speak other Indo-European language at home (61% very well, 18% well, 22% not well).
1.0% of residents speak Asian or Pacific Island language at home (51% very well, 2% well, 47% not well).
0.3% of residents speak other language at home (37% very well, 54% well, 10% not at all).
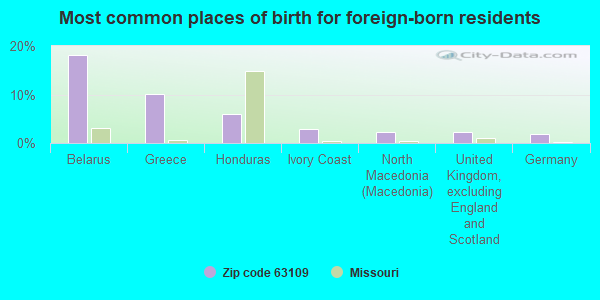
Foreign born population: 1,076 (4.2%) (58.8% of them are naturalized citizens)
This zip code:
4.2%
Whole state:
4.1%
18%Belarus
10%Greece
6%Honduras
3%Ivory Coast
2%North Macedonia (Macedonia)
2%United Kingdom, excluding England and Scotland
2%Germany
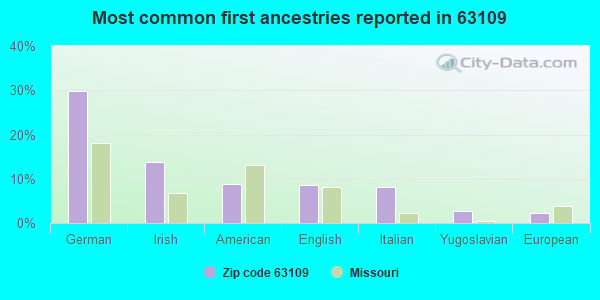
30%German
14%Irish
9%American
9%English
8%Italian
3%Yugoslavian
2%European
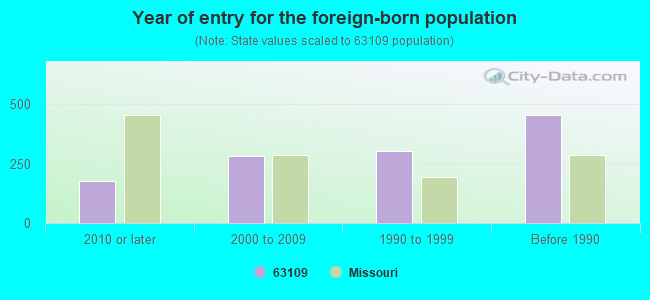
Year of entry for the foreign-born population
1762010 or later
2822000 to 2009
3041990 to 1999
454Before 1990
Major facilities with environmental interests located in this zip code:
JAMES P GEORGIA & LOUISE L GEORGIA (5006 CHIPPEWA, 1 E in SAINT LOUIS, MO)
ENFORCEMENT/COMPLIANCE ACTIVITY (Integrated Compliance Information System) - ICIS-07-2002-0008, FORMAL ENFORCEMENT ACTION (Integrated Compliance Information System) - ICIS-07-2002-0008, FORMAL ENFORCEMENT ACTION STATE MASTER (Missouri monitoring and compilance) - ICIS-22488, ENFORCEMENT/COMPLIANCE ACTIVITY,
FIRESTONE TIRE & SERVICE CENTERS (6211 CHIPPEWA STREET in SAINT LOUIS, MO)
AIR MINOR (AIRS/AFS) (Integrated Compliance Information System) - ICIS-07-2001-0078, FORMAL ENFORCEMENT ACTION STATE MASTER (Missouri monitoring and compilance) - ICIS-25400, ENFORCEMENT/COMPLIANCE ACTIVITY, AIRS/AFS-MO0994519, AIR MINOR, RCRAINFO-MOD150019891, NOT IN A UNIVERSE (Resource Conservation and Recovery Act (tracking hazardous waste)) Business SIC classification: GENERAL AUTOMOTIVE REPAIR SHOPS Organizations: FIRESTONE INC (CONTACT/OWNER)
Alternative names: FIRESTONE STORES 21K5
NIEBLING AUTO REPAIR INC (5208 S KINGSHIGHWAY BLVD in SAINT LOUIS, MO)
AIR MINOR (AIRS/AFS) STATE MASTER (Missouri monitoring and compilance) - AIRS/AFS-MO0959766, AIR MINOR, RCRAINFO-MOD031075237, NOT IN A UNIVERSE (Resource Conservation and Recovery Act (tracking hazardous waste)) Business SIC classification: GENERAL AUTOMOTIVE REPAIR SHOPS Organizations: THOMAS M NIEBLING (CONTACT/OWNER)
CHIPPEWA MARTINIZING CLEANERS (6043 CHIPPEWA STREET in SAINT LOUIS, MO)
AIR MINOR (AIRS/AFS) STATE MASTER (Missouri monitoring and compilance) - RCRAINFO-MOD985818707, SQG, NEI-NTI34744, AIR PROGRAM, NTI-NTI34744, CRITERIA AND HAZARDOUS AIR POLLUTANT INVENTORY (Inventory of air pollution sources) Small Quantity Generators, between 100 kg and 1000 kg of hazardous waste/month (Resource Conservation and Recovery Act (tracking hazardous waste)) - notification Business SIC classification: DRYCLEANING PLANTS, EXCEPT RUG CLEANING Business NAICS classification: DRYCLEANING AND LAUNDRY SERVICES (EXCEPT COIN-OPERATED). Organizations: SHIH SHIN-SHENG (CONTACT/OWNER)
Alternative names: CHIPPEWA ONE HOUR MARTINIZING, CHIPPEWA CLEANERS
BARGAIN TIRE (5820 HAMPTON in ST LOUIS, MO)
STATE MASTER (Missouri monitoring and compilance) - RCRAINFO-MOP000502856, NOT IN A UNIVERSE (Resource Conservation and Recovery Act (tracking hazardous waste))
BG OSCAR P HAMPTON USARC (4350 S KINGSHIGHWAY BLVD in ST LOUIS, MO) . Federal Facility. U.S. ARMY
STATE MASTER (Missouri monitoring and compilance) - RCRAINFO-MO3210490089, CESQG (Resource Conservation and Recovery Act (tracking hazardous waste)) Organizations: 89TH REGIONAL SUPPORT COMMAND (CONTACT/OPERATOR)
EXCEL AUTOMOTIVE (4501 HAMPTON in ST LOUIS, MO)
STATE MASTER (Missouri monitoring and compilance) - RCRAINFO-MOP000509745, SQG (Resource Conservation and Recovery Act (tracking hazardous waste)) Business NAICS classification: GENERAL AUTOMOTIVE REPAIR. Organizations: LEO MONTELONE (CONTACT/OPERATOR)
, LEO MONTELEONE (CONTACT/OWNER)
GENES ONE STOP CLEANERS (4701 S KINGSHIGHWAY in ST LOUIS, MO)
STATE MASTER (Missouri monitoring and compilance) - RCRAINFO-MOP000502971, NOT IN A UNIVERSE (Resource Conservation and Recovery Act (tracking hazardous waste)) Organizations: MIRIAM KAPELUSZ (CONTACT/OPERATOR)
GOODYEAR AUTO SVC CTR (5875 CHIPPEWA AVE in ST LOUIS, MO)
STATE MASTER (Missouri monitoring and compilance) - RCRAINFO-MOD079892097, NOT IN A UNIVERSE (Resource Conservation and Recovery Act (tracking hazardous waste)) Organizations: GOODYEAR T&R CO (CONTACT/OPERATOR)
AMERICAN CLEANERS HAMPTON (4631 HAMPTON in ST. LOUIS, MO)
AIR SYNTHETIC MINOR (AIRS/AFS) STATE MASTER (Missouri monitoring and compilance) - AIRS/AFS-MO0064078, AIR SYNTHETIC MINOR, RCRAINFO-MOD981129349, SQG CRITERIA AND HAZARDOUS AIR POLLUTANT INVENTORY (Inventory of air pollution sources) Small Quantity Generators, between 100 kg and 1000 kg of hazardous waste/month (Resource Conservation and Recovery Act (tracking hazardous waste)) - notification Business SIC classification: DRYCLEANING PLANTS, EXCEPT RUG CLEANING Organizations: JOSEPH MACH (CONTACT/OWNER)
Alternative names: AMERICAN CLEANERS-HAMPTON STREET
AMOCO HUCKS FOOD AND FUEL (6901 HAMPTON AVENUE in SAINT LOUIS, MO)
STATE MASTER (Missouri monitoring and compilance) - RCRAINFO-MOD985802909, NOT IN A UNIVERSE (Resource Conservation and Recovery Act (tracking hazardous waste)) Organizations: AMOCO DIRECT OPERATIOS (CONTACT/OWNER)
AMOCO OIL CO (5300 HAMPTON AVE in SAINT LOUIS, MO)
STATE MASTER (Missouri monitoring and compilance) - RCRAINFO-MOD981725450, SQG (Resource Conservation and Recovery Act (tracking hazardous waste)) Organizations: AMOCO OIL COMPANY (CONTACT/OWNER)
BENDER GRAPHICS (8631 GRAVOIS in ST LOUIS, MO)
STATE MASTER (Missouri monitoring and compilance) - RCRAINFO-MOP000010918, NOT IN A UNIVERSE (Resource Conservation and Recovery Act (tracking hazardous waste)) Organizations: JACK P BENDER (CONTACT/OWNER)
Housing units lacking complete plumbing facilities: 0.1% Housing units lacking complete kitchen facilities: 2.1%
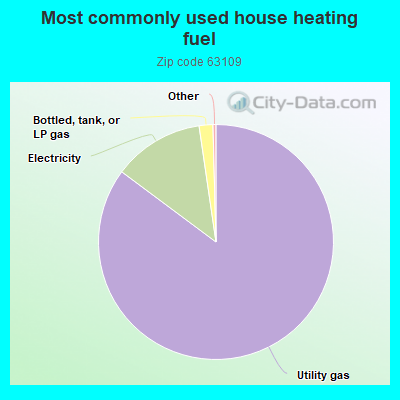
85.2%Utility gas
12.5%Electricity
1.9%Bottled, tank, or LP gas
Population in 1990: 30,029.
Place of birth for U.S.-born residents:
This state: 17,856
Northeast: 701
Midwest: 3,590
South: 1,488
West: 950
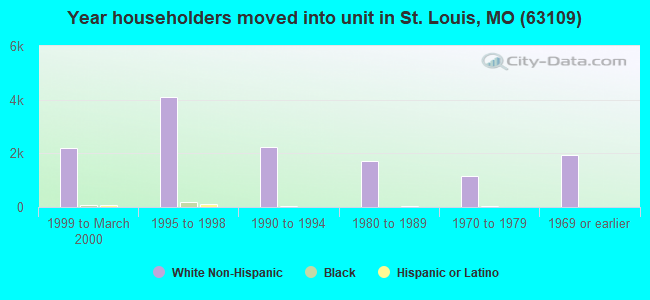
59% of the 63109 zip code residents lived in the same house 5 years ago. Out of people who lived in different houses, 55% lived in this county. Out of people who lived in different counties, 50% lived in Missouri.
91% of the 63109 zip code residents lived in the same house 1 year ago. Out of people who lived in different houses, 45% moved from this county. Out of people who lived in different houses, 35% moved from different county within same state. Out of people who lived in different houses, 20% moved from different state. Out of people who lived in different houses, 1% moved from abroad.
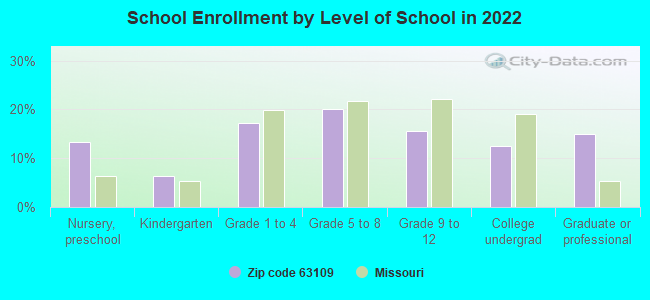
Private vs. public school enrollment:
Students in private schools in grades 1 to 8 (elementary and middle school): 740
Here:
49.7%
Missouri:
15.4%
Students in private schools in grades 9 to 12 (high school): 514
Here:
79.9%
Missouri:
13.9%
Students in private undergraduate colleges: 150
Here:
31.1%
Missouri:
22.6%
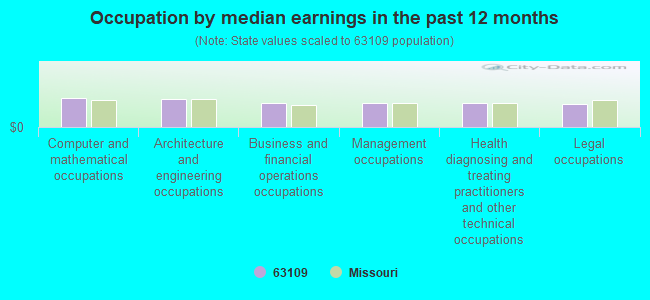
Occupation by median earnings in the past 12 months ($)
84,451Computer and mathematical occupations
80,947Architecture and engineering occupations
70,364Business and financial operations occupations
68,236Management occupations
68,178Health diagnosing and treating practitioners and other technical occupations
64,851Legal occupations
Companies with federal contracts located in this zip code:
SUN PRODUCTIONS INC (5846 MACKLIND AVENUE in SAINT LOUIS, MO; small business) : $92,500 in 3 contractsfrom 2000 to 2001
$34,500 with Air Force for Technical Representation Services -- Photographic Equipment. Taking place in IL. Signed on 2000-11-17. Completion date: 2000-12-09.
$29,500, same as above.Signed on 2000-05-23. Completion date: 2000-06-03.
$28,500 with Air Force for Technical Representation Services -- Communication, Detection, and Coherent Radiation Equipment. Signed on 2001-05-11. Completion date: 2001-05-28.
HUFF, MERRIFIELD WELLS (4942 ROBERT AVE in SAINT LOUIS, MO; small business)
$60,000 with Department of Defense for Historical Studies. Taking place in CA. Signed on 2005-09-29. Completion date: 2006-09-29.
Top industries in this zip code by the number of employees in 2005:
2002 - 2018 National Fire Incident Reporting System (NFIRS) incidents
According to the data from the years 2002 - 2018 the average number of fire incidents per year is 86. The highest number of fire incidents - 140 took place in 2010, and the least - 1 in 2005. The data has a growing trend.
When looking into fire subcategories, the most reports belonged to: Structure Fires (44.7%), and Outside Fires (40.6%).
Fire incident types reported to NFIRS in Zip Code 63109


 Nearest zip codes: 63139, 63116, 63143, 63110, 63123, 63111.
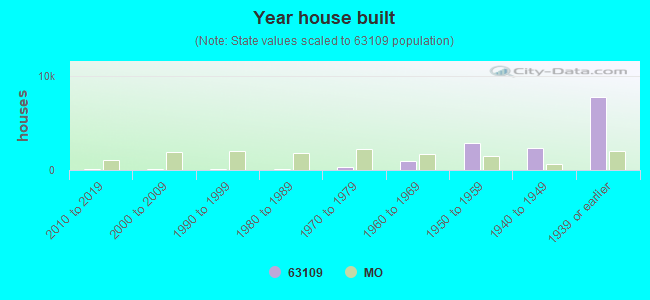


 According to the data from the years 2002 - 2018 the average number of fire incidents per year is 86. The highest number of fire incidents - 140 took place in 2010, and the least - 1 in 2005. The data has a growing trend.
 When looking into fire subcategories, the most reports belonged to: Structure Fires (44.7%), and Outside Fires (40.6%).