Estimated zip code population in 2022: 2,663 Zip code population in 2010: 2,918 Zip code population in 2000: 2,977
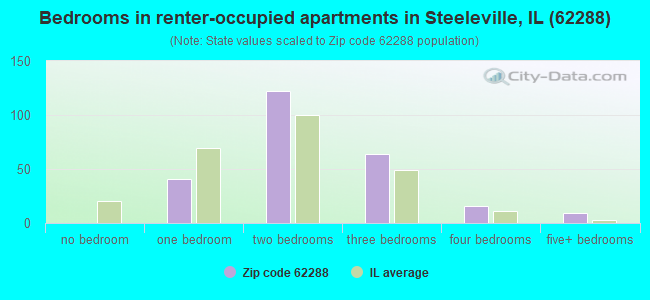
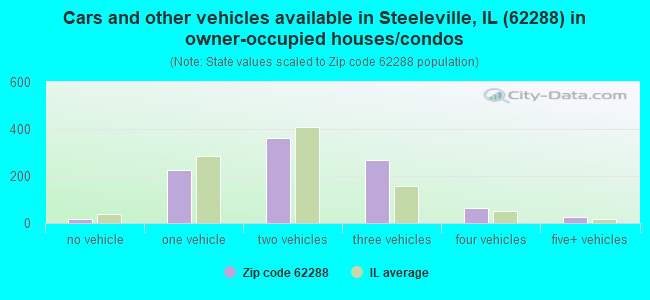
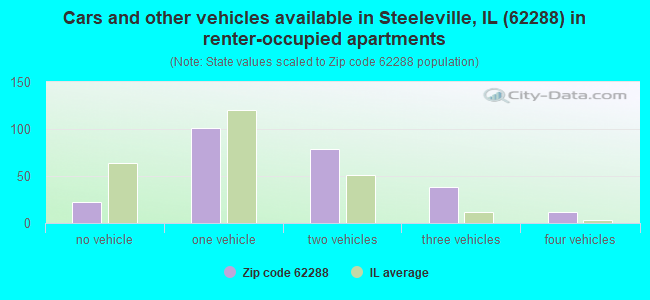
Houses and condos: 1,317 Renter-occupied apartments: 255
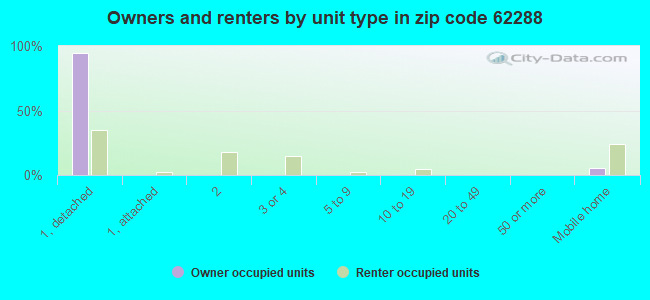
% of renters here:
21%
State:
33%
March 2022 cost of living index in zip code 62288: 76.0 (low, U.S. average is 100)
Land area: 38.0 sq. mi. Water area: 0.1 sq. mi.
Population density: 70 people per square mile
(very low).
OSM Map
General Map
Google Map
MSN Map
OSM Map
General Map
Google Map
MSN Map
OSM Map
General Map
Google Map
MSN Map
OSM Map
General Map
Google Map
MSN Map
Please wait while loading the map...
Real estate property taxes paid for housing units in 2022:
This zip code:
1.1% ($1,706)
Illinois:
2.0% ($4,912)
Median real estate property taxes paid for housing units with mortgages in 2022: $2,052 (1.3%) Median real estate property taxes paid for housing units with no mortgage in 2022: $1,511 (0.9%)
Business Search- 14 Million verified businesses
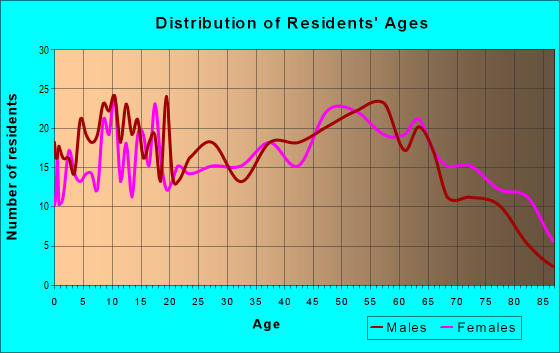
Males: 1,258
(47.2%)
Females: 1,405
(52.8%)
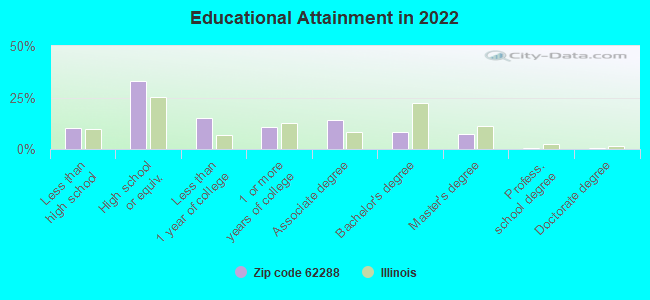
For population 25 years and over in 62288:
High school or higher: 88.7%
Bachelor's degree or higher: 16.9%
Graduate or professional degree: 8.5%
Unemployed: 3.7%
Mean travel time to work (commute): 20.1 minutes
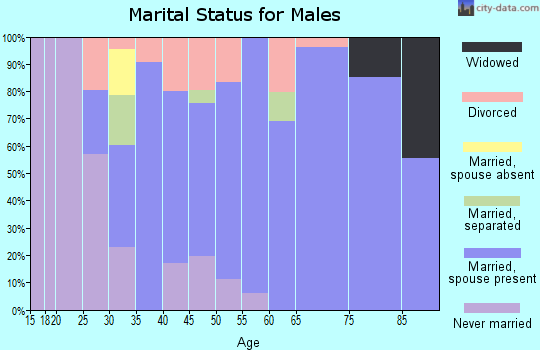
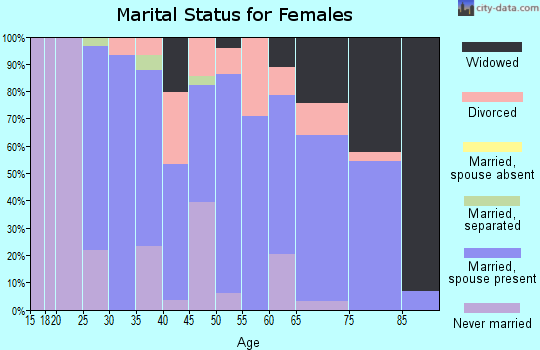
For population 15 years and over in 62288:
Never married: 24.6%
Now married: 51.9%
Separated: 1.0%
Widowed: 10.4%
Divorced: 12.2%
Zip code 62288 compared to state average:
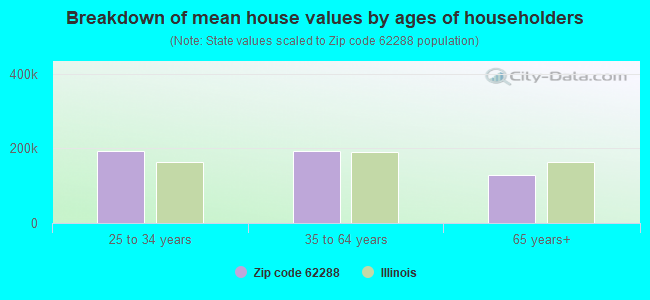
Median house value below state average.
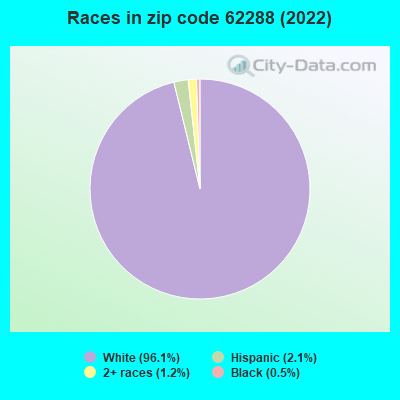
Black race population percentage significantly below state average.
Hispanic race population percentage significantly below state average.
Median age significantly above state average.
Foreign-born population percentage significantly below state average.
Renting percentage below state average.
Length of stay since moving in significantly above state average.
Percentage of population with a bachelor's degree or higher below state average.
Averages for the 2020 tax year for zip code 62288, filed in 2021:
Average Adjusted Gross Income (AGI) in 2020: $59,433 (Individual Income Tax Returns)
Here:
$59,433
State:
$82,626
Salary/wage: $49,794 (reported on 78.4% of returns)
Here:
$49,794
State:
$66,640
(% of AGI for various income ranges: 1098.7% for AGIs below $25k, 3254.6% for AGIs $25k-50k, 4996.0% for AGIs $50k-75k, 7269.2% for AGIs $75k-100k, 12556.2% for AGIs $100k-200k)
Taxable interest for individuals: $1,111 (reported on 47.5% of returns)
This zip code:
$1,111
Illinois:
$2,376
(% of AGI for various income ranges: 29.4% for AGIs below $25k, 41.8% for AGIs $25k-50k, 98.0% for AGIs $50k-75k, 66.9% for AGIs $75k-100k, 136.2% for AGIs $100k-200k)
Ordinary dividends: $2,649 (reported on 25.2% of returns)
Here:
$2,649
State:
$9,061
(% of AGI for various income ranges: 27.7% for AGIs below $25k, 35.4% for AGIs $25k-50k, 131.3% for AGIs $50k-75k, 91.5% for AGIs $75k-100k, 218.1% for AGIs $100k-200k)
Net capital gain/loss in AGI: +$5,318 (reported on 20.1% of returns)
Here:
+$5,318
State:
+$31,684
(% of AGI for various income ranges: 19.0% for AGIs below $25k, 33.6% for AGIs $25k-50k, 94.0% for AGIs $50k-75k, 127.7% for AGIs $75k-100k, 643.1% for AGIs $100k-200k)
Profit/loss from business: +$11,300 (reported on 11.5% of returns)
Here:
+$11,300
State:
+$12,175
(% of AGI for various income ranges: 42.6% for AGIs below $25k, 47.5% for AGIs $25k-50k, 172.0% for AGIs $50k-75k, 803.1% for AGIs $100k-200k)
Taxable individual retirement arrangement distribution: $12,789 (reported on 13.7% of returns)
62288:
$12,789
Illinois:
$21,613
(% of AGI for various income ranges: 84.5% for AGIs below $25k, 126.4% for AGIs $25k-50k, 291.3% for AGIs $50k-75k, 383.8% for AGIs $75k-100k, 548.8% for AGIs $100k-200k)
Total itemized deductions: $27,150 (reported on 2.9% of returns)
Here:
$27,150
State:
$34,948
(% of AGI for various income ranges: 678.8% for AGIs $100k-200k)
Charity contributions: $11,667 (reported on 2.2% of returns)
Here:
$11,667
State:
$13,122
(% of AGI for various income ranges: 218.8% for AGIs $100k-200k)
Taxes paid: $6,100 (reported on 2.9% of returns)
62288:
$6,100
State:
$8,563
(% of AGI for various income ranges: 152.5% for AGIs $100k-200k)
Earned income credit: $2,382 (reported on 12.2% of returns)
Here:
$2,382
State:
$2,311
(% of AGI for various income ranges: 78.7% for AGIs below $25k, 57.5% for AGIs $25k-50k)
Percentage of individuals using paid preparers for their 2020 taxes: 95.7%
Here:
96%
State:
93%
(% for various income ranges: 95.5% for AGIs below $25k, 97.1% for AGIs $25k-50k, 89.5% for AGIs $50k-75k, 100.0% for AGIs $75k-100k, 95.7% for AGIs $100k-200k, 100.0% for AGIs over 200k)
Averages for the 2012 tax year for zip code 62288, filed in 2013:
Average Adjusted Gross Income (AGI) in 2012: $49,901 (Individual Income Tax Returns)
Here:
$49,901
State:
$68,058
Salary/wage: $42,244 (reported on 81.0% of returns)
Here:
$42,244
State:
$55,396
(% of AGI for various income ranges: 63.4% for AGIs below $25k, 71.5% for AGIs $25k-50k, 76.2% for AGIs $50k-75k, 79.0% for AGIs $75k-100k, 57.9% for AGIs $100k-200k)
Taxable interest for individuals: $1,296 (reported on 50.4% of returns)
This zip code:
$1,296
Illinois:
$1,969
(% of AGI for various income ranges: 2.8% for AGIs below $25k, 1.3% for AGIs $25k-50k, 1.4% for AGIs $50k-75k, 1.0% for AGIs $75k-100k, 1.0% for AGIs $100k-200k)
Ordinary dividends: $2,222 (reported on 26.3% of returns)
Here:
$2,222
State:
$7,786
(% of AGI for various income ranges: 2.2% for AGIs below $25k, 1.5% for AGIs $25k-50k, 0.8% for AGIs $50k-75k, 0.6% for AGIs $75k-100k, 1.2% for AGIs $100k-200k)
Net capital gain/loss in AGI: +$3,809 (reported on 16.1% of returns)
Here:
+$3,809
State:
+$22,183
(% of AGI for various income ranges: 0.1% for AGIs below $25k, 0.3% for AGIs $25k-50k, 0.5% for AGIs $50k-75k, 3.2% for AGIs $100k-200k)
Profit/loss from business: +$8,106 (reported on 12.4% of returns)
Here:
+$8,106
State:
+$12,903
(% of AGI for various income ranges: 3.4% for AGIs below $25k, 3.9% for AGIs $25k-50k, 1.9% for AGIs $50k-75k, 0.4% for AGIs $75k-100k, 1.8% for AGIs $100k-200k)
Taxable individual retirement arrangement distribution: $9,380 (reported on 14.6% of returns)
62288:
$9,380
Illinois:
$17,929
(% of AGI for various income ranges: 6.0% for AGIs below $25k, 3.3% for AGIs $25k-50k, 2.0% for AGIs $50k-75k, 2.0% for AGIs $75k-100k, 2.5% for AGIs $100k-200k)
Total itemized deductions: $17,238 (18% of AGI, reported on 19.0% of returns)
Here:
$17,238
State:
$26,433
Here:
17.9% of AGI
State:
19.2% of AGI
(% of AGI for various income ranges: 4.9% for AGIs below $25k, 5.1% for AGIs $25k-50k, 5.8% for AGIs $50k-75k, 7.0% for AGIs $75k-100k, 7.9% for AGIs $100k-200k)
Charity contributions: $4,316 (reported on 13.9% of returns)
Here:
$4,316
State:
$4,525
(% of AGI for various income ranges: 1.2% for AGIs $25k-50k, 0.8% for AGIs $50k-75k, 1.5% for AGIs $75k-100k, 1.6% for AGIs $100k-200k)
Taxes paid: $5,919 (reported on 19.0% of returns)
62288:
$5,919
State:
$11,968
(% of AGI for various income ranges: 0.8% for AGIs below $25k, 1.1% for AGIs $25k-50k, 1.7% for AGIs $50k-75k, 2.6% for AGIs $75k-100k, 3.3% for AGIs $100k-200k)
Earned income credit: $2,015 (reported on 14.6% of returns)
Here:
$2,015
State:
$2,349
(% of AGI for various income ranges: 4.5% for AGIs below $25k, 1.0% for AGIs $25k-50k)
Percentage of individuals using paid preparers for their 2012 taxes: 75.2%
Here:
75%
State:
57%
(% for various income ranges: 71.2% for AGIs below $25k, 75.8% for AGIs $25k-50k, 76.2% for AGIs $50k-75k, 81.2% for AGIs $75k-100k, 80.0% for AGIs $100k-200k)
Averages for the 2004 tax year for zip code 62288, filed in 2005:
Average Adjusted Gross Income (AGI) in 2004: $37,057 (Individual Income Tax Returns)
Here:
$37,057
State:
$54,625
Salary/wage: $34,161 (reported on 81.6% of returns)
Here:
$34,161
State:
$46,811
(% of AGI for various income ranges: 82.5% for AGIs below $10k, 64.0% for AGIs $10k-25k, 78.0% for AGIs $25k-50k, 79.6% for AGIs $50k-75k, 84.3% for AGIs $75k-100k, 60.7% for AGIs over 100k)
Taxable interest for individuals: $1,795 (reported on 61.5% of returns)
This zip code:
$1,795
Illinois:
$2,101
(% of AGI for various income ranges: 10.8% for AGIs below $10k, 6.5% for AGIs $10k-25k, 2.9% for AGIs $25k-50k, 2.5% for AGIs $50k-75k, 1.2% for AGIs $75k-100k, 2.2% for AGIs over 100k)
Taxable dividends: $2,017 (reported on 31.8% of returns)
Here:
$2,017
State:
$4,306
(% of AGI for various income ranges: 6.4% for AGIs below $10k, 2.0% for AGIs $10k-25k, 1.1% for AGIs $25k-50k, 1.4% for AGIs $50k-75k, 0.8% for AGIs $75k-100k, 3.5% for AGIs over 100k)
Net capital gain/loss: +$2,736 (reported on 23.2% of returns)
Here:
+$2,736
State:
+$17,321
(% of AGI for various income ranges: -0.8% for AGIs below $10k, 1.7% for AGIs $10k-25k, 0.9% for AGIs $25k-50k, 0.6% for AGIs $50k-75k, 0.4% for AGIs $75k-100k, 6.8% for AGIs over 100k)
Profit/loss from business: +$6,686 (reported on 13.1% of returns)
Here:
+$6,686
State:
+$11,771
(% of AGI for various income ranges: 3.0% for AGIs below $10k, -0.2% for AGIs $10k-25k, 2.4% for AGIs $25k-50k, 2.5% for AGIs $50k-75k, 1.5% for AGIs $75k-100k, 4.9% for AGIs over 100k)
IRA payment deduction: $2,896 (reported on 3.3% of returns)
62288:
$2,896
Illinois:
$3,087
Total itemized deductions: $15,159 (22% of AGI, reported on 15.8% of returns)
Here:
$15,159
State:
$20,239
Here:
22.1% of AGI
State:
19.5% of AGI
(% of AGI for various income ranges: 9.1% for AGIs below $10k, 4.2% for AGIs $10k-25k, 4.9% for AGIs $25k-50k, 6.5% for AGIs $50k-75k, 8.3% for AGIs $75k-100k, 8.3% for AGIs over 100k)
Charity contributions deductions: $3,714 (5% of AGI, reported on 12.9% of returns)
Here:
$3,714
State:
$3,719
Here:
5.3% of AGI
State:
3.4% of AGI
(% of AGI for various income ranges: 1.0% for AGIs $10k-25k, 1.0% for AGIs $25k-50k, 1.4% for AGIs $50k-75k, 1.1% for AGIs $75k-100k, 2.1% for AGIs over 100k)
Total tax: $4,375 (reported on 75.9% of returns)
62288:
$4,375
State:
$9,882
(% of AGI for various income ranges: 1.8% for AGIs below $10k, 3.9% for AGIs $10k-25k, 6.8% for AGIs $25k-50k, 8.4% for AGIs $50k-75k, 11.0% for AGIs $75k-100k, 16.2% for AGIs over 100k)
Earned income credit: $1,596 (reported on 10.2% of returns)
Here:
$1,596
State:
$1,788
Percentage of individuals using paid preparers for their 2004 taxes: 76.0%
Here:
76%
State:
61%
(% for various income ranges: 66.9% for AGIs below $10k, 78.0% for AGIs $10k-25k, 80.4% for AGIs $25k-50k, 78.0% for AGIs $50k-75k, 74.5% for AGIs $75k-100k, 75.8% for AGIs over 100k)
Household received Food Stamps/SNAP in the past 12 months: 91 Household did not receive Food Stamps/SNAP in the past 12 months: 1,116
Women who had a birth in the past 12 months: 27 (27 now married, 0 unmarried) Women who did not have a birth in the past 12 months: 515 (208 now married, 307 unmarried)
Housing units in zip code 62288 with a mortgage: 423 (42 second mortgage, 42 both second mortgage and home equity loan) Median monthly owner costs for units with a mortgage: $1,147 Median monthly owner costs for units without a mortgage: $467
Residents with income below the poverty level in 2022:
This zip code:
9.2%
Whole state:
11.9%
Residents with income below 50% of the poverty level in 2022:
This zip code:
5.7%
Whole state:
5.7%
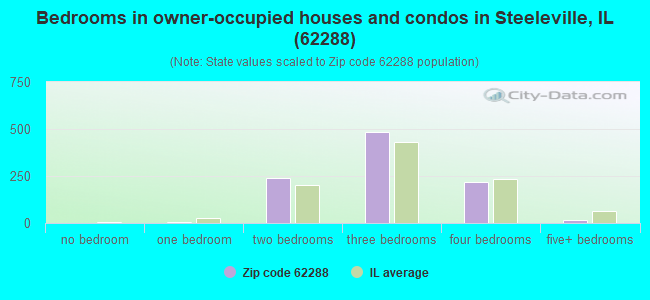
Median number of rooms in houses and condos:
Here:
6.0
State:
6.4
Median number of rooms in apartments:
Here:
4.4
State:
4.1
Notable locations in this zip code not listed on our city pages
Churches in zip code 62288 include: Peace Lutheran Church (A), Saint Marks Lutheran Church (B), Steeleville United Methodist Church (C), Saint Peters Church (D). Display/hide their locations on the map
Size of family households: 427 2-persons, 205 3-persons, 146 4-persons, 41 5-persons, 4 7-or-more-persons
Size of nonfamily households: 367 1-person, 16 2-persons, 8 3-persons
280 married couples with children.
132 single-parent households (23 men, 109 women).
95.7% of residents of 62288 zip code speak English at home.
2.0% of residents speak Spanish at home (57% very well, 43% well).
2.2% of residents speak other Indo-European language at home (9% very well, 91% well).
0.1% of residents speak Asian or Pacific Island language at home (100% very well).
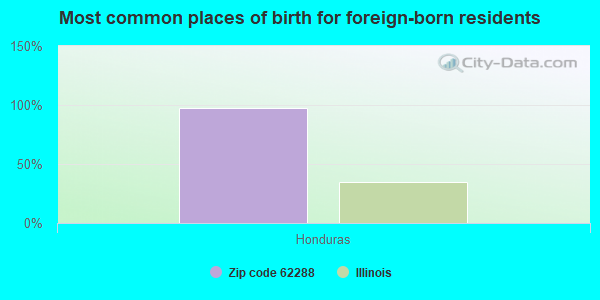
Foreign born population: 44 (1.7%) (0.0% of them are naturalized citizens)
:
1.7%
Whole state:
14.4%
98%Honduras
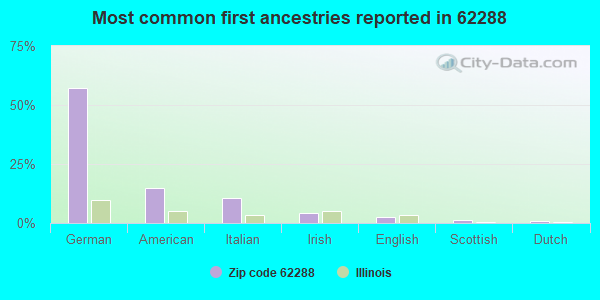
57%German
15%American
11%Italian
4%Irish
3%English
1%Scottish
1%Dutch
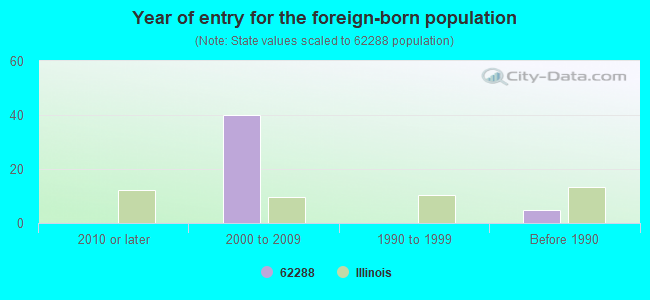
Year of entry for the foreign-born population
02010 or later
402000 to 2009
01990 to 1999
5Before 1990
Facilities with environmental interests located in this zip code:
ROGERS REDI MIX INC.-STELLEVLL (RR1 EAST HIGHWAY 150 in STEELEVILLE, IL)
AIR MINOR (AIRS/AFS) CRITERIA AND HAZARDOUS AIR POLLUTANT INVENTORY (Inventory of air pollution sources) National Pollutant Discharge Elimination System NON-MAJOR (Tracking pollutant discharge elimination systems) - permit Business SIC classification: READY-MIXED CONCRETE Business NAICS classification: READY-MIX CONCRETE MANUFACTURING. Organizations: KOESTER?ROGER L? (CONTACT/OWNER)
, KOESTER?ROGER L. (CONTACT/OWNER)
Alternative names: ROGERS REDI-MIX INC. PLANT 1
AMERICAN DEVICE MANUFACTURING COMPANY (1003 BROADWAY in STEELEVILLE, IL)
National Pollutant Discharge Elimination System NON-MAJOR (Tracking pollutant discharge elimination systems) - permit (Resource Conservation and Recovery Act (tracking hazardous waste)) Business SIC classification: FABRICATED METAL PRODUCTS
NIEDERBRACH TRUCK SERVICE, INC (SHANNEYTOWN TR. & MEADOW LANE in STEELEVILLE, IL)
National Pollutant Discharge Elimination System NON-MAJOR (Tracking pollutant discharge elimination systems) - permit
CROP PRODUCTION SEVICES (12100 WINE HILL ROAD in STEELEVILLE, IL)
ENFORCEMENT/COMPLIANCE ACTIVITY (Integrated Compliance Information System)
Housing units lacking complete plumbing facilities: 2.7% Housing units lacking complete kitchen facilities: 2.0%
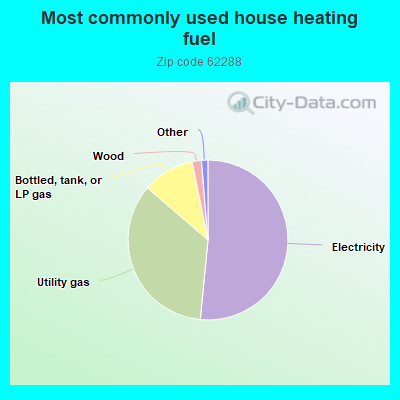
51.6%Electricity
34.8%Utility gas
10.5%Bottled, tank, or LP gas
1.9%Wood
0.8%Fuel oil, kerosene, etc.
0.6%No fuel used
Population in 1990: 2,951. Population change in the 1990s: +26 (+0.9%).
Place of birth for U.S.-born residents:
This state: 2,296
Northeast: 8
Midwest: 216
South: 38
West: 43
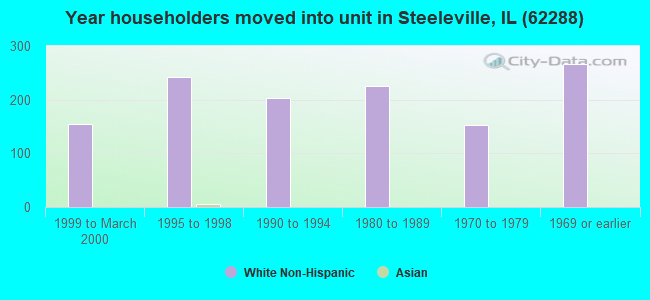
70% of the 62288 zip code residents lived in the same house 5 years ago. Out of people who lived in different houses, 65% lived in this county. Out of people who lived in different counties, 50% lived in Illinois.
89% of the 62288 zip code residents lived in the same house 1 year ago. Out of people who lived in different houses, 65% moved from this county. Out of people who lived in different houses, 6% moved from different county within same state. Out of people who lived in different houses, 25% moved from different state. Out of people who lived in different houses, 1% moved from abroad.
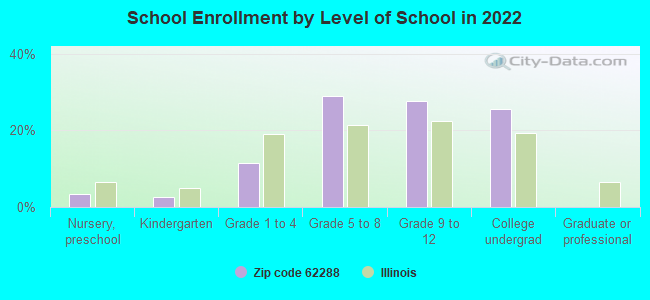
Private vs. public school enrollment:
Students in private schools in grades 1 to 8 (elementary and middle school): 50
Here:
24.3%
Illinois:
13.3%
Students in private schools in grades 9 to 12 (high school): 4
Here:
3.3%
Illinois:
9.9%
Students in private undergraduate colleges: 14
Here:
11.2%
Illinois:
27.4%
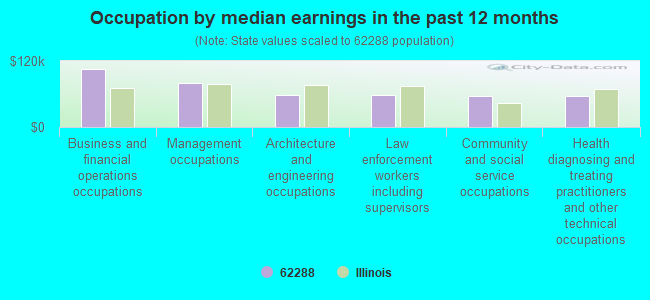
Occupation by median earnings in the past 12 months ($)
106,052Business and financial operations occupations
80,532Management occupations
58,154Architecture and engineering occupations
57,371Law enforcement workers including supervisors
56,130Community and social service occupations
55,889Health diagnosing and treating practitioners and other technical occupations
Companies with federal contracts located in this zip code:
EGYPTIAN ELECTRIC CO-OPERATIVE (1005 W BROADWAY in STEELEVILLE, IL; small business) : $35,419 in 2 contractsin 2003
$35,419 with U.S. Army Corps of Engineers - civil program financing only for Gas Services. Signed on 2003-09-09. Completion date: 2003-12-30.
$0, same as above.Signed on 2003-09-09. Completion date: 2003-12-30.
Top industries in this zip code by the number of employees in 2005:
Other Services (except Public Administration): Religious Organizations (20-49 employees: 1 establishment, 5-9 employees: 2 establishments, 1-4 employees: 3 establishments)
Accommodation and Food Services: Limited-Service Restaurants (20-49: 1, 10-19: 1)
Health Care and Social Assistance: Other Individual and Family Services (20-49: 1, 5-9: 2)
Finance and Insurance: Commercial Banking (20-49: 1, 5-9: 1)
Other Services (except Public Administration): Civic and Social Organizations (20-49: 1, 1-4: 1)
Construction: New Single-Family Housing Construction (except Operative Builders) (20-49: 1)
Fatal accident statistics in 2014:
Fatal accident count: 1
Vehicles involved in fatal accidents: 1
Fatal accidents caused by drunken drivers: 1
Fatalities: 1
Persons involved in fatal accidents: 1
Pedestrians involved in fatal accidents: 0
Fatal accident statistics in 2013:
Fatal accident count: 1
Vehicles involved in fatal accidents: 1
Fatal accidents caused by drunken drivers: 1
Fatalities: 1
Persons involved in fatal accidents: 1
Pedestrians involved in fatal accidents: 0
2002 - 2018 National Fire Incident Reporting System (NFIRS) incidents
According to the data from the years 2002 - 2018 the average number of fires per year is 11. The highest number of fire incidents - 18 took place in 2017, and the least - 0 in 2003. The data has a growing trend.
When looking into fire subcategories, the most reports belonged to: Structure Fires (31.8%), and Outside Fires (30.7%).
Fire incident types reported to NFIRS in Zip Code 62288


 Nearest zip codes: 62272, 62997, 62233, 62916, 62286, 62297.
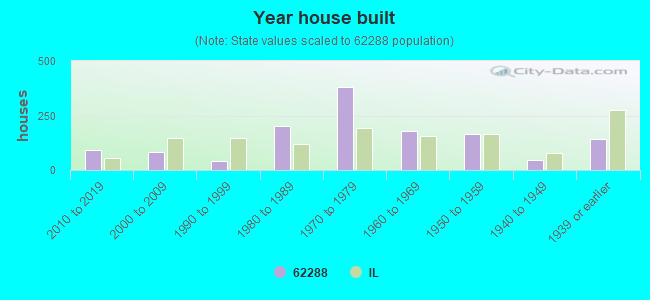


 According to the data from the years 2002 - 2018 the average number of fires per year is 11. The highest number of fire incidents - 18 took place in 2017, and the least - 0 in 2003. The data has a growing trend.
 When looking into fire subcategories, the most reports belonged to: Structure Fires (31.8%), and Outside Fires (30.7%).