Estimated zip code population in 2022: 6,591 Zip code population in 2010: 6,269 Zip code population in 2000: 5,740
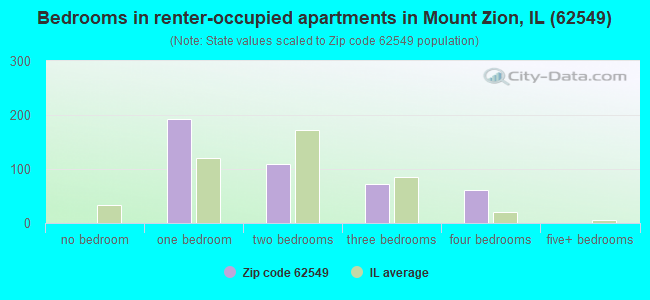
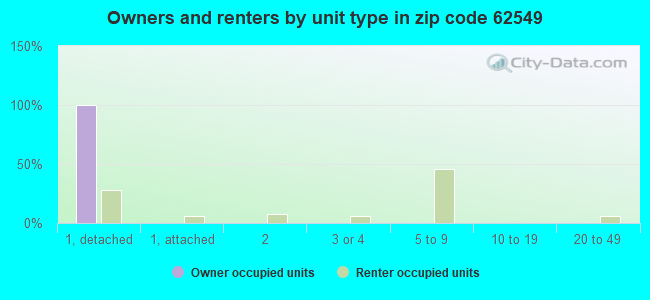
Houses and condos: 2,549 Renter-occupied apartments: 444
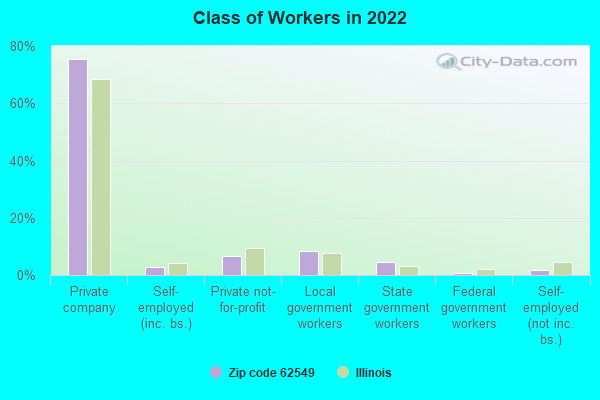
% of renters here:
18%
State:
33%
March 2022 cost of living index in zip code 62549: 82.3 (low, U.S. average is 100)
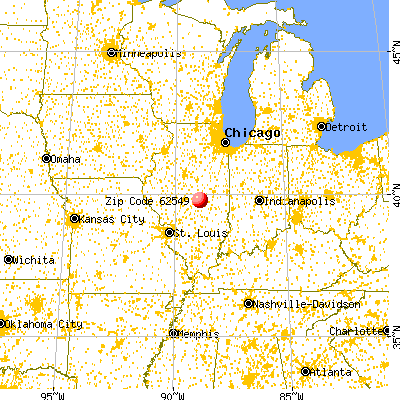
Land area: 7.9 sq. mi. Water area: 0.0 sq. mi.
Population density: 832 people per square mile
(low).
OSM Map
General Map
Google Map
MSN Map
OSM Map
General Map
Google Map
MSN Map
OSM Map
General Map
Google Map
MSN Map
OSM Map
General Map
Google Map
MSN Map
Please wait while loading the map...
Real estate property taxes paid for housing units in 2022:
This zip code:
2.1% ($3,786)
Illinois:
2.0% ($4,912)
Median real estate property taxes paid for housing units with mortgages in 2022: $4,604 (2.1%) Median real estate property taxes paid for housing units with no mortgage in 2022: $2,927 (2.0%)
Business Search- 14 Million verified businesses
Males: 3,183
(48.3%)
Females: 3,408
(51.7%)
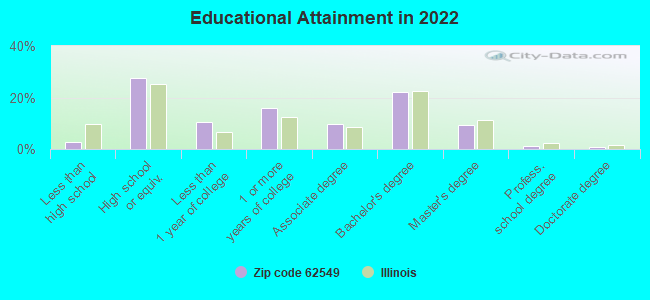
For population 25 years and over in 62549:
High school or higher: 97.2%
Bachelor's degree or higher: 33.2%
Graduate or professional degree: 11.2%
Unemployed: 2.7%
Mean travel time to work (commute): 18.8 minutes
For population 15 years and over in 62549:
Never married: 15.3%
Now married: 68.7%
Separated: 0.0%
Widowed: 6.3%
Divorced: 9.6%
Zip code 62549 compared to state average:
Unemployed percentage below state average.
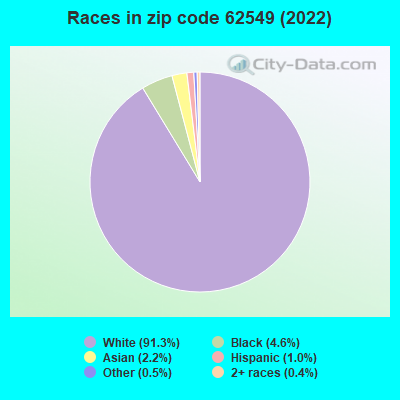
Black race population percentage significantly below state average.
Hispanic race population percentage significantly below state average.
Foreign-born population percentage significantly below state average.
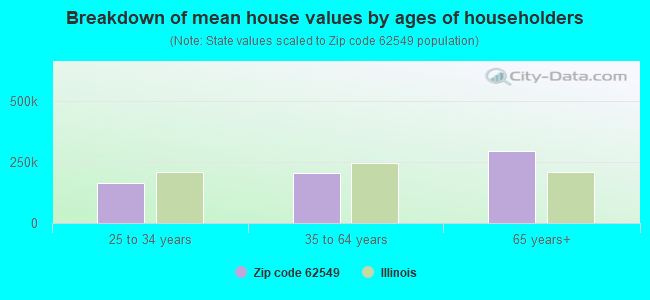
Estimated median house/condo value in 2022: $181,623
62549:
$181,623
Illinois:
$251,600
According to our research of Illinois and other state lists, there were 4 registered sex offenders living in 62549 zip code as of April 27, 2024. The ratio of all residents to sex offenders in zip code 62549 is 1,596 to 1. The ratio of registered sex offenders to all residents in this zip code is lower than the state average.
Median resident age:
This zip code:
38.3 years
Illinois median age:
39.1 years
Average household size:
This zip code:
2.7 people
Illinois:
2.4 people
Averages for the 2020 tax year for zip code 62549, filed in 2021:
Average Adjusted Gross Income (AGI) in 2020: $80,631 (Individual Income Tax Returns)
Here:
$80,631
State:
$82,626
Salary/wage: $70,853 (reported on 80.8% of returns)
Here:
$70,853
State:
$66,640
(% of AGI for various income ranges: 950.2% for AGIs below $25k, 3210.2% for AGIs $25k-50k, 5560.9% for AGIs $50k-75k, 8631.1% for AGIs $75k-100k, 15056.3% for AGIs $100k-200k, 65986.7% for AGIs over 200k)
Taxable interest for individuals: $989 (reported on 42.4% of returns)
This zip code:
$989
Illinois:
$2,376
(% of AGI for various income ranges: 15.4% for AGIs below $25k, 31.1% for AGIs $25k-50k, 46.1% for AGIs $50k-75k, 65.6% for AGIs $75k-100k, 89.1% for AGIs $100k-200k, 470.0% for AGIs over 200k)
Ordinary dividends: $4,591 (reported on 24.9% of returns)
Here:
$4,591
State:
$9,061
(% of AGI for various income ranges: 26.1% for AGIs below $25k, 43.4% for AGIs $25k-50k, 83.0% for AGIs $50k-75k, 129.6% for AGIs $75k-100k, 252.0% for AGIs $100k-200k, 2123.3% for AGIs over 200k)
Net capital gain/loss in AGI: +$8,839 (reported on 20.5% of returns)
Here:
+$8,839
State:
+$31,684
(% of AGI for various income ranges: 8.9% for AGIs below $25k, 22.0% for AGIs $25k-50k, 82.4% for AGIs $50k-75k, 111.5% for AGIs $75k-100k, 191.1% for AGIs $100k-200k, 6320.0% for AGIs over 200k)
Profit/loss from business: +$15,197 (reported on 11.4% of returns)
Here:
+$15,197
State:
+$12,175
(% of AGI for various income ranges: 43.7% for AGIs below $25k, 110.2% for AGIs $25k-50k, 236.7% for AGIs $50k-75k, 186.7% for AGIs $75k-100k, 323.9% for AGIs $100k-200k, 2763.3% for AGIs over 200k)
Taxable individual retirement arrangement distribution: $21,297 (reported on 11.8% of returns)
62549:
$21,297
Illinois:
$21,613
(% of AGI for various income ranges: 71.9% for AGIs below $25k, 120.2% for AGIs $25k-50k, 337.9% for AGIs $50k-75k, 257.0% for AGIs $75k-100k, 578.3% for AGIs $100k-200k, 3410.0% for AGIs over 200k)
Total itemized deductions: $30,150 (reported on 5.4% of returns)
Here:
$30,150
State:
$34,948
(% of AGI for various income ranges: 421.2% for AGIs $50k-75k, 392.4% for AGIs $100k-200k, 2715.0% for AGIs over 200k)
Charity contributions: $11,023 (reported on 4.4% of returns)
Here:
$11,023
State:
$13,122
(% of AGI for various income ranges: 78.8% for AGIs $50k-75k, 118.5% for AGIs $100k-200k, 1046.7% for AGIs over 200k)
Taxes paid: $8,756 (reported on 5.4% of returns)
62549:
$8,756
State:
$8,563
(% of AGI for various income ranges: 97.9% for AGIs $50k-75k, 138.7% for AGIs $100k-200k, 733.3% for AGIs over 200k)
Earned income credit: $2,060 (reported on 8.4% of returns)
Here:
$2,060
State:
$2,311
(% of AGI for various income ranges: 50.9% for AGIs below $25k, 51.1% for AGIs $25k-50k)
Percentage of individuals using paid preparers for their 2020 taxes: 94.6%
Here:
95%
State:
93%
(% for various income ranges: 93.4% for AGIs below $25k, 94.4% for AGIs $25k-50k, 95.3% for AGIs $50k-75k, 97.2% for AGIs $75k-100k, 94.3% for AGIs $100k-200k, 94.4% for AGIs over 200k)
Averages for the 2012 tax year for zip code 62549, filed in 2013:
Average Adjusted Gross Income (AGI) in 2012: $68,987 (Individual Income Tax Returns)
Here:
$68,987
State:
$68,058
Salary/wage: $59,734 (reported on 85.3% of returns)
Here:
$59,734
State:
$55,396
(% of AGI for various income ranges: 70.6% for AGIs below $25k, 72.9% for AGIs $25k-50k, 76.3% for AGIs $50k-75k, 79.3% for AGIs $75k-100k, 78.9% for AGIs $100k-200k, 59.8% for AGIs over 200k)
Taxable interest for individuals: $954 (reported on 46.9% of returns)
This zip code:
$954
Illinois:
$1,969
(% of AGI for various income ranges: 1.4% for AGIs below $25k, 1.2% for AGIs $25k-50k, 0.8% for AGIs $50k-75k, 0.5% for AGIs $75k-100k, 0.5% for AGIs $100k-200k, 0.4% for AGIs over 200k)
Ordinary dividends: $3,163 (reported on 25.5% of returns)
Here:
$3,163
State:
$7,786
(% of AGI for various income ranges: 1.1% for AGIs below $25k, 1.1% for AGIs $25k-50k, 0.9% for AGIs $50k-75k, 0.7% for AGIs $75k-100k, 0.8% for AGIs $100k-200k, 2.4% for AGIs over 200k)
Net capital gain/loss in AGI: +$3,588 (reported on 16.8% of returns)
Here:
+$3,588
State:
+$22,183
(% of AGI for various income ranges: 0.2% for AGIs $25k-50k, 0.6% for AGIs $75k-100k, 0.1% for AGIs $100k-200k, 3.8% for AGIs over 200k)
Profit/loss from business: +$17,230 (reported on 12.9% of returns)
Here:
+$17,230
State:
+$12,903
(% of AGI for various income ranges: 4.0% for AGIs below $25k, 1.2% for AGIs $25k-50k, 2.3% for AGIs $50k-75k, 1.8% for AGIs $75k-100k, 3.6% for AGIs $100k-200k, 5.4% for AGIs over 200k)
Taxable individual retirement arrangement distribution: $12,594 (reported on 11.5% of returns)
62549:
$12,594
Illinois:
$17,929
(% of AGI for various income ranges: 2.7% for AGIs below $25k, 2.4% for AGIs $25k-50k, 2.2% for AGIs $50k-75k, 2.8% for AGIs $75k-100k, 2.0% for AGIs $100k-200k, 1.4% for AGIs over 200k)
Self-employment retirement plans: $21,350 (reported on 0.7% of returns)
62549:
$21,350
Illinois:
$24,666
(% of AGI for various income ranges: 0.6% for AGIs $100k-200k)
Total itemized deductions: $20,151 (17% of AGI, reported on 37.1% of returns)
Here:
$20,151
State:
$26,433
Here:
17.0% of AGI
State:
19.2% of AGI
(% of AGI for various income ranges: 8.3% for AGIs below $25k, 8.2% for AGIs $25k-50k, 10.1% for AGIs $50k-75k, 10.4% for AGIs $75k-100k, 11.9% for AGIs $100k-200k, 11.9% for AGIs over 200k)
Charity contributions: $4,741 (reported on 27.6% of returns)
Here:
$4,741
State:
$4,525
(% of AGI for various income ranges: 0.7% for AGIs below $25k, 0.9% for AGIs $25k-50k, 1.4% for AGIs $50k-75k, 1.5% for AGIs $75k-100k, 1.8% for AGIs $100k-200k, 3.6% for AGIs over 200k)
Taxes paid: $9,315 (reported on 37.1% of returns)
62549:
$9,315
State:
$11,968
(% of AGI for various income ranges: 1.4% for AGIs below $25k, 2.5% for AGIs $25k-50k, 3.8% for AGIs $50k-75k, 4.5% for AGIs $75k-100k, 6.2% for AGIs $100k-200k, 6.5% for AGIs over 200k)
Earned income credit: $2,110 (reported on 10.5% of returns)
Here:
$2,110
State:
$2,349
(% of AGI for various income ranges: 4.6% for AGIs below $25k, 0.9% for AGIs $25k-50k)
Percentage of individuals using paid preparers for their 2012 taxes: 55.9%
Here:
56%
State:
57%
(% for various income ranges: 47.7% for AGIs below $25k, 57.7% for AGIs $25k-50k, 60.0% for AGIs $50k-75k, 60.0% for AGIs $75k-100k, 56.9% for AGIs $100k-200k, 80.0% for AGIs over 200k)
Averages for the 2004 tax year for zip code 62549, filed in 2005:
Average Adjusted Gross Income (AGI) in 2004: $53,293 (Individual Income Tax Returns)
Here:
$53,293
State:
$54,625
Salary/wage: $47,688 (reported on 87.9% of returns)
Here:
$47,688
State:
$46,811
(% of AGI for various income ranges: 88.7% for AGIs below $10k, 72.0% for AGIs $10k-25k, 74.9% for AGIs $25k-50k, 83.8% for AGIs $50k-75k, 86.4% for AGIs $75k-100k, 72.6% for AGIs over 100k)
Taxable interest for individuals: $1,253 (reported on 59.6% of returns)
This zip code:
$1,253
Illinois:
$2,101
(% of AGI for various income ranges: 4.0% for AGIs below $10k, 2.5% for AGIs $10k-25k, 1.7% for AGIs $25k-50k, 1.7% for AGIs $50k-75k, 0.7% for AGIs $75k-100k, 1.2% for AGIs over 100k)
Taxable dividends: $1,411 (reported on 27.6% of returns)
Here:
$1,411
State:
$4,306
(% of AGI for various income ranges: 2.0% for AGIs below $10k, 0.7% for AGIs $10k-25k, 0.8% for AGIs $25k-50k, 0.4% for AGIs $50k-75k, 0.6% for AGIs $75k-100k, 1.0% for AGIs over 100k)
Net capital gain/loss: +$6,763 (reported on 19.2% of returns)
Here:
+$6,763
State:
+$17,321
(% of AGI for various income ranges: -1.3% for AGIs below $10k, -0.1% for AGIs $10k-25k, 0.7% for AGIs $25k-50k, 0.2% for AGIs $50k-75k, 0.6% for AGIs $75k-100k, 6.3% for AGIs over 100k)
Profit/loss from business: +$14,781 (reported on 13.2% of returns)
Here:
+$14,781
State:
+$11,771
(% of AGI for various income ranges: 2.4% for AGIs below $10k, 3.8% for AGIs $10k-25k, 1.5% for AGIs $25k-50k, 1.8% for AGIs $50k-75k, 2.3% for AGIs $75k-100k, 6.6% for AGIs over 100k)
IRA payment deduction: $3,080 (reported on 2.8% of returns)
62549:
$3,080
Illinois:
$3,087
(% of AGI for various income ranges: 0.4% for AGIs $25k-50k, 0.2% for AGIs $50k-75k, 0.1% for AGIs $75k-100k, 0.1% for AGIs over 100k)
Self-employed pension: $15,625 (reported on 0.9% of returns)
Here:
$15,625
Illinois:
$16,965
Total itemized deductions: $15,758 (17% of AGI, reported on 33.3% of returns)
Here:
$15,758
State:
$20,239
Here:
17.2% of AGI
State:
19.5% of AGI
(% of AGI for various income ranges: 7.3% for AGIs below $10k, 8.5% for AGIs $10k-25k, 8.3% for AGIs $25k-50k, 10.2% for AGIs $50k-75k, 10.8% for AGIs $75k-100k, 10.0% for AGIs over 100k)
Charity contributions deductions: $3,322 (3% of AGI, reported on 28.3% of returns)
Here:
$3,322
State:
$3,719
Here:
3.5% of AGI
State:
3.4% of AGI
(% of AGI for various income ranges: 0.6% for AGIs below $10k, 1.1% for AGIs $10k-25k, 1.1% for AGIs $25k-50k, 1.9% for AGIs $50k-75k, 1.6% for AGIs $75k-100k, 2.2% for AGIs over 100k)
Total tax: $7,836 (reported on 80.5% of returns)
62549:
$7,836
State:
$9,882
(% of AGI for various income ranges: 2.1% for AGIs below $10k, 4.2% for AGIs $10k-25k, 7.0% for AGIs $25k-50k, 8.6% for AGIs $50k-75k, 10.3% for AGIs $75k-100k, 18.4% for AGIs over 100k)
Earned income credit: $1,547 (reported on 8.2% of returns)
Here:
$1,547
State:
$1,788
Percentage of individuals using paid preparers for their 2004 taxes: 54.7%
Here:
55%
State:
61%
(% for various income ranges: 44.0% for AGIs below $10k, 54.3% for AGIs $10k-25k, 62.2% for AGIs $25k-50k, 59.0% for AGIs $50k-75k, 51.6% for AGIs $75k-100k, 56.7% for AGIs over 100k)
Household received Food Stamps/SNAP in the past 12 months: 161 Household did not receive Food Stamps/SNAP in the past 12 months: 2,257
Women who had a birth in the past 12 months: 14 (14 now married, 0 unmarried) Women who did not have a birth in the past 12 months: 1,364 (929 now married, 419 unmarried)
Housing units in zip code 62549 with a mortgage: 1,370 (91 second mortgage, 92 both second mortgage and home equity loan) Houses without a mortgage: 102
Median monthly owner costs for units with a mortgage: $1,639 Median monthly owner costs for units without a mortgage: $541
Residents with income below the poverty level in 2022:
This zip code:
9.3%
Whole state:
11.9%
Residents with income below 50% of the poverty level in 2022:
This zip code:
8.7%
Whole state:
5.7%
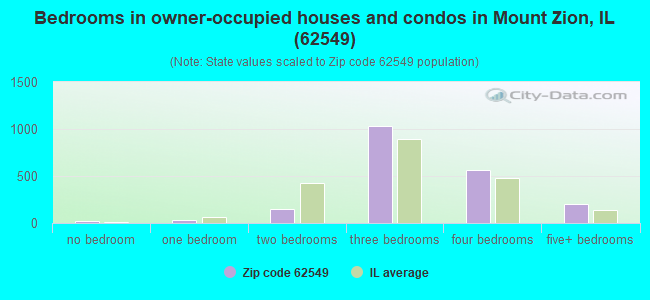
Median number of rooms in houses and condos:
Here:
7.1
State:
6.4
Median number of rooms in apartments:
Here:
4.0
State:
4.1
Notable locations in this zip code not listed on our city pages
In group quarters: 72 (-1 institutionalized population)
Size of family households: 968 2-persons, 372 3-persons, 403 4-persons, 96 5-persons, 25 6-persons, 54 7-or-more-persons
Size of nonfamily households: 478 1-person, 32 2-persons
1,617 married couples with children.
212 single-parent households (159 men, 53 women).
96.8% of residents of 62549 zip code speak English at home.
0.2% of residents speak Spanish at home (100% very well).
0.3% of residents speak other Indo-European language at home (100% very well).
2.0% of residents speak Asian or Pacific Island language at home (60% well, 21% not well, 19% not at all).
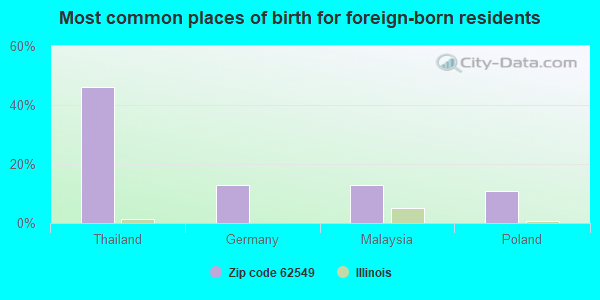
Foreign born population: 102 (1.6%) (55.1% of them are naturalized citizens)
This zip code:
1.6%
Whole state:
14.4%
46%Thailand
13%Germany
13%Malaysia
11%Poland
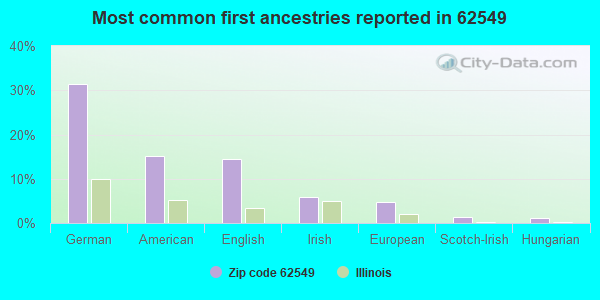
31%German
15%American
15%English
6%Irish
5%European
1%Scotch-Irish
1%Hungarian
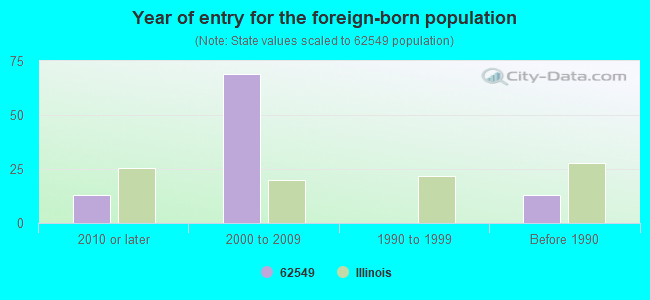
Year of entry for the foreign-born population
132010 or later
692000 to 2009
01990 to 1999
13Before 1990
Major facilities with environmental interests located in this zip code:
PPG INDUSTRIES (ELWIN MOUNT ZION ROAD in MOUNT ZION, IL)
STATE MASTER (Illinois EPA Project) - SOLID WASTE PROGRAM, HAZARDOUS WASTE PROGRAM, AIR PROGRAM AIR MAJOR (AIRS/AFS) (Integrated Compliance Information System) - ICIS-05-2005-3635, ENFORCEMENT/COMPLIANCE ACTIVITY FORMAL ENFORCEMENT ACTION (Integrated Compliance Information System) - ICIS-05-2005-3635, ENFORCEMENT/COMPLIANCE ACTIVITY COMPLIANCE ACTIVITY (Tracking inspections of insecticide, fungicide, and rodenticide, and toxic substances) CRITERIA AND HAZARDOUS AIR POLLUTANT INVENTORY (Inventory of air pollution sources) National Pollutant Discharge Elimination System NON-MAJOR (Tracking pollutant discharge elimination systems) - permit AIR MAJOR ("Best Available" air pollution technologies tracking) HAZARDOUS WASTE BIENNIAL REPORTER (Resource Conservation and Recovery Act (tracking hazardous waste)) Large Quantity Generators, more that 1000 kg of hazardous waste/month (Resource Conservation and Recovery Act (tracking hazardous waste)) - notification TRI REPORTER (Tracking of toxic chemicals releasing facilities) Business SIC and NAICS classification: FLAT GLASS Organizations: PPG INDUSTRIES INC (CONTACT/OPERATOR)
Alternative names: PPG IND. INC., WORKS 14, PPG INDS. INC. WORKS # 14, PPG INDUSTRIES-MT ZION, PPG INDUSTRIES, INC.
DG MANUFACTURING INC (101 STATE HWY 121 SOUTH in MT ZION, IL)
STATE MASTER (Illinois EPA Project) - HAZARDOUS WASTE PROGRAM, AIR PROGRAM AIR MINOR (AIRS/AFS) CRITERIA AND HAZARDOUS AIR POLLUTANT INVENTORY (Inventory of air pollution sources) Conditionally Exempt Small Quantity Generators, less than 100 kg/month of hazardous waste (Resource Conservation and Recovery Act (tracking hazardous waste)) - notification Business SIC classification: NONCLASSIFIABLE ESTABLISHMENTS Organizations: DICKEN DON (CONTACT/OWNER)
Alternative names: PROCESS MAINTENANCE INC
MT ZION COMM SCHOOL DIST 3 LEA (455 ELM ST in MT ZION, IL)
(Integrated Compliance Information System) - ICIS-05-1986-0036, FORMAL ENFORCEMENT ACTION COMPLIANCE ACTIVITY (Tracking inspections of insecticide, fungicide, and rodenticide, and toxic substances) Business SIC classification: ELEMENTARY AND SECONDARY SCHOOLS Alternative names: MT ZION C U S D NUMBER 3, MT ZION COMMUNITY UNIT SCH DIST #3
MT ZION TOWNSHIP CEMETARY (WOODLAND ST in MT ZION, IL)
STATE MASTER (Illinois EPA Project) - HAZARDOUS WASTE PROGRAM (Resource Conservation and Recovery Act (tracking hazardous waste))
BORDERS CONSTRUCTION CO (1640 STATE HWY 121 in MT ZION, IL)
STATE MASTER (Illinois EPA Project) - AIR PROGRAM AIR MINOR (AIRS/AFS) CRITERIA AND HAZARDOUS AIR POLLUTANT INVENTORY (Inventory of air pollution sources) Business SIC classification: READY-MIXED CONCRETE Business NAICS classification: READY-MIX CONCRETE MANUFACTURING.
ILLINOIS POWER CO (WOODLAND in MT ZION, IL)
STATE MASTER (Illinois EPA Project) - AIR PROGRAM AIR MINOR (AIRS/AFS) Business SIC classification: ELECTRIC AND OTHER SERVICES COMBINED Alternative names: ILLINOIS POWER CO.-MT. ZION REG. STAT.
RIPPLES AUTO BODY (325 STATE HWY in MT ZION, IL)
STATE MASTER (Illinois EPA Project) - HAZARDOUS WASTE PROGRAM Small Quantity Generators, between 100 kg and 1000 kg of hazardous waste/month (Resource Conservation and Recovery Act (tracking hazardous waste)) - notification Organizations: RIPPLE DAVID AND KEN (CONTACT/OWNER)
GREEN VALLEY INC (100 GREEN VALLEY DR in MT ZION, IL)
STATE MASTER (Illinois EPA Project) - SOLID WASTE PROGRAM Small Quantity Generators, between 100 kg and 1000 kg of hazardous waste/month (Resource Conservation and Recovery Act (tracking hazardous waste)) - notification
MCGAUGHEY ELEM SCHOOL (1320 W MAIN ST in MOUNT ZION, IL)
(National Center for Education Statistics) - STATE ID-3905500302004 Organizations: MT ZION COMM UNIT SCH DIST 3 (SCHOOL DISTRICT)
MT ZION ELEM SCHOOL (725 W MAIN ST in MOUNT ZION, IL)
(National Center for Education Statistics) - STATE ID-3905500302005 Organizations: MT ZION COMM UNIT SCH DIST 3 (SCHOOL DISTRICT)
MT ZION HIGH SCHOOL (305 S HENDERSON ST in MOUNT ZION, IL)
(National Center for Education Statistics) - STATE ID-3905500300001 Organizations: MT ZION COMM UNIT SCH DIST 3 (SCHOOL DISTRICT)
MT ZION INTERMEDIATE SCHOOL (310 S HENDERSON ST in MOUNT ZION, IL)
(National Center for Education Statistics) - STATE ID-3905500302006 Organizations: MT ZION COMM UNIT SCH DIST 3 (SCHOOL DISTRICT)
MT ZION JR HIGH SCHOOL (315 S HENDERSON ST in MOUNT ZION, IL)
(National Center for Education Statistics) - STATE ID-3905500301001 Organizations: MT ZION COMM UNIT SCH DIST 3 (SCHOOL DISTRICT)
Housing units lacking complete kitchen facilities: 0.9%
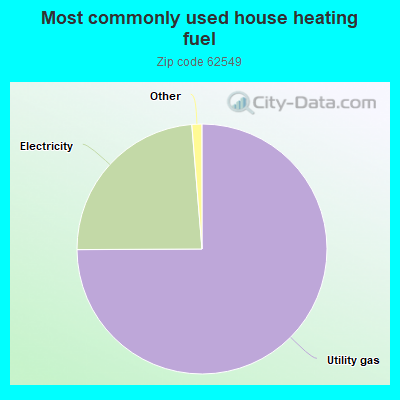
75.0%Utility gas
23.8%Electricity
0.8%Bottled, tank, or LP gas
0.5%Other fuel
Population in 1990: 5,691. Population change in the 1990s: +49 (+0.9%).
Place of birth for U.S.-born residents:
This state: 5,163
Northeast: 30
Midwest: 594
South: 353
West: 327
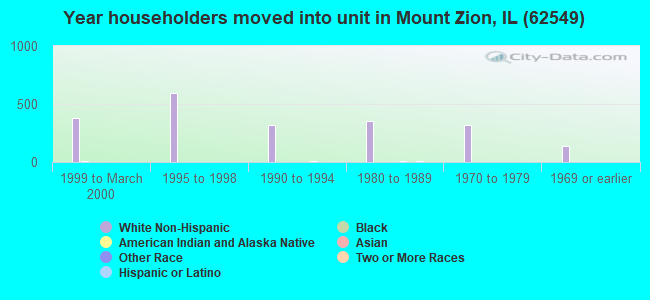
57% of the 62549 zip code residents lived in the same house 5 years ago. Out of people who lived in different houses, 65% lived in this county. Out of people who lived in different counties, 50% lived in Illinois.
92% of the 62549 zip code residents lived in the same house 1 year ago. Out of people who lived in different houses, 66% moved from this county. Out of people who lived in different houses, 17% moved from different county within same state. Out of people who lived in different houses, 14% moved from different state.
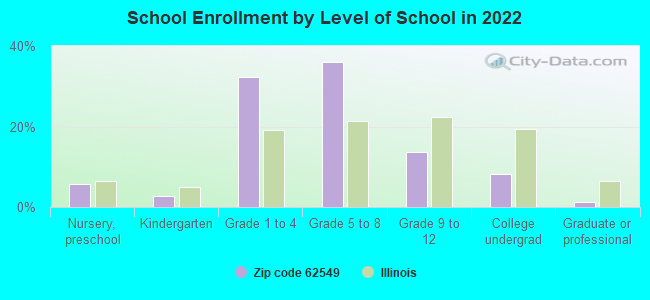
Private vs. public school enrollment:
Students in private schools in grades 1 to 8 (elementary and middle school): 103
Here:
8.1%
Illinois:
13.3%
Students in private schools in grades 9 to 12 (high school): 36
Here:
13.9%
Illinois:
9.9%
Students in private undergraduate colleges: 94
Here:
60.4%
Illinois:
27.4%
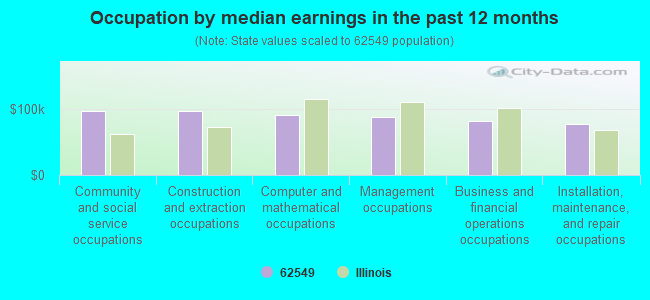
Occupation by median earnings in the past 12 months ($)
97,398Community and social service occupations
96,671Construction and extraction occupations
91,718Computer and mathematical occupations
87,818Management occupations
82,113Business and financial operations occupations
77,008Installation, maintenance, and repair occupations
Companies with federal contracts located in this zip code:
MOSES, MAX D (1326 SPITLER PK DR in MOUNT ZION, IL; small business) : $16,731 in 3 contractsin 2005
$8,500 with Army for Operation of Government-Owned Facilities -- Recreation Facilities (Non-Building). Signed on 2005-06-01. Completion date: 2005-10-30.
$8,500 with U.S. Army Corps of Engineers - civil program financing only for Operation of Government-Owned Facilities -- Recreation Facilities (Non-Building). Signed on 2005-06-01. Completion date: 2005-10-30.
-$269 with Army for Operation of Government-Owned Facilities -- Recreation Facilities (Non-Building). Signed on 2005-12-15. Completion date: 2005-10-30.
Top industries in this zip code by the number of employees in 2005:
Construction: New Single-Family Housing Construction (except Operative Builders) (50-99 employees: 1 establishment, 1-4 employees: 1 establishment)
Construction: Industrial Building Construction (50-99: 1)
Health Care and Social Assistance: Nursing Care Facilities (50-99: 1)
Accommodation and Food Services: Limited-Service Restaurants (20-49: 2)
Other Services (except Public Administration): Religious Organizations (10-19: 1, 5-9: 4, 1-4: 4)
Other Services (except Public Administration): Beauty Salons (20-49: 1, 5-9: 1, 1-4: 2)
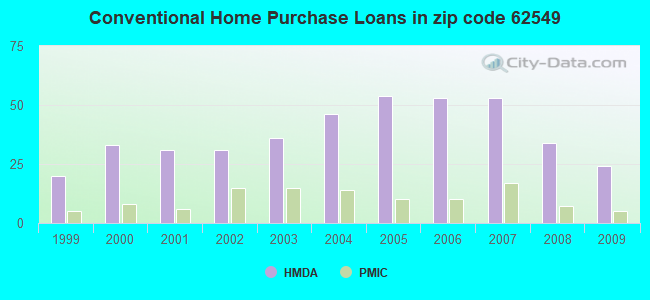
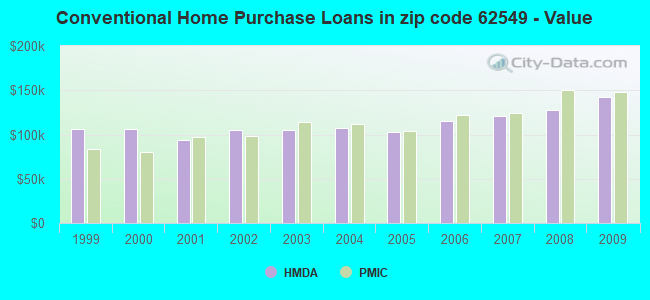
Detailed PMIC statistics for the following Tracts:0025.00
2002 - 2018 National Fire Incident Reporting System (NFIRS) incidents
According to the data from the years 2002 - 2018 the average number of fire incidents per year is 27. The highest number of fire incidents - 41 took place in 2013, and the least - 9 in 2006. The data has a constant trend.
When looking into fire subcategories, the most reports belonged to: Structure Fires (54.8%), and Outside Fires (31.7%).
Fire incident types reported to NFIRS in Zip Code 62549


 Nearest zip codes: 61925, 62521, 62523, 62544, 62532, 61936.


 According to the data from the years 2002 - 2018 the average number of fire incidents per year is 27. The highest number of fire incidents - 41 took place in 2013, and the least - 9 in 2006. The data has a constant trend.
 When looking into fire subcategories, the most reports belonged to: Structure Fires (54.8%), and Outside Fires (31.7%).