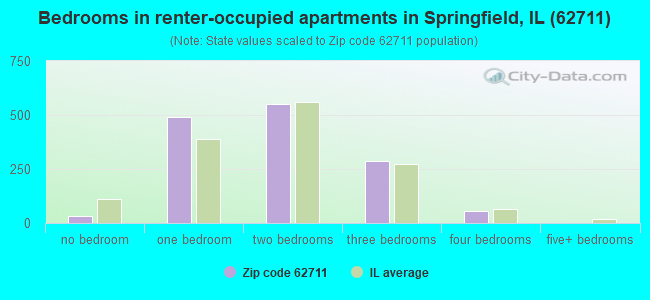
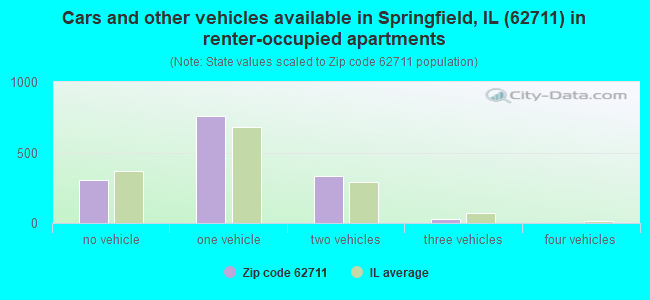
Houses and condos: 7,639 Renter-occupied apartments: 1,429
% of renters here:
19%
State:
33%
March 2022 cost of living index in zip code 62711: 86.3 (less than average, U.S. average is 100)
Land area: 30.6 sq. mi. Water area: 0.2 sq. mi.
Population density: 572 people per square mile
(low).
OSM Map
Google Map
MSN Map
OSM Map
General Map
Google Map
MSN Map
OSM Map
Google Map
MSN Map
OSM Map
Google Map
MSN Map
Please wait while loading the map...
Real estate property taxes paid for housing units in 2022:
This zip code:
2.0% ($6,146)
Illinois:
2.0% ($4,912)
Median real estate property taxes paid for housing units with mortgages in 2022: $6,164 (2.0%) Median real estate property taxes paid for housing units with no mortgage in 2022: $6,063 (2.1%)
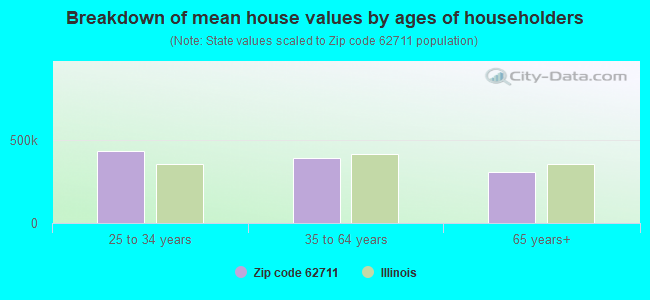
Estimated median house/condo value in 2022: $302,215
62711:
$302,215
Illinois:
$251,600
According to our research of Illinois and other state lists, there were 7 registered sex offenders living in 62711 zip code as of April 26, 2024. The ratio of all residents to sex offenders in zip code 62711 is 2,440 to 1. The ratio of registered sex offenders to all residents in this zip code is much lower than the state average.
Median resident age:
This zip code:
47.1 years
Illinois median age:
39.1 years
Average household size:
This zip code:
2.3 people
Illinois:
2.4 people
Averages for the 2020 tax year for zip code 62711, filed in 2021:
Average Adjusted Gross Income (AGI) in 2020: $125,774 (Individual Income Tax Returns)
Here:
$125,774
State:
$82,626
Salary/wage: $95,019 (reported on 71.5% of returns)
Here:
$95,019
State:
$66,640
(% of AGI for various income ranges: 1030.9% for AGIs below $25k, 3115.4% for AGIs $25k-50k, 4992.2% for AGIs $50k-75k, 6892.6% for AGIs $75k-100k, 14585.6% for AGIs $100k-200k, 69234.3% for AGIs over 200k)
Taxable interest for individuals: $1,970 (reported on 60.4% of returns)
This zip code:
$1,970
Illinois:
$2,376
(% of AGI for various income ranges: 31.5% for AGIs below $25k, 50.6% for AGIs $25k-50k, 95.0% for AGIs $50k-75k, 154.9% for AGIs $75k-100k, 207.9% for AGIs $100k-200k, 1279.8% for AGIs over 200k)
Ordinary dividends: $7,967 (reported on 40.7% of returns)
Here:
$7,967
State:
$9,061
(% of AGI for various income ranges: 59.1% for AGIs below $25k, 117.9% for AGIs $25k-50k, 252.2% for AGIs $50k-75k, 430.3% for AGIs $75k-100k, 594.7% for AGIs $100k-200k, 3511.6% for AGIs over 200k)
Net capital gain/loss in AGI: +$17,040 (reported on 36.5% of returns)
Here:
+$17,040
State:
+$31,684
(% of AGI for various income ranges: 33.9% for AGIs below $25k, 82.8% for AGIs $25k-50k, 231.2% for AGIs $50k-75k, 225.5% for AGIs $75k-100k, 632.1% for AGIs $100k-200k, 10446.6% for AGIs over 200k)
Profit/loss from business: +$25,615 (reported on 13.5% of returns)
Here:
+$25,615
State:
+$12,175
(% of AGI for various income ranges: 60.9% for AGIs below $25k, 160.9% for AGIs $25k-50k, 127.2% for AGIs $50k-75k, 288.1% for AGIs $75k-100k, 554.5% for AGIs $100k-200k, 4478.9% for AGIs over 200k)
Taxable individual retirement arrangement distribution: $23,507 (reported on 16.8% of returns)
62711:
$23,507
Illinois:
$21,613
(% of AGI for various income ranges: 79.4% for AGIs below $25k, 169.3% for AGIs $25k-50k, 355.2% for AGIs $50k-75k, 511.0% for AGIs $75k-100k, 899.0% for AGIs $100k-200k, 3520.0% for AGIs over 200k)
Self-employed (Keogh) retirement plans: $30,500 (reported on 2.1% of returns)
62711:
$30,500
Illinois:
$30,962
(% of AGI for various income ranges: 62.3% for AGIs $100k-200k, 1168.2% for AGIs over 200k)
Total itemized deductions: $34,992 (reported on 13.5% of returns)
Here:
$34,992
State:
$34,948
(% of AGI for various income ranges: 104.6% for AGIs below $25k, 241.8% for AGIs $25k-50k, 452.0% for AGIs $50k-75k, 640.6% for AGIs $75k-100k, 856.8% for AGIs $100k-200k, 4769.1% for AGIs over 200k)
Charity contributions: $15,409 (reported on 11.4% of returns)
Here:
$15,409
State:
$13,122
(% of AGI for various income ranges: 6.1% for AGIs below $25k, 29.6% for AGIs $25k-50k, 73.0% for AGIs $50k-75k, 119.0% for AGIs $75k-100k, 299.1% for AGIs $100k-200k, 2439.8% for AGIs over 200k)
Taxes paid: $8,387 (reported on 13.4% of returns)
62711:
$8,387
State:
$8,563
(% of AGI for various income ranges: 15.9% for AGIs below $25k, 35.7% for AGIs $25k-50k, 102.2% for AGIs $50k-75k, 183.2% for AGIs $75k-100k, 249.0% for AGIs $100k-200k, 1010.5% for AGIs over 200k)
Earned income credit: $1,655 (reported on 3.9% of returns)
Here:
$1,655
State:
$2,311
(% of AGI for various income ranges: 30.4% for AGIs below $25k, 25.6% for AGIs $25k-50k)
Percentage of individuals using paid preparers for their 2020 taxes: 93.4%
Here:
93%
State:
93%
(% for various income ranges: 91.4% for AGIs below $25k, 93.7% for AGIs $25k-50k, 93.2% for AGIs $50k-75k, 93.5% for AGIs $75k-100k, 93.9% for AGIs $100k-200k, 95.0% for AGIs over 200k)
Averages for the 2012 tax year for zip code 62711, filed in 2013:
Average Adjusted Gross Income (AGI) in 2012: $107,688 (Individual Income Tax Returns)
Here:
$107,688
State:
$68,058
Salary/wage: $83,572 (reported on 77.2% of returns)
Here:
$83,572
State:
$55,396
(% of AGI for various income ranges: 66.3% for AGIs below $25k, 62.0% for AGIs $25k-50k, 60.6% for AGIs $50k-75k, 63.2% for AGIs $75k-100k, 68.8% for AGIs $100k-200k, 51.8% for AGIs over 200k)
Taxable interest for individuals: $2,141 (reported on 60.0% of returns)
This zip code:
$2,141
Illinois:
$1,969
(% of AGI for various income ranges: 2.8% for AGIs below $25k, 1.6% for AGIs $25k-50k, 1.1% for AGIs $50k-75k, 1.0% for AGIs $75k-100k, 1.0% for AGIs $100k-200k, 1.3% for AGIs over 200k)
Ordinary dividends: $6,670 (reported on 41.1% of returns)
Here:
$6,670
State:
$7,786
(% of AGI for various income ranges: 4.2% for AGIs below $25k, 2.4% for AGIs $25k-50k, 2.4% for AGIs $50k-75k, 2.0% for AGIs $75k-100k, 1.5% for AGIs $100k-200k, 3.4% for AGIs over 200k)
Net capital gain/loss in AGI: +$12,609 (reported on 32.2% of returns)
Here:
+$12,609
State:
+$22,183
(% of AGI for various income ranges: 0.4% for AGIs $25k-50k, 0.7% for AGIs $50k-75k, 1.4% for AGIs $75k-100k, 1.4% for AGIs $100k-200k, 7.2% for AGIs over 200k)
Profit/loss from business: +$23,464 (reported on 14.1% of returns)
Here:
+$23,464
State:
+$12,903
(% of AGI for various income ranges: 5.7% for AGIs below $25k, 2.3% for AGIs $25k-50k, 0.9% for AGIs $50k-75k, 1.6% for AGIs $75k-100k, 3.1% for AGIs $100k-200k, 3.7% for AGIs over 200k)
Taxable individual retirement arrangement distribution: $16,341 (reported on 16.5% of returns)
62711:
$16,341
Illinois:
$17,929
(% of AGI for various income ranges: 5.2% for AGIs below $25k, 4.7% for AGIs $25k-50k, 4.2% for AGIs $50k-75k, 3.4% for AGIs $75k-100k, 2.6% for AGIs $100k-200k, 1.5% for AGIs over 200k)
Self-employment retirement plans: $29,811 (reported on 2.2% of returns)
62711:
$29,811
Illinois:
$24,666
(% of AGI for various income ranges: 0.4% for AGIs $100k-200k, 1.2% for AGIs over 200k)
Total itemized deductions: $25,952 (16% of AGI, reported on 53.7% of returns)
Here:
$25,952
State:
$26,433
Here:
15.5% of AGI
State:
19.2% of AGI
(% of AGI for various income ranges: 16.2% for AGIs below $25k, 13.7% for AGIs $25k-50k, 14.6% for AGIs $50k-75k, 14.8% for AGIs $75k-100k, 14.2% for AGIs $100k-200k, 11.0% for AGIs over 200k)
Charity contributions: $5,045 (reported on 46.4% of returns)
Here:
$5,045
State:
$4,525
(% of AGI for various income ranges: 0.9% for AGIs below $25k, 1.5% for AGIs $25k-50k, 1.9% for AGIs $50k-75k, 2.3% for AGIs $75k-100k, 2.5% for AGIs $100k-200k, 2.1% for AGIs over 200k)
Taxes paid: $13,137 (reported on 53.5% of returns)
62711:
$13,137
State:
$11,968
(% of AGI for various income ranges: 3.5% for AGIs below $25k, 4.1% for AGIs $25k-50k, 5.6% for AGIs $50k-75k, 6.4% for AGIs $75k-100k, 7.3% for AGIs $100k-200k, 6.6% for AGIs over 200k)
Earned income credit: $1,646 (reported on 4.1% of returns)
Here:
$1,646
State:
$2,349
(% of AGI for various income ranges: 2.1% for AGIs below $25k, 0.3% for AGIs $25k-50k)
Percentage of individuals using paid preparers for their 2012 taxes: 56.9%
Here:
57%
State:
57%
(% for various income ranges: 48.1% for AGIs below $25k, 53.7% for AGIs $25k-50k, 55.5% for AGIs $50k-75k, 57.4% for AGIs $75k-100k, 59.1% for AGIs $100k-200k, 78.4% for AGIs over 200k)
Averages for the 2004 tax year for zip code 62711, filed in 2005:
Average Adjusted Gross Income (AGI) in 2004: $84,739 (Individual Income Tax Returns)
Here:
$84,739
State:
$54,625
Salary/wage: $64,825 (reported on 81.9% of returns)
Here:
$64,825
State:
$46,811
(% of AGI for various income ranges: 120.8% for AGIs below $10k, 64.9% for AGIs $10k-25k, 71.5% for AGIs $25k-50k, 73.0% for AGIs $50k-75k, 76.3% for AGIs $75k-100k, 56.6% for AGIs over 100k)
Taxable interest for individuals: $1,903 (reported on 66.2% of returns)
This zip code:
$1,903
Illinois:
$2,101
(% of AGI for various income ranges: 12.5% for AGIs below $10k, 6.5% for AGIs $10k-25k, 2.2% for AGIs $25k-50k, 1.7% for AGIs $50k-75k, 1.4% for AGIs $75k-100k, 1.1% for AGIs over 100k)
Taxable dividends: $3,340 (reported on 44.4% of returns)
Here:
$3,340
State:
$4,306
(% of AGI for various income ranges: 7.5% for AGIs below $10k, 3.9% for AGIs $10k-25k, 1.7% for AGIs $25k-50k, 1.8% for AGIs $50k-75k, 1.5% for AGIs $75k-100k, 1.7% for AGIs over 100k)
Net capital gain/loss: +$7,982 (reported on 35.4% of returns)
Here:
+$7,982
State:
+$17,321
(% of AGI for various income ranges: -5.7% for AGIs below $10k, 2.3% for AGIs $10k-25k, 0.8% for AGIs $25k-50k, 0.5% for AGIs $50k-75k, 1.5% for AGIs $75k-100k, 4.6% for AGIs over 100k)
Profit/loss from business: +$18,469 (reported on 15.7% of returns)
Here:
+$18,469
State:
+$11,771
(% of AGI for various income ranges: -0.7% for AGIs below $10k, 4.0% for AGIs $10k-25k, 1.8% for AGIs $25k-50k, 1.8% for AGIs $50k-75k, 3.3% for AGIs $75k-100k, 3.9% for AGIs over 100k)
IRA payment deduction: $3,528 (reported on 2.4% of returns)
62711:
$3,528
Illinois:
$3,087
(% of AGI for various income ranges: 1.1% for AGIs below $10k, 0.3% for AGIs $25k-50k, 0.1% for AGIs $50k-75k, 0.1% for AGIs $75k-100k, 0.1% for AGIs over 100k)
Self-employed pension: $15,530 (reported on 2.5% of returns)
Here:
$15,530
Illinois:
$16,965
Total itemized deductions: $20,180 (15% of AGI, reported on 52.1% of returns)
Here:
$20,180
State:
$20,239
Here:
14.8% of AGI
State:
19.5% of AGI
(% of AGI for various income ranges: 26.0% for AGIs below $10k, 17.6% for AGIs $10k-25k, 14.8% for AGIs $25k-50k, 15.7% for AGIs $50k-75k, 16.0% for AGIs $75k-100k, 10.5% for AGIs over 100k)
Charity contributions deductions: $4,392 (3% of AGI, reported on 47.7% of returns)
Here:
$4,392
State:
$3,719
Here:
3.1% of AGI
State:
3.4% of AGI
(% of AGI for various income ranges: 1.5% for AGIs below $10k, 1.7% for AGIs $10k-25k, 1.7% for AGIs $25k-50k, 2.2% for AGIs $50k-75k, 2.6% for AGIs $75k-100k, 2.6% for AGIs over 100k)
Total tax: $16,527 (reported on 82.7% of returns)
62711:
$16,527
State:
$9,882
(% of AGI for various income ranges: 3.0% for AGIs below $10k, 4.7% for AGIs $10k-25k, 8.1% for AGIs $25k-50k, 9.6% for AGIs $50k-75k, 10.3% for AGIs $75k-100k, 19.8% for AGIs over 100k)
Earned income credit: $1,103 (reported on 3.4% of returns)
Here:
$1,103
State:
$1,788
Percentage of individuals using paid preparers for their 2004 taxes: 55.2%
Here:
55%
State:
61%
(% for various income ranges: 44.5% for AGIs below $10k, 53.9% for AGIs $10k-25k, 53.8% for AGIs $25k-50k, 57.9% for AGIs $50k-75k, 54.1% for AGIs $75k-100k, 64.7% for AGIs over 100k)
Likely homosexual households (counted as self-reported same-sex unmarried-partner households)
Lesbian couples: 0.1% of all households
Gay men: 0.0% of all households
Household received Food Stamps/SNAP in the past 12 months: 239 Household did not receive Food Stamps/SNAP in the past 12 months: 7,100
Women who had a birth in the past 12 months: 207 (166 now married, 39 unmarried) Women who did not have a birth in the past 12 months: 3,066 (1,701 now married, 1,346 unmarried)
Housing units in zip code 62711 with a mortgage: 3,927 (367 second mortgage, 318 both second mortgage and home equity loan) Houses without a mortgage: 139
Median monthly owner costs for units with a mortgage: $1,925 Median monthly owner costs for units without a mortgage: $913
Residents with income below the poverty level in 2022:
This zip code:
3.1%
Whole state:
11.9%
Residents with income below 50% of the poverty level in 2022:
This zip code:
1.2%
Whole state:
5.7%
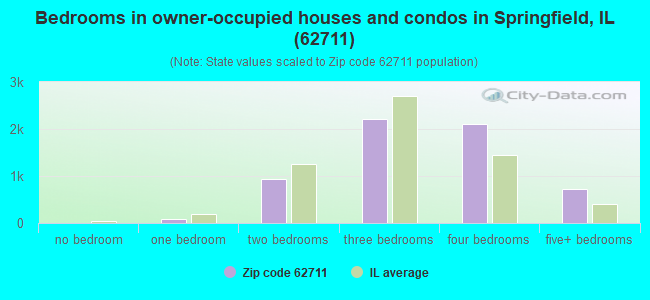
Median number of rooms in houses and condos:
Here:
7.6
State:
6.4
Median number of rooms in apartments:
Here:
3.8
State:
4.1
Notable locations in this zip code not listed on our city pages
Notable locations in zip code 62711: Cockrell (A), Sanger (B), Route 66 Drive-In (C), Springfield Fire Department Station 12 (D). Display/hide their locations on the map
Cemeteries: Morgan Cemetery (1), Bridges Cemetery (2), Old Salem Cemetery (3), Smith Cemetery (4), Harmony Cemetery (5), Bethel Cemetery (6). Display/hide their locations on the map
In group quarters: 312 (-1 institutionalized population)
Size of family households: 2,522 2-persons, 951 3-persons, 1,028 4-persons, 263 5-persons, 78 6-persons, 34 7-or-more-persons
Size of nonfamily households: 2,334 1-person, 212 2-persons, 20 3-persons
3,229 married couples with children.
487 single-parent households (37 men, 450 women).
92.3% of residents of 62711 zip code speak English at home.
1.4% of residents speak Spanish at home (80% very well, 5% well, 15% not well).
1.8% of residents speak other Indo-European language at home (87% very well, 6% well, 7% not well).
4.1% of residents speak Asian or Pacific Island language at home (68% very well, 27% well, 6% not well).
0.7% of residents speak other language at home (96% very well, 4% well).
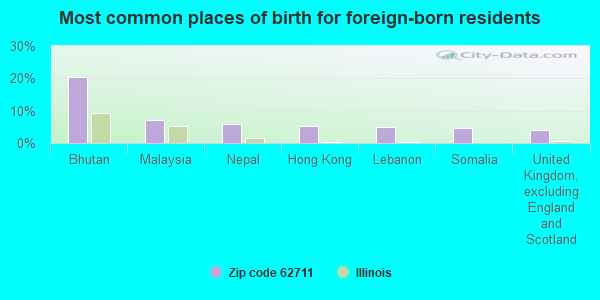
Foreign born population: 1,035 (5.9%) (65.9% of them are naturalized citizens)
This zip code:
5.9%
Whole state:
14.4%
20%Bhutan
7%Malaysia
6%Nepal
5%Hong Kong
5%Lebanon
5%Somalia
4%United Kingdom, excluding England and Scotland
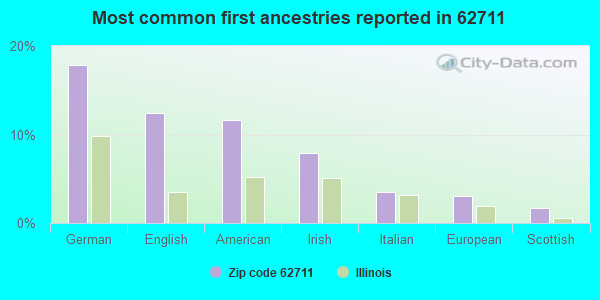
18%German
12%English
12%American
8%Irish
3%Italian
3%European
2%Scottish
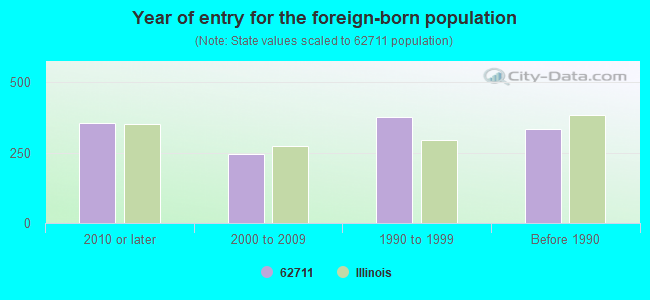
Year of entry for the foreign-born population
3532010 or later
2432000 to 2009
3771990 to 1999
332Before 1990
Facilities with environmental interests located in this zip code:
PHOENIX COLLISION & AUTOMOTIVE (4047 W JEFFERSON STE 111 in SPRINGFIELD, IL)
STATE MASTER (Illinois EPA Project) - HAZARDOUS WASTE PROGRAM Conditionally Exempt Small Quantity Generators, less than 100 kg/month of hazardous waste (Resource Conservation and Recovery Act (tracking hazardous waste)) Organizations: PHOENIX COLLISION & AUTO REFINISHING INC (CONTACT/OPERATOR)
Alternative names: PHOENIX COLLISION & AUTO REFINISHING INC
Housing units lacking complete kitchen facilities: 0.5%
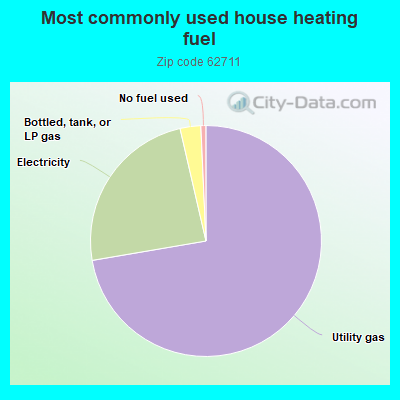
72.1%Utility gas
24.0%Electricity
2.9%Bottled, tank, or LP gas
0.7%No fuel used
Place of birth for U.S.-born residents:
This state: 13,004
Northeast: 171
Midwest: 1,893
South: 819
West: 281
90% of the 62711 zip code residents lived in the same house 1 year ago. Out of people who lived in different houses, 61% moved from this county. Out of people who lived in different houses, 22% moved from different county within same state. Out of people who lived in different houses, 14% moved from different state. Out of people who lived in different houses, 3% moved from abroad.
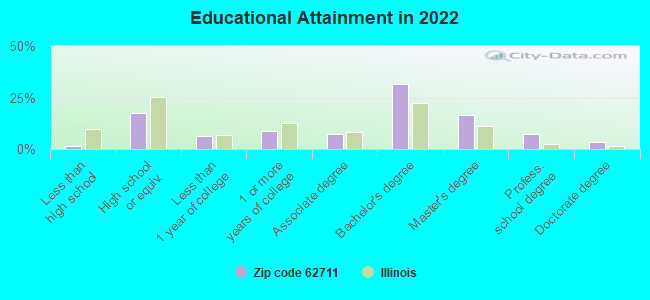
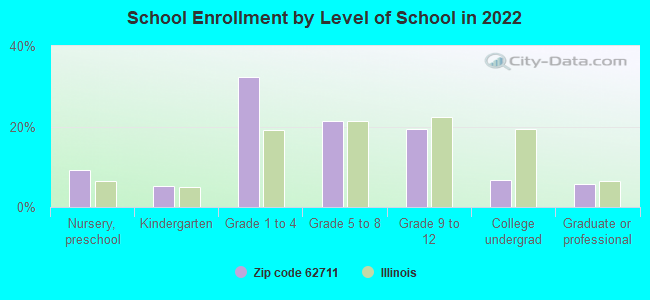
Private vs. public school enrollment:
Students in private schools in grades 1 to 8 (elementary and middle school): 333
Here:
15.6%
Illinois:
13.3%
Students in private schools in grades 9 to 12 (high school): 38
Here:
5.0%
Illinois:
9.9%
Students in private undergraduate colleges: 69
Here:
25.5%
Illinois:
27.4%
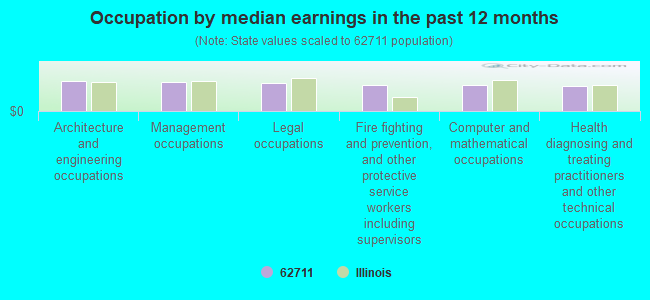
Occupation by median earnings in the past 12 months ($)
110,800Architecture and engineering occupations
106,511Management occupations
104,969Legal occupations
96,314Fire fighting and prevention, and other protective service workers including supervisors
95,208Computer and mathematical occupations
93,791Health diagnosing and treating practitioners and other technical occupations
Companies with federal contracts located in this zip code:
HINCHLIFFE, GEORGE (2702 KITTY HAWK COURT in SPRINGFIELD, IL; small business) : $170,128 in 21 contractsfrom 2004 to 2006
Contracts for Industrial Hygienics, Engineering and Technical Services by Army Signed by year:2000: $0; 2001: $0; 2002: $0; 2003: $0; 2004: $61,028; 2005: $48,772; 2006: $60,328.
Biggest contracts:
$19,400 with Army for Industrial Hygienics. Signed on 2004-03-17. Completion date: 2004-09-30.
$16,778, same as above.Signed on 2004-07-29. Completion date: 2004-09-30.
$15,935, same as above.Signed on 2004-02-19. Completion date: 2004-09-30.
$14,794, same as above.Signed on 2005-11-28. Completion date: 2006-09-30.
AMERICAN LUNG ASSOCIATION OF I (3000 KELLY LN in SPRINGFIELD, IL)
$5,000 with Air Force for Physical Medicine and Rehabilitation Services. Taking place in GA. Signed on 2005-09-29. Completion date: 2005-10-28.
Top industries in this zip code by the number of employees in 2005:
Finance and Insurance: Commercial Banking (250-499 employees: 1 establishment)
Management of Companies and Enterprises: Corporate, Subsidiary, and Regional Managing Offices (20-49: 2, 1-4: 1)
Other Services (except Public Administration): Religious Organizations (10-19: 3, 5-9: 1, 1-4: 2)
Other Services (except Public Administration): Beauty Salons (20-49: 1, 1-4: 1)
Wholesale Trade: Toy and Hobby Goods and Supplies Merchant Wholesalers (20-49: 1, 1-4: 1)
Other Services (except Public Administration): Other Social Advocacy Organizations (20-49: 1)
Other Services (except Public Administration): Automotive Body, Paint, and Interior Repair and Maintenance (20-49: 1)
Finance and Insurance: Insurance Agencies and Brokerages (10-19: 1, 1-4: 9)
Accommodation and Food Services: Drinking Places (Alcoholic Beverages) (20-49: 1)
Fatal accident statistics in 2013:
Fatal accident count: 1
Vehicles involved in fatal accidents: 1
Fatal accidents caused by drunken drivers: 0
Fatalities: 1
Persons involved in fatal accidents: 1
Pedestrians involved in fatal accidents: 0
Fatal accident statistics in 2012:
Fatal accident count: 1
Vehicles involved in fatal accidents: 1
Fatal accidents caused by drunken drivers: 1
Fatalities: 1
Persons involved in fatal accidents: 4
Pedestrians involved in fatal accidents: 0
2004 - 2018 National Fire Incident Reporting System (NFIRS) incidents
Based on the data from the years 2004 - 2018 the average number of fires per year is 18. The highest number of fire incidents - 35 took place in 2014, and the least - 2 in 2004. The data has an increasing trend.
When looking into fire subcategories, the most incidents belonged to: Outside Fires (43.0%), and Structure Fires (31.8%).
Fire incident types reported to NFIRS in Zip Code 62711


 Based on the data from the years 2004 - 2018 the average number of fires per year is 18. The highest number of fire incidents - 35 took place in 2014, and the least - 2 in 2004. The data has an increasing trend.
 When looking into fire subcategories, the most incidents belonged to: Outside Fires (43.0%), and Structure Fires (31.8%).