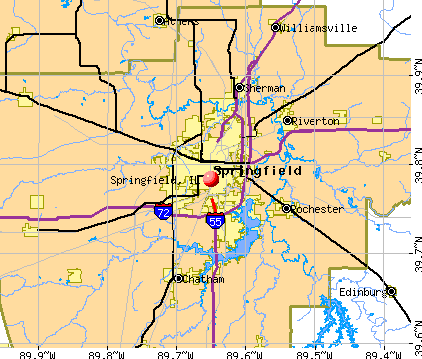
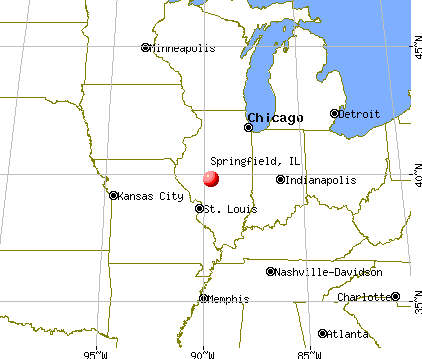
Springfield, Illinois
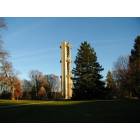
Springfield: Carillon in Washington Park

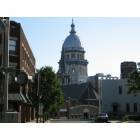
Springfield: Springfield, Illinois: Old State Capitol
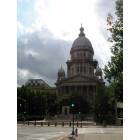
Springfield: New State Capitol Building
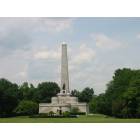
Springfield: Lincoln Tomb, Springfield, IL

Springfield: Illinois State Capital, Springfield, IL
Springfield: The state capitol from Adams & Broadway St.

Springfield: New State Capitol Building
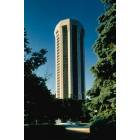
Springfield: View of Hilton hotel Springfield
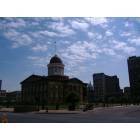
Springfield: Old Capital downtown Springfield

Springfield: Lincoln Statue and train station downtown

Springfield: Illinois State Capitol Building
- see
19
more - add
your
Submit your own pictures of this city and show them to the world
- OSM Map
- General Map
- Google Map
- MSN Map
Population change since 2000: +1.6%
 |
| Males: 53,628 | |
| Females: 59,645 |
| Median resident age: | 41.3 years |
| Illinois median age: | 39.1 years |
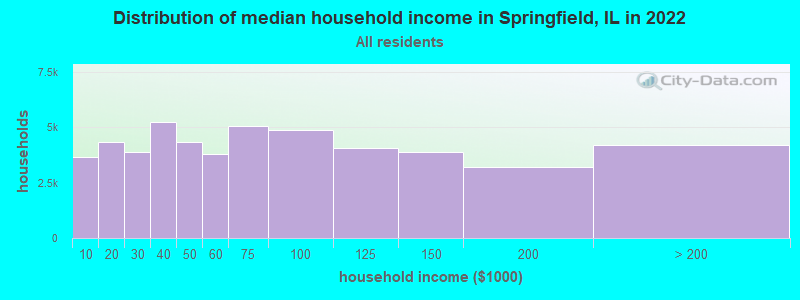
| Springfield: | $60,082 |
| IL: | $76,708 |
Estimated per capita income in 2022: $40,986 (it was $23,324 in 2000)
Springfield city income, earnings, and wages data
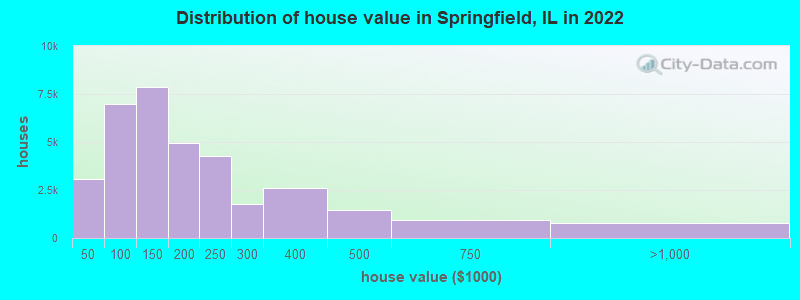
Estimated median house or condo value in 2022: $147,800 (it was $84,300 in 2000)
| Springfield: | $147,800 |
| IL: | $251,600 |
Mean prices in 2022: all housing units: $187,965; detached houses: $196,766; townhouses or other attached units: $216,708; in 2-unit structures: $114,756; in 3-to-4-unit structures: $88,286; in 5-or-more-unit structures: $131,164; mobile homes: $45,398
Median gross rent in 2022: $849.
(7.9% for White Non-Hispanic residents, 41.1% for Black residents, 14.8% for Hispanic or Latino residents, 26.5% for American Indian residents, 31.0% for other race residents, 24.3% for two or more races residents)
Detailed information about poverty and poor residents in Springfield, IL


- 78,67669.4%White alone
- 20,30717.9%Black alone
- 6,4205.7%Two or more races
- 4,0333.6%Hispanic
- 3,0682.7%Asian alone
- 4090.4%American Indian alone
- 4180.4%Other race alone
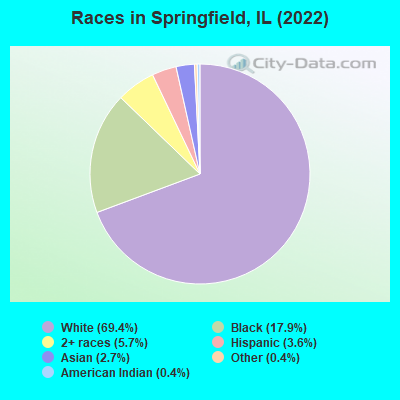
Races in Springfield detailed stats: ancestries, foreign born residents, place of birth
According to our research of Illinois and other state lists, there were 395 registered sex offenders living in Springfield, Illinois as of April 27, 2024.
The ratio of all residents to sex offenders in Springfield is 294 to 1.
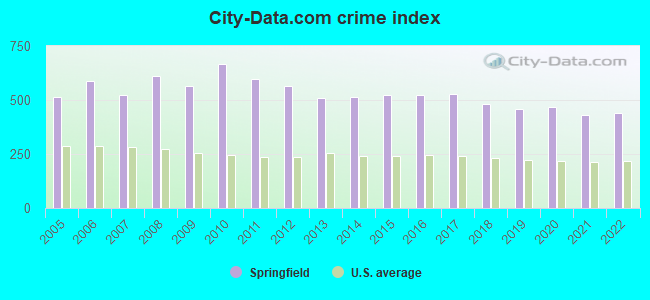
The City-Data.com crime index weighs serious crimes and violent crimes more heavily. Higher means more crime, U.S. average is 246.1. It adjusts for the number of visitors and daily workers commuting into cities.
- means the value is smaller than the state average.- means the value is about the same as the state average.
- means the value is bigger than the state average.
- means the value is much bigger than the state average.
Crime rate in Springfield detailed stats: murders, rapes, robberies, assaults, burglaries, thefts, arson
Full-time law enforcement employees in 2021, including police officers: 239 (216 officers - 185 male; 31 female).
| Officers per 1,000 residents here: | 1.91 |
| Illinois average: | 2.84 |
 Recent articles from our blog. Our writers, many of them Ph.D. graduates or candidates, create easy-to-read articles on a wide variety of topics.


Latest news from Springfield, IL collected exclusively by city-data.com from local newspapers, TV, and radio stations
Ancestries: German (11.8%), American (7.4%), English (6.3%), Irish (6.1%), European (3.0%), Italian (2.8%).
Current Local Time: CST time zone
Incorporated on 04/20/1882
Elevation: 600 feet
Land area: 54.0 square miles.
Population density: 2,098 people per square mile (low).
4,847 residents are foreign born (2.1% Asia, 0.8% Africa, 0.7% Latin America, 0.5% Europe).
| This city: | 4.3% |
| Illinois: | 14.1% |
Median real estate property taxes paid for housing units with mortgages in 2022: $3,417 (2.1%)
Median real estate property taxes paid for housing units with no mortgage in 2022: $2,573 (2.0%)
Nearest city with pop. 200,000+: St. Louis, MO  (86.0 miles , pop. 348,189).
Nearest city with pop. 1,000,000+: Chicago, IL (175.8 miles , pop. 2,896,016).
Nearest cities:
), ), ), ), ), ), Latitude: 39.78 N, Longitude: 89.65 W
Daytime population change due to commuting: +32,037 (+28.3%)
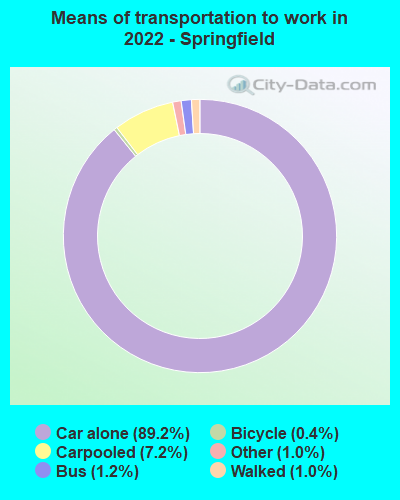
Workers who live and work in this city: 41,976 (86.7%)
Area code: 217

Springfield tourist attractions:
- The Abraham Lincoln Presidential Library and Museum in Springfield, Illinois
- Henson Robinson Zoo in Springfield, Illinois
- Multi Site Museum Featuring History and Art Exhibits
- The Lincoln Home National Historic Site in Springfield, Illinois
- The Washington Park Botanical Garden in Springfield, Illinois
- White Oaks Mall, Springfield, Illinois
Springfield, Illinois accommodation & food services, waste management - Economy and Business Data
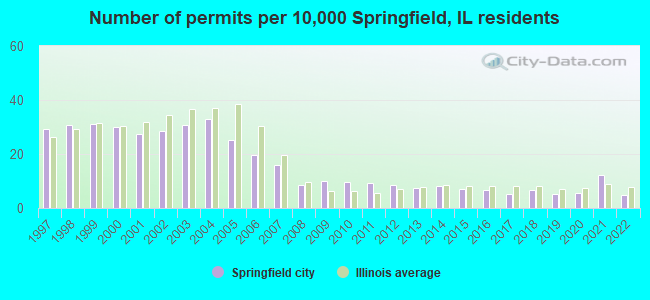
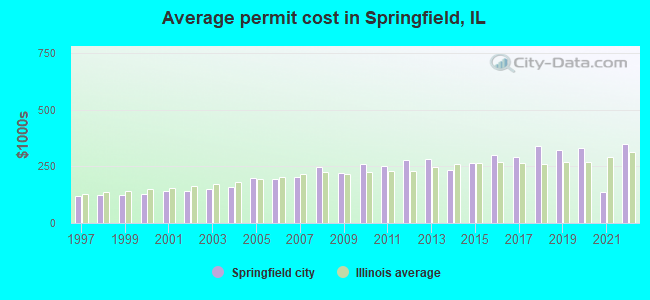
Single-family new house construction building permits:
- 2022: 55 buildings, average cost: $347,900
- 2021: 137 buildings, average cost: $134,900
- 2020: 61 buildings, average cost: $331,400
- 2019: 57 buildings, average cost: $320,900
- 2018: 74 buildings, average cost: $338,500
- 2017: 57 buildings, average cost: $289,500
- 2016: 74 buildings, average cost: $301,100
- 2015: 77 buildings, average cost: $265,100
- 2014: 89 buildings, average cost: $233,500
- 2013: 81 buildings, average cost: $283,900
- 2012: 93 buildings, average cost: $276,000
- 2011: 103 buildings, average cost: $250,700
- 2010: 106 buildings, average cost: $259,300
- 2009: 112 buildings, average cost: $220,400
- 2008: 97 buildings, average cost: $245,700
- 2007: 179 buildings, average cost: $200,700
- 2006: 219 buildings, average cost: $192,800
- 2005: 279 buildings, average cost: $198,000
- 2004: 366 buildings, average cost: $156,500
- 2003: 341 buildings, average cost: $148,100
- 2002: 316 buildings, average cost: $142,200
- 2001: 304 buildings, average cost: $143,100
- 2000: 336 buildings, average cost: $128,500
- 1999: 346 buildings, average cost: $124,900
- 1998: 342 buildings, average cost: $123,600
- 1997: 325 buildings, average cost: $120,300
| Here: | 4.3% |
| Illinois: | 4.2% |
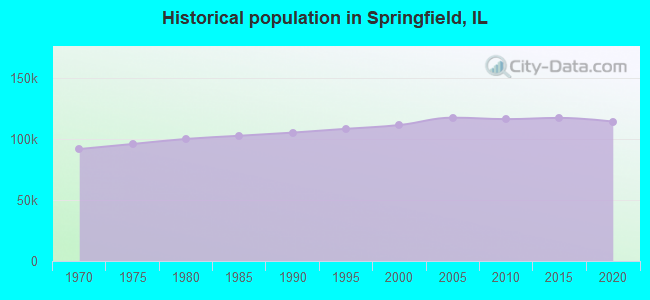
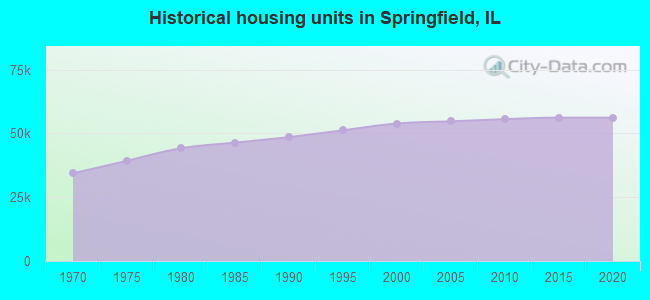
Population change in the 1990s: +4,245 (+4.0%).
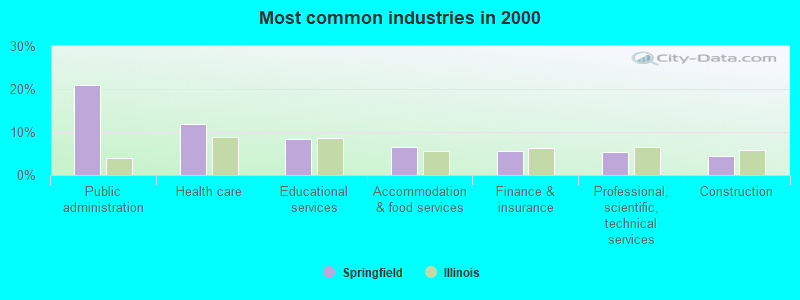
- Public administration (20.9%)
- Health care (11.9%)
- Educational services (8.4%)
- Accommodation & food services (6.4%)
- Finance & insurance (5.7%)
- Professional, scientific, technical services (5.3%)
- Construction (4.3%)
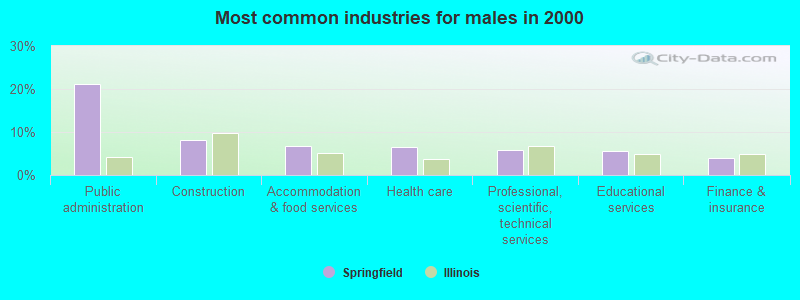
- Public administration (21.2%)
- Construction (8.0%)
- Accommodation & food services (6.7%)
- Health care (6.5%)
- Professional, scientific, technical services (5.8%)
- Educational services (5.6%)
- Finance & insurance (4.0%)
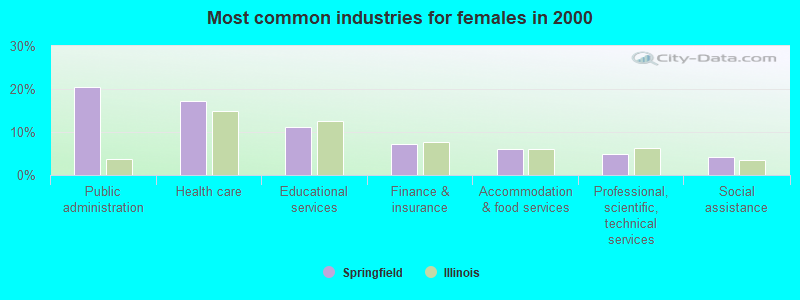
- Public administration (20.6%)
- Health care (17.3%)
- Educational services (11.2%)
- Finance & insurance (7.3%)
- Accommodation & food services (6.1%)
- Professional, scientific, technical services (4.8%)
- Social assistance (4.3%)
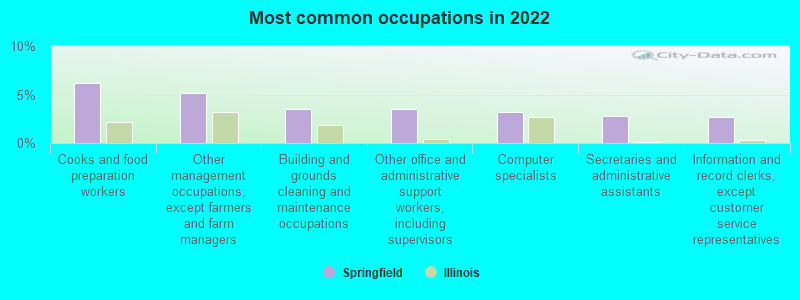
- Cooks and food preparation workers (6.2%)
- Other management occupations, except farmers and farm managers (5.2%)
- Building and grounds cleaning and maintenance occupations (3.5%)
- Other office and administrative support workers, including supervisors (3.5%)
- Computer specialists (3.2%)
- Secretaries and administrative assistants (2.8%)
- Information and record clerks, except customer service representatives (2.6%)
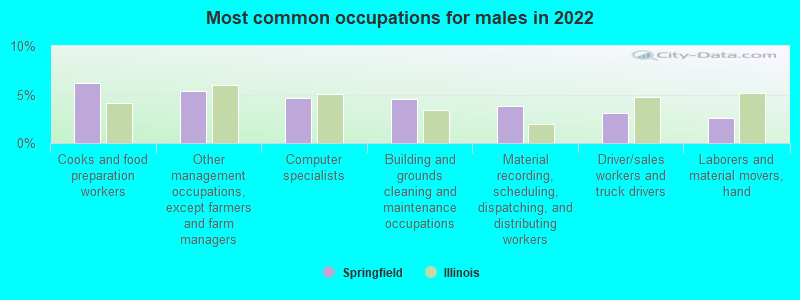
- Cooks and food preparation workers (6.2%)
- Other management occupations, except farmers and farm managers (5.4%)
- Computer specialists (4.6%)
- Building and grounds cleaning and maintenance occupations (4.5%)
- Material recording, scheduling, dispatching, and distributing workers (3.8%)
- Driver/sales workers and truck drivers (3.1%)
- Laborers and material movers, hand (2.6%)
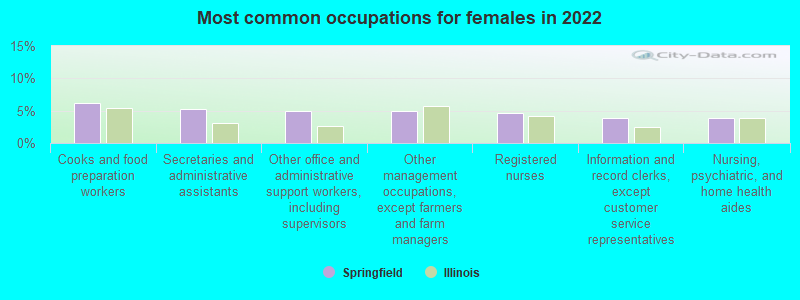
- Cooks and food preparation workers (6.2%)
- Secretaries and administrative assistants (5.2%)
- Other office and administrative support workers, including supervisors (5.0%)
- Other management occupations, except farmers and farm managers (5.0%)
- Registered nurses (4.6%)
- Information and record clerks, except customer service representatives (3.9%)
- Nursing, psychiatric, and home health aides (3.8%)
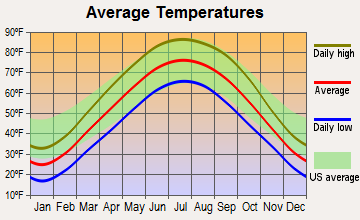
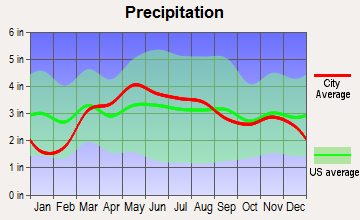
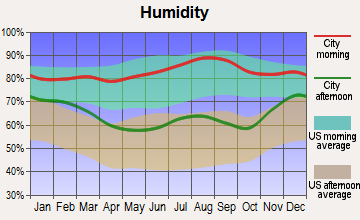
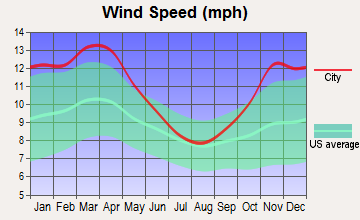
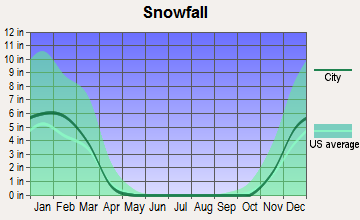
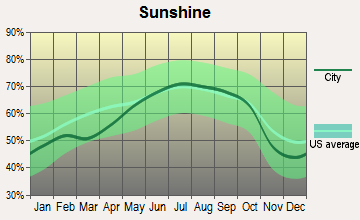
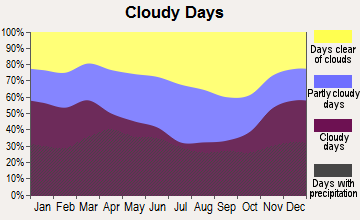
Average climate in Springfield, Illinois
Based on data reported by over 4,000 weather stations
|
|

(lower is better)
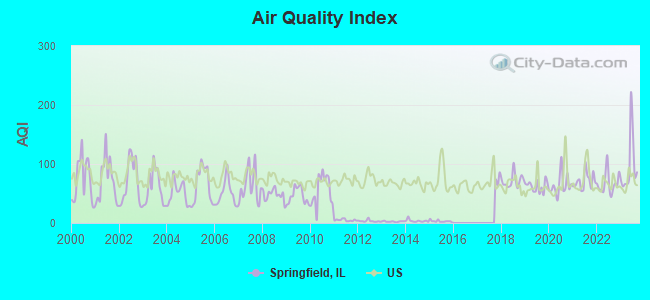
Air Quality Index (AQI) level in 2023 was 97.0. This is worse than average.
| City: | 97.0 |
| U.S.: | 72.6 |
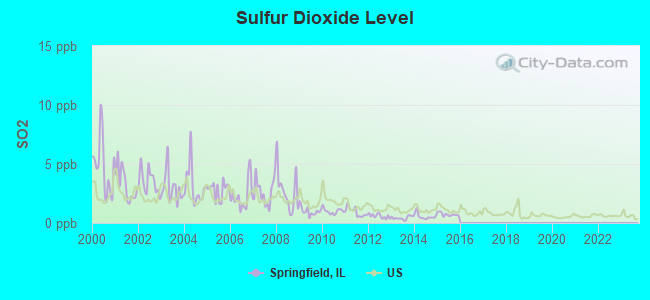
Sulfur Dioxide (SO2) [ppb] level in 2015 was 0.725. This is significantly better than average. Closest monitor was 1.3 miles away from the city center.
| City: | 0.725 |
| U.S.: | 1.515 |
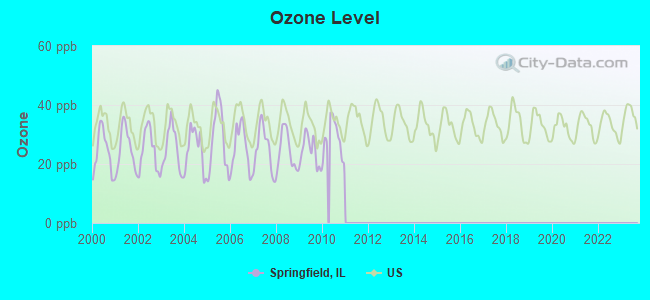
Ozone [ppb] level in 2010 was 28.8. This is about average. Closest monitor was 1.3 miles away from the city center.
| City: | 28.8 |
| U.S.: | 33.3 |
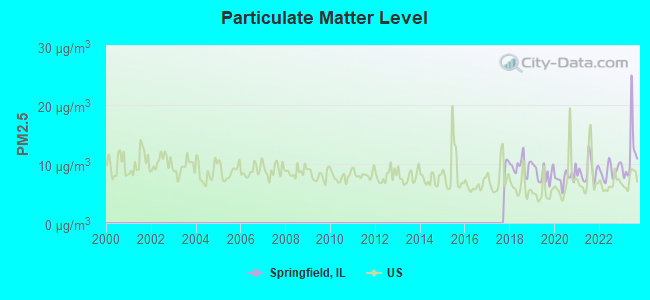
Particulate Matter (PM2.5) [µg/m3] level in 2023 was 11.6. This is significantly worse than average. Closest monitor was 3.4 miles away from the city center.
| City: | 11.6 |
| U.S.: | 8.1 |
Tornado activity:
Springfield-area historical tornado activity is slightly above Illinois state average. It is 90% greater than the overall U.S. average.
On 6/14/1957, a category F4 (max. wind speeds 207-260 mph) tornado 1.9 miles away from the Springfield city center killed 2 people and injured 50 people and caused between $500,000 and $5,000,000 in damages.
On 8/6/1977, a category F3 (max. wind speeds 158-206 mph) tornado 7.2 miles away from the city center caused between $500,000 and $5,000,000 in damages.
Earthquake activity:
Springfield-area historical earthquake activity is significantly above Illinois state average. It is 214% greater than the overall U.S. average.On 4/18/2008 at 09:36:59, a magnitude 5.4 (5.1 MB, 4.8 MS, 5.4 MW, 5.2 MW, Class: Moderate, Intensity: VI - VII) earthquake occurred 132.1 miles away from the city center
On 4/18/2008 at 09:36:59, a magnitude 5.2 (5.2 MW, Depth: 8.9 mi) earthquake occurred 132.1 miles away from the city center
On 6/10/1987 at 23:48:54, a magnitude 5.1 (4.9 MB, 4.4 MS, 4.6 MS, 5.1 LG) earthquake occurred 115.6 miles away from Springfield center
On 6/18/2002 at 17:37:15, a magnitude 5.0 (4.3 MB, 4.6 MW, 5.0 LG) earthquake occurred 159.9 miles away from Springfield center
On 4/18/2008 at 15:14:16, a magnitude 4.8 (4.5 MB, 4.8 MW, 4.6 MW, Class: Light, Intensity: IV - V) earthquake occurred 132.4 miles away from Springfield center
On 4/3/1974 at 23:05:02, a magnitude 4.7 (4.5 MB, 4.7 LG) earthquake occurred 117.3 miles away from Springfield center
Magnitude types: regional Lg-wave magnitude (LG), body-wave magnitude (MB), surface-wave magnitude (MS), moment magnitude (MW)
Natural disasters:
The number of natural disasters in Sangamon County (10) is smaller than the US average (15).Major Disasters (Presidential) Declared: 7
Emergencies Declared: 2
Causes of natural disasters: Storms: 6, Floods: 4, Tornadoes: 2, Winter Storms: 2, Hurricane: 1, Snow: 1, Snowstorm: 1, Other: 1 (Note: some incidents may be assigned to more than one category).
Main business address for: CENTRAL ILLINOIS PUBLIC SERVICE CO (ELECTRIC & OTHER SERVICES COMBINED), HORACE MANN EDUCATORS CORP /DE/ (FIRE, MARINE & CASUALTY INSURANCE).
Hospitals in Springfield:
- ADLOFF PLACE (50 ADLOFF LANE)
- ANDREW MCFARLAND MENTAL HLTH CTR (901 SOUTHWIND RD)
- BROTHER JAMES COURT (2500 ST. JAMES ROAD)
- CURTISS COURT (2883 SOUTH TAYLOR AVENUE)
- DOCTORS HOSPITAL (provides emergency services, 5230 SOUTH 6TH STREET)
- GLENWOOD TERRACE-SPRINGFIELD (2724 GLENWOOD AVENUE)
- HOSPICE CARE OF ILLINOIS (720 NORTH BOND STREET)
- HOSPICE-CARE OF SANGAMON COUNTY (319 EAST MADISON SUITE 3N)
- MEMORIAL MEDICAL CENTER (Voluntary non-profit - Private, 701 N FIRST ST)
- ST JOHNS HOSPITAL (Voluntary non-profit - Church, 800 E CARPENTER ST)
- TAYLOR HOUSE (3021 TAYLOR AVENUE)
Airports and heliports located in Springfield:
- Abraham Lincoln Capital Airport (SPI) (Runways: 3, Commercial Ops: 389, Air Taxi Ops: 6,210, Itinerant Ops: 11,707, Local Ops: 9,373, Military Ops: 6,295)
- Il Emergency Operations Center Heliport (IL20)
- Lincoln Land Community College Heliport (IL47)
- Memorial Medical Center - Springfield Heliport (54LL)
- St Johns Hospital Heliport (97IS)
Amtrak station:
SPRINGFIELD (WASHINGTON & 3RD STS.) . Services: ticket office, fully wheelchair accessible, enclosed waiting area, public restrooms, public payphones, vending machines, free short-term parking, free long-term parking, call for car rental service, taxi stand, public transit connection.Colleges/Universities in Springfield:
- Lincoln Land Community College (Full-time enrollment: 5,460; Location: 5250 Shepherd Rd; Public; Website: www.llcc.edu)
- University of Illinois at Springfield (Full-time enrollment: 3,748; Location: One University Plaza; Public; Website: www.uis.edu; Offers Doctor's degree)
- Midwest Technical Institute-Springfield (Full-time enrollment: 386; Location: 2731 Farmers Market Road; Private, for-profit; Website: midwesttech.edu)
- University of Spa & Cosmetology Arts (Full-time enrollment: 277; Location: 2913 W. White Oaks Dr.; Private, for-profit; Website: www.uscart.com)
- Capital Area School of Practical Nursing (Full-time enrollment: 169; Location: 2201 Toronto Rd; Public; Website: www.caspn.edu)
- ITT Technical Institute-Springfield (Full-time enrollment: 133; Location: 1999 Wabash Avenue; Private, for-profit; Website: www.itt-tech.edu)
- St John's College of Nursing (Full-time enrollment: 115; Location: 729 E. Carpenter St; Private, not-for-profit; Website: www.stjohnscollegespringfield.edu)
- St John's Hospital School of Clinical Lab Science (Full-time enrollment: 6; Location: 800 E Carpenter St.; Private, not-for-profit; Website: www.st-johns.org)
Other colleges/universities with over 2000 students near Springfield:
- Millikin University (about 37 miles; Decatur, IL; Full-time enrollment: 2,419)
- Richland Community College (about 41 miles; Decatur, IL; FT enrollment: 2,434)
- Illinois Wesleyan University (about 61 miles; Bloomington, IL; FT enrollment: 2,323)
- Illinois State University (about 62 miles; Normal, IL; FT enrollment: 18,804)
- Heartland Community College (about 62 miles; Normal, IL; FT enrollment: 3,958)
- Bradley University (about 64 miles; Peoria, IL; FT enrollment: 5,152)
- Illinois Central College (about 65 miles; East Peoria, IL; FT enrollment: 7,158)
Public high schools in Springfield:
- SPRINGFIELD HIGH SCHOOL (Students: 1,519, Location: 101 S LEWIS ST, Grades: 9-12)
- SPRINGFIELD SOUTHEAST HIGH SCH (Students: 1,350, Location: 2350 E ASH ST, Grades: 9-12)
- LANPHIER HIGH SCHOOL (Students: 1,288, Location: 1300 N 11TH ST, Grades: 9-12)
- DOUGLAS SCHOOL (Students: 106, Location: 444 W REYNOLDS ST, Grades: 6-12)
- SANGAMON COUNTY LEARNING ACADEMY (Students: 61, Location: 2201 TORONTO RD STE C, Grades: 8-12)
- LAWRENCE EDUCATION CENTER (Location: 101 E LAUREL ST, Grades: 9-12)
- SPRINGFIELD LEARNING ACADEMY (Location: 101 E LAUREL ST, Grades: 9-12)
Private high schools in Springfield:
- SACRED HEART GRIFFIN HIGH SCHOOL (Students: 774, Location: 1200 W WASHINGTON ST, Grades: 9-12)
- CALVARY ACADEMY (Students: 295, Location: 1730 W JEFFERSON ST, Grades: PK-12)
- LUTHERAN HIGH SCHOOL (Students: 172, Location: 3500 W WASHINGTON ST, Grades: 9-12)
- GRACE BAPTIST ACADEMY (Students: 8, Location: 2812 S WALNUT ST, Grades: 1-12)
Biggest public elementary/middle schools in Springfield:
- BENJAMIN FRANKLIN MIDDLE SCHOOL (Students: 791, Location: 1200 OUTER PARK DR, Grades: 6-8)
- U S GRANT MIDDLE SCHOOL (Students: 660, Location: 1800 W MONROE ST, Grades: 6-8)
- JEFFERSON MIDDLE SCHOOL (Students: 609, Location: 3001 S ALLIS ST, Grades: 6-8)
- WASHINGTON MIDDLE SCHOOL (Students: 583, Location: 2300 E JACKSON ST, Grades: 6-8)
- LINDSAY SCHOOL (Students: 509, Location: 3600 FIELDING DR, Grades: KG-5)
- RIDGELY ELEM SCHOOL (Students: 421, Location: 2040 N 8TH ST, Grades: PK-5)
- SPRINGFIELD BALL CHARTER SCHOOL (Students: 378, Location: 2530 E ASH ST, Grades: PK-8, Charter school)
- HARVARD PARK ELEM SCHOOL (Students: 377, Location: 2501 S 11TH ST, Grades: PK-5)
- ILES ELEM SCHOOL (Students: 351, Location: 1700 S 15TH ST, Grades: 1-8)
- BUTLER ELEM SCHOOL (Students: 334, Location: 1701 S MACARTHUR BLVD, Grades: PK-5)
Biggest private elementary/middle schools in Springfield:
- BLESSED SACRAMENT (Students: 475, Location: 748 W LAUREL ST, Grades: PK-8)
- CHRIST THE KING ELEMENTARY SCHOOL (Students: 425, Location: 1920 BARBERRY DR, Grades: PK-8)
- ST AGNES ELEMENTARY SCHOOL (Students: 393, Location: 251 N AMOS AVE, Grades: PK-8)
- SPRINGFIELD CHRISTIAN SCHOOL (Students: 371, Location: 2850 CIDER MILL LN, Grades: KG-8)
- OUR SAVIORS LUTHERAN SCHOOL (Students: 218, Location: 2645 OLD JACKSONVILLE RD, Grades: PK-8)
- ST ALOYSIUS ELEMENTARY SCHOOL (Students: 206, Location: 2125 N 21ST ST, Grades: PK-8)
- TRINITY LUTHERAN SCHOOL (Students: 193, Location: 515 S MACARTHUR BLVD, Grades: PK-8)
- CATHEDRAL SCHOOL (Students: 148, Location: 815 S 6TH ST, Grades: PK-8)
- ST JOSEPH SCHOOL (Students: 104, Location: 1344 N 5TH ST, Grades: KG-8)
- CONCORDIA LUTHERAN SCHOOL (Students: 103, Location: 2300 E WILSHIRE RD, Grades: PK-8)
Library in Springfield:
User-submitted facts and corrections:
- New zip codes added: 62711 and 62712 effective 6-26-04. added by Oddgirl
- Doctor\'s Hospital has closed.
added by Donna Romine
- Private High School: Sacred-Heart Griffin High School
- Sacred Heart Griffin High School (Students: 785; Location: 1200 W Washington St.; Grades: 9 - 12)
- Doctor's Hospital has closed.
- There is another Private High School in Springfield. Sacred Heart-Griffin with 782 Students. Location is 1200 West Washington St. 62702
Points of interest:
Notable locations in Springfield: Thomas Rees Memorial Carillon (A), Sanger (B), Lincoln Memorial Gardens (C), Camp Lincoln (D), Lincoln Greens Golf Course (E), Illini Country Club (F), Route 66 Drive-In (G), Abraham Lincoln Presidential Library and Museum (H), Lincolns Home (I), Old State Capitol (J), Springfield Theatre Center (K), Myers Building (L), Ridgely Building (M), Illinois Building (N), Springfield Area Ambulance (O), LifeStar Ambulance Service (P), America Ambulance (Q), Lincoln Prairie Behavioral Health Center (R), Prairie Heart Institute (S), Illinois National Guard 183rd Tactical Fire Department (T). Display/hide their locations on the map
Shopping Centers: White Oaks Plaza Shopping Center (1), White Oaks Mall Shopping Center (2), Southwest Plaza Shopping Center (3), Sangamon Shopping Center (4), Laketown Shopping Center (5), Fairhills Shopping Center (6), Capital City Shopping Center (7), Chatham Square Shopping Center (8). Display/hide their locations on the map
Main business address in Springfield include: CENTRAL ILLINOIS PUBLIC SERVICE CO (A), HORACE MANN EDUCATORS CORP /DE/ (B). Display/hide their locations on the map
Churches in Springfield include: Christ Episcopal Church (A), First Presbyterian Church (B), Trinity Lutheran Church (C), Kumler United Methodist Church (D), Wesley United Methodist Church (E), Woodside United Methodist Church (F), Laurel United Methodist Church (G), Asbury United Methodist Church (H), Grace United Methodist Church (I). Display/hide their locations on the map
Cemeteries: Lincoln Tomb (1), Newcomer Cemetery (2), Crowder Cemetery (3), Bridges Cemetery (4), Oak Ridge Cemetery (5), Smith Cemetery (6), Harmony Cemetery (7). Display/hide their locations on the map
Reservoir: Lake Springfield (A). Display/hide its location on the map
Creeks: Lick Creek (A), Polecat Creek (B), Spring Creek (C). Display/hide their locations on the map
Parks in Springfield include: Pasfield Park (1), Riverside Park (2), Gurgens Park (3), Forest Park (4), Carpenter Park Nature Preserve (5), Bergen Park (6), Bunn Park (7), Carpenter Park (8), Center Park (9). Display/hide their locations on the map
Tourist attractions: All Metro Home Inspections (Museums; 127 South Grand Avenue West) (1), Grand Army Museum (Cultural Attractions- Events- & Facilities; 629 South 7th Street) (2), Capitol Coral (Aquariums; 539 West Elliott) (3), Springfield Park District (Botanical Gardens; Botanical Gardens) (4), Knight's Action Park (Water Parks & Slides; 1700 Recreation Drive) (5), Adams Wild Life Sanctuary (Recreation Areas; 2315 East Clear Lake Avenue) (6), Aladdins Castle (Amusement & Theme Parks; 162 White Oaks Mall) (7), Bentler CHAS (Amusement & Theme Parks; 1644 West Homewood Avenue) (8), Adventure Village Inc (Amusement & Theme Parks; 1101 East Sangamon Avenue) (9). Display/hide their approximate locations on the map
Hotels: Cottage Inn (927 North Macarthur Boulevard) (1), Courtyard Springfield (IL) (3462 Freedom Drive) (2), Drury Inn and Suites Springfield IL (3180 South Dirksen Parkway) (3), Best Inns of America (500 North 1st Street) (4), Holiday Inn Express (3050 South Dirksen Parkway) (5), Hampton Inn & Suites Springfield-Southwe (2300 Chuckwagon Drive) (6), Crowne Plaza Springfield (3000 South Dirksen Parkway) (7), Best Rest Inn (700 North Dirksen Parkway) (8), Best Western (3440 East Clear Lake Avenue) (9). Display/hide their approximate locations on the map
Courts: Illinois State - Courts- Administrative Office- Judicial Education (3101 Old Jacksonville Road) (1), Illinois State - Director- Courts- Administrative Office- Judicial Management Information Sys (840 South Spring Street) (2), Sangamon County - Receptionist-7th Flr- Circuit Court- Circuit Court Ju (200 South 9th Street Suite 204) (3), United States Government - U S Courts- Clerk US District Court (600 East Monroe Street) (4), Illinois State - Courts- Administrative Office- Judicial Management Information Serv (3101 Old Jacksonville Road) (5), Sangamon County - Receptionist-5th Flr- Circuit Court- Associate Circuit Court Ju (200 South 9th Street Suite 204) (6), Congress - Representative- Lahood Ray- Springfield District Office (3050 Montvale Drive) (7), Illinois State - Courts- Supreme Court- Clerk Supreme Court Bldg (Supreme Court Building) (8), Sangamon County - Circuit Court- Receptionist-6th Flr (200 South 9th Street Suite 204) (9). Display/hide their approximate locations on the map
Birthplace of: Brendon Small - Writer, Robin Roberts (baseball) - Baseball player and coach, Robert Todd Lincoln - (1843-1926), lawyer, statesman, Billy Rogell - Baseball player, Harlington Wood, Jr. - Judge, Julius Rosenwald - Businessman, Andre Iguodala - NBA player (Philadelphia 76ers, born: Jan 28, 1984), Rose Folder - Girls Professional Baseball League player, Justin Knoedler - 2005 Major League Baseball player (San Francisco Giants, born: Jul 17, 1980), Betty Wanless - Girls Professional Baseball League player.
Drinking water stations with addresses in Springfield and their reported violations in the past:
CURRAN-GARDNER TOWNSHIP PWD (Population served: 5,725, Groundwater):Past health violations:KAP WATERSLIDE 16700072 (Population served: 800, Groundwater):
- MCL, Monthly (TCR) - In JUN-2008, Contaminant: Coliform. Follow-up actions: St Public Notif requested (JUL-17-2008), St Violation/Reminder Notice (JUL-17-2008), St Public Notif received (AUG-01-2008), St Compliance achieved (JAN-01-2009)
Past monitoring violations:KAP LADIES RR 16700288 (Population served: 500, Groundwater):
- 2 regular monitoring violations
Past monitoring violations:KAP GIFT SHOP/CONCESSION 16700080 (Population served: 500, Groundwater):
- 2 regular monitoring violations
Past monitoring violations:KAP DRIVE IN 16700304 (Population served: 500, Groundwater):
- 2 regular monitoring violations
Past monitoring violations:KAP RIVER BATH 16700270 (Population served: 500, Groundwater):
- One minor monitoring violation
- One regular monitoring violation
Past monitoring violations:KAP MAIN BLDG 16700098 (Population served: 500, Groundwater):
- 2 regular monitoring violations
Past monitoring violations:KAP TRADEWINDS 16700262 (Population served: 25, Groundwater):
- 2 regular monitoring violations
Past monitoring violations:
- 2 regular monitoring violations
Drinking water stations with addresses in Springfield that have no violations reported:
- KAP WAVEPOOL FILTRATION (Population served: 500, Primary Water Source Type: Groundwater)
- KAP MENS RR 16700296 (Population served: 500, Primary Water Source Type: Groundwater)
- KAP LAZY RIVER FILT RATION (Population served: 500, Primary Water Source Type: Groundwater)
- EDGEWOOD MOBILE HOME COURT (MHC) (Population served: 120, Primary Water Source Type: Purch surface water)
- THE GYM OF SPRINGFIELD (Population served: 100, Primary Water Source Type: Groundwater)
- SPARTAN SPORTS PARK (Population served: 25, Primary Water Source Type: Groundwater)
| This city: | 2.2 people |
| Illinois: | 2.6 people |
| This city: | 56.2% |
| Whole state: | 65.8% |
| This city: | 7.8% |
| Whole state: | 6.3% |
Likely homosexual households (counted as self-reported same-sex unmarried-partner households)
- Lesbian couples: 0.4% of all households
- Gay men: 0.3% of all households
People in group quarters in Springfield in 2010:
- 1,081 people in college/university student housing
- 831 people in nursing facilities/skilled-nursing facilities
- 340 people in other noninstitutional facilities
- 295 people in local jails and other municipal confinement facilities
- 199 people in emergency and transitional shelters (with sleeping facilities) for people experiencing homelessness
- 153 people in residential treatment centers for juveniles (non-correctional)
- 146 people in residential treatment centers for adults
- 139 people in group homes intended for adults
- 105 people in mental (psychiatric) hospitals and psychiatric units in other hospitals
- 39 people in group homes for juveniles (non-correctional)
- 30 people in in-patient hospice facilities
- 21 people in correctional facilities intended for juveniles
- 15 people in correctional residential facilities
- 2 people in workers' group living quarters and job corps centers
People in group quarters in Springfield in 2000:
- 1,035 people in nursing homes
- 454 people in other noninstitutional group quarters
- 269 people in local jails and other confinement facilities (including police lockups)
- 239 people in college dormitories (includes college quarters off campus)
- 133 people in religious group quarters
- 98 people in mental (psychiatric) hospitals or wards
- 83 people in homes or halfway houses for drug/alcohol abuse
- 71 people in state prisons
- 58 people in homes for the mentally retarded
- 37 people in homes for the mentally ill
- 29 people in schools, hospitals, or wards for the intellectually disabled
- 25 people in other nonhousehold living situations
- 12 people in other group homes
- 10 people in hospitals/wards and hospices for chronically ill
- 10 people in other hospitals or wards for chronically ill
- 3 people in orthopedic wards and institutions for the physically handicapped
Banks with most branches in Springfield (2011 data):
- PNC Bank, National Association: 7 branches. Info updated 2012/03/20: Bank assets: $263,309.6 mil, Deposits: $197,343.0 mil, headquarters in Wilmington, DE, positive income, Commercial Lending Specialization, 3085 total offices, Holding Company: Pnc Financial Services Group, Inc., The
- Marine Bank: 7 branches. Info updated 2011/11/30: Bank assets: $600.4 mil, Deposits: $516.0 mil, local headquarters, positive income, Commercial Lending Specialization, 10 total offices, Holding Company: Marine Bancorp, Inc.
- Illinois National Bank: Seasons Pine Creek Living Center Bra, at 322 East Capitol Street, Montvale Branch, South Sixth Street Branch, West Wabash Branch, North Dirksen Parkway Branch. Info updated 2008/03/27: Bank assets: $549.0 mil, Deposits: $492.6 mil, local headquarters, positive income, Commercial Lending Specialization, 12 total offices, Holding Company: Illinois National Bancorp, Inc.
- JPMorgan Chase Bank, National Association: Springfield Main Branch, Springfield West Branch, East Branch, North Bank Branch. Info updated 2011/11/10: Bank assets: $1,811,678.0 mil, Deposits: $1,190,738.0 mil, headquarters in Columbus, OH, positive income, International Specialization, 5577 total offices, Holding Company: Jpmorgan Chase & Co.
- U.S. Bank National Association: Land Of Lincoln Branch, Sixth Street Branch, Southwest Branch, Springfield Branch. Info updated 2012/01/30: Bank assets: $330,470.8 mil, Deposits: $236,091.5 mil, headquarters in Cincinnati, OH, positive income, 3121 total offices, Holding Company: U.S. Bancorp
- Security Bank, s.b.: 2500 Stevenson Drive Branch, South Grand Branch, 3001 Chatham Road Branch, Security Bank, S.B.. Info updated 2006/11/03: Bank assets: $155.1 mil, Deposits: $139.7 mil, local headquarters, positive income, Commercial Lending Specialization, 4 total offices
- Illini Bank: Northender Money Center Facility, at 3200 West Iles Avenue, Jefferson Street Branch, Chatham Road Facility. Info updated 2006/11/03: Bank assets: $257.1 mil, Deposits: $215.6 mil, local headquarters, positive income, Commercial Lending Specialization, 12 total offices, Holding Company: Illini Corporation
- Town And Country Bank: Dirksen Parkway Branch, Landing Branch, White Oaks Mall Branch, at 1925 South Macarthur Boulevard. Info updated 2011/06/24: Bank assets: $289.7 mil, Deposits: $237.2 mil, local headquarters, positive income, Commercial Lending Specialization, 7 total offices, Holding Company: Town And Country Financial Corporation
- United Community Bank: Bruns Lane Branch, Springfield Montvale Plaza Branch, Stevenson Drive Branch. Info updated 2011/05/20: Bank assets: $954.7 mil, Deposits: $737.5 mil, headquarters in Chatham, IL, positive income, Commercial Lending Specialization, 18 total offices, Holding Company: United Community Bancorp, Inc.
- 13 other banks with 19 local branches
For population 15 years and over in Springfield:
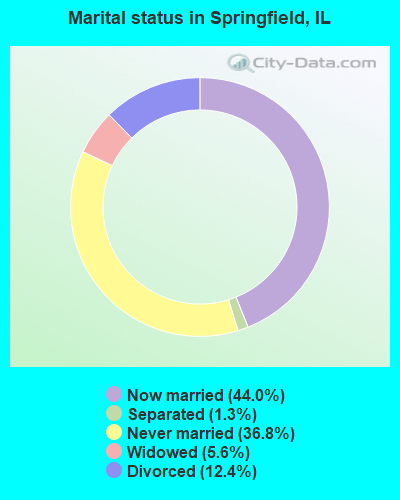
- Never married: 36.8%
- Now married: 44.0%
- Separated: 1.3%
- Widowed: 5.6%
- Divorced: 12.4%
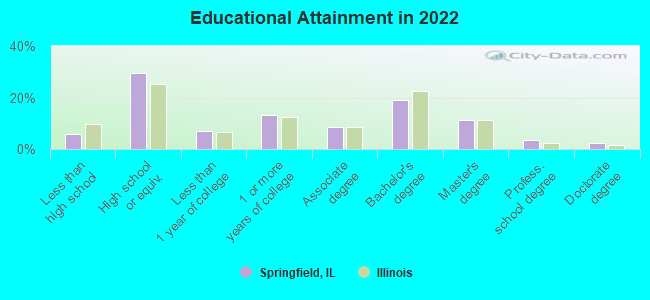
For population 25 years and over in Springfield:
- High school or higher: 94.0%
- Bachelor's degree or higher: 36.1%
- Graduate or professional degree: 16.9%
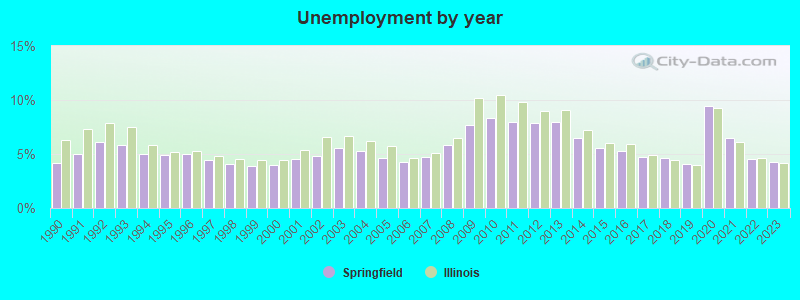
- Unemployed: 4.9%
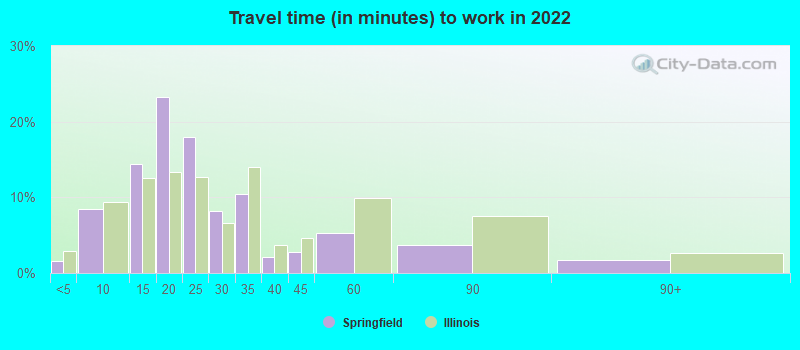
- Mean travel time to work (commute): 14.9 minutes
| Here: | 11.3 |
| Illinois average: | 12.5 |
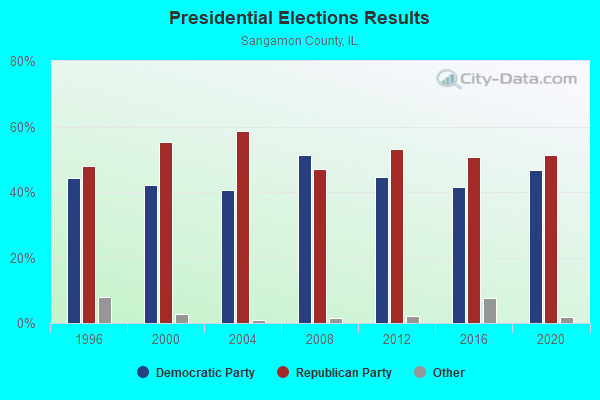
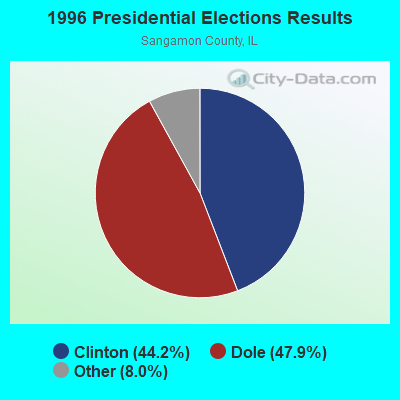
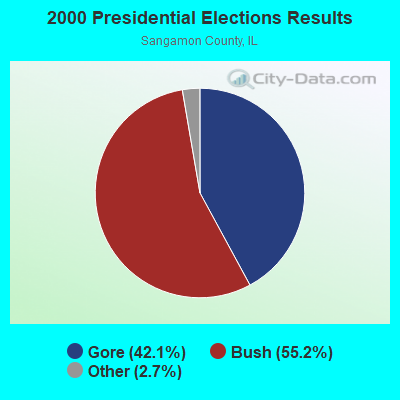
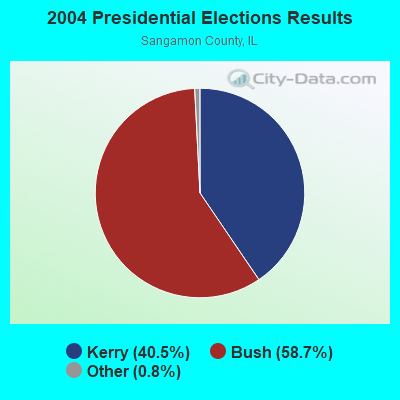
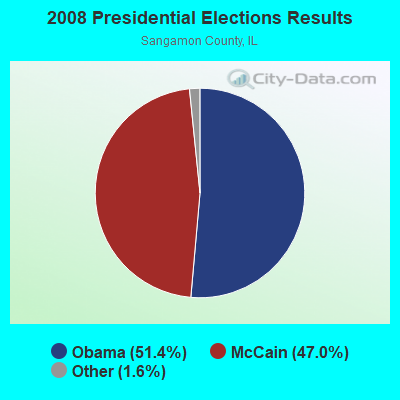
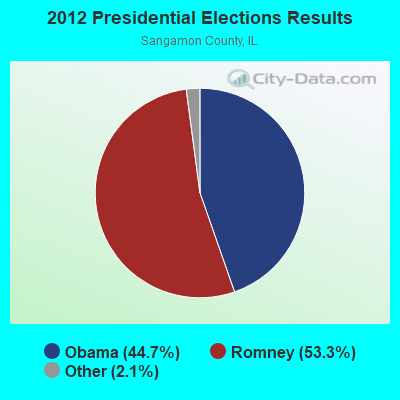
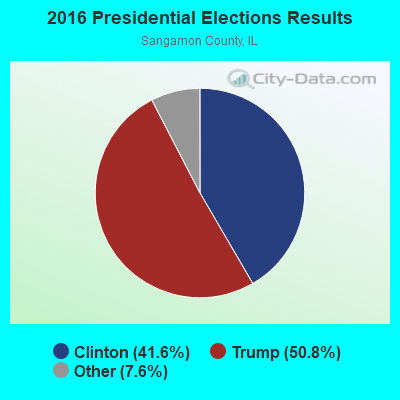
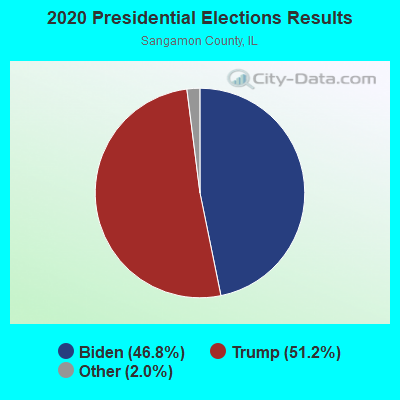
Graphs represent county-level data. Detailed 2008 Election Results
Religion statistics for Springfield, IL (based on Sangamon County data)
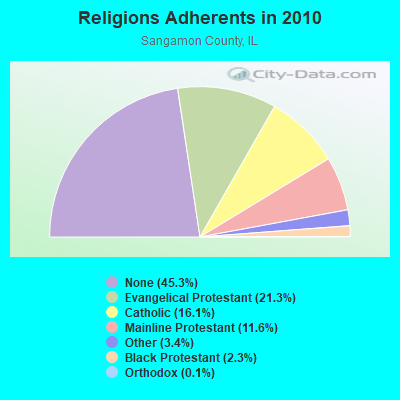
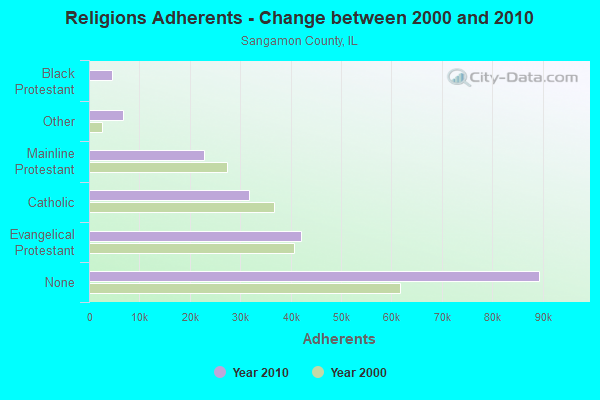
| Religion | Adherents | Congregations |
|---|---|---|
| Evangelical Protestant | 42,075 | 115 |
| Catholic | 31,734 | 16 |
| Mainline Protestant | 22,811 | 61 |
| Other | 6,663 | 19 |
| Black Protestant | 4,513 | 13 |
| Orthodox | 280 | 1 |
| None | 89,389 | - |
Food Environment Statistics:
| This county: | 1.44 / 10,000 pop. |
| Illinois: | 2.24 / 10,000 pop. |
| Sangamon County: | 0.15 / 10,000 pop. |
| Illinois: | 0.08 / 10,000 pop. |
| Here: | 0.26 / 10,000 pop. |
| Illinois: | 0.75 / 10,000 pop. |
| Here: | 3.46 / 10,000 pop. |
| Illinois: | 2.61 / 10,000 pop. |
| This county: | 8.05 / 10,000 pop. |
| State: | 6.86 / 10,000 pop. |
| Here: | 9.8% |
| Illinois: | 8.3% |
| This county: | 27.9% |
| Illinois: | 25.2% |
| This county: | 13.0% |
| Illinois: | 14.5% |
Health and Nutrition:
| This city: | 51.7% |
| Illinois: | 49.5% |
| Springfield: | 50.0% |
| Illinois: | 47.2% |
| Springfield: | 28.8 |
| Illinois: | 28.6 |
| Springfield: | 20.0% |
| Illinois: | 20.5% |
| Springfield: | 10.0% |
| Illinois: | 10.8% |
| Here: | 6.8 |
| Illinois: | 6.8 |
| This city: | 34.6% |
| State: | 33.4% |
| Springfield: | 58.4% |
| Illinois: | 56.4% |
| This city: | 79.9% |
| Illinois: | 79.9% |
More about Health and Nutrition of Springfield, IL Residents
| Local government employment and payroll (March 2022) | |||||
| Function | Full-time employees | Monthly full-time payroll | Average yearly full-time wage | Part-time employees | Monthly part-time payroll |
|---|---|---|---|---|---|
| Electric Power | 531 | $4,103,729 | $92,740 | 0 | $0 |
| Police Protection - Officers | 234 | $1,876,549 | $96,233 | 0 | $0 |
| Firefighters | 207 | $1,684,987 | $97,680 | 0 | $0 |
| Streets and Highways | 137 | $861,420 | $75,453 | 0 | $0 |
| Water Supply | 94 | $724,188 | $92,450 | 0 | $0 |
| Local Libraries | 37 | $180,955 | $58,688 | 0 | $0 |
| Other Government Administration | 32 | $172,059 | $64,522 | 0 | $0 |
| Financial Administration | 30 | $176,368 | $70,547 | 0 | $0 |
| Police - Other | 29 | $136,622 | $56,533 | 0 | $0 |
| Judicial and Legal | 17 | $96,656 | $68,228 | 0 | $0 |
| Housing and Community Development (Local) | 16 | $145,643 | $109,232 | 0 | $0 |
| Fire - Other | 9 | $57,675 | $76,900 | 0 | $0 |
| Solid Waste Management | 1 | $4,349 | $52,188 | 0 | $0 |
| Totals for Government | 1,374 | $10,221,200 | $89,268 | 0 | $0 |
Springfield government finances - Expenditure in 2021 (per resident):
- Construction - Regular Highways: $12,123,000 ($107.02)
General - Other: $11,614,000 ($102.53)
Water Utilities: $10,691,000 ($94.38)
Sewerage: $2,502,000 ($22.09)
Housing and Community Development: $46,000 ($0.41)
- Current Operations - Electric Utilities: $250,375,000 ($2210.37)
Police Protection: $47,906,000 ($422.93)
Local Fire Protection: $41,891,000 ($369.82)
Water Utilities: $24,504,000 ($216.33)
Regular Highways: $12,825,000 ($113.22)
Housing and Community Development: $7,705,000 ($68.02)
Sewerage: $6,474,000 ($57.15)
Central Staff Services: $6,443,000 ($56.88)
Libraries: $3,898,000 ($34.41)
Protective Inspection and Regulation - Other: $2,555,000 ($22.56)
Financial Administration: $2,500,000 ($22.07)
General Public Buildings: $2,378,000 ($20.99)
General - Other: $1,948,000 ($17.20)
Parks and Recreation: $1,625,000 ($14.35)
Miscellaneous Commercial Activities - Other: $902,000 ($7.96)
Parking Facilities: $526,000 ($4.64)
- General - Interest on Debt: $4,214,000 ($37.20)
- Intergovernmental to Local - Other - General - Other: $961,000 ($8.48)
- Other Capital Outlay - Regular Highways: $33,526,000 ($295.98)
General - Other: $11,796,000 ($104.14)
Water Utilities: $3,051,000 ($26.93)
Housing and Community Development: $2,467,000 ($21.78)
Sewerage: $2,467,000 ($21.78)
Police Protection: $1,001,000 ($8.84)
Central Staff Services: $271,000 ($2.39)
Libraries: $260,000 ($2.30)
Local Fire Protection: $78,000 ($0.69)
Parks and Recreation: $17,000 ($0.15)
- Total Salaries and Wages: $63,364,000 ($559.39)
Springfield government finances - Revenue in 2021 (per resident):
- Charges - Other: $11,483,000 ($101.37)
Sewerage: $7,750,000 ($68.42)
Parking Facilities: $241,000 ($2.13)
- Federal Intergovernmental - Highways: $25,524,000 ($225.33)
Public Welfare: $5,575,000 ($49.22)
Housing and Community Development: $1,759,000 ($15.53)
- Local Intergovernmental - Other: $349,000 ($3.08)
- Miscellaneous - General Revenue - Other: $2,469,000 ($21.80)
Interest Earnings: $1,609,000 ($14.20)
Fines and Forfeits: $582,000 ($5.14)
- Revenue - Electric Utilities: $186,176,000 ($1643.60)
Water Utilities: $27,103,000 ($239.27)
- State Intergovernmental - General Local Government Support: $45,314,000 ($400.04)
Highways: $4,165,000 ($36.77)
Other: $1,074,000 ($9.48)
- Tax - Other Selective Sales: $41,562,000 ($366.92)
Property: $28,235,000 ($249.27)
General Sales and Gross Receipts: $13,280,000 ($117.24)
Public Utilities Sales: $2,395,000 ($21.14)
Other License: $636,000 ($5.61)
Springfield government finances - Debt in 2021 (per resident):
- Long Term Debt - Beginning Outstanding - Unspecified Public Purpose: $1,437,419,000 ($12689.86)
Outstanding Unspecified Public Purpose: $1,401,165,000 ($12369.81)
Retired Unspecified Public Purpose: $195,625,000 ($1727.02)
Issue, Unspecified Public Purpose: $159,372,000 ($1406.97)
Beginning Outstanding - Public Debt for Private Purpose: $18,413,000 ($162.55)
Outstanding Nonguaranteed - Industrial Revenue: $17,838,000 ($157.48)
Retired Nonguaranteed - Public Debt for Private Purpose: $575,000 ($5.08)
Springfield government finances - Cash and Securities in 2021 (per resident):
- Other Funds - Cash and Securities: $247,438,000 ($2184.44)
- Sinking Funds - Cash and Securities: $17,838,000 ($157.48)
| Businesses in Springfield, IL | ||||
| Name | Count | Name | Count | |
|---|---|---|---|---|
| AMF Bowling | 2 | La-Z-Boy | 1 | |
| AT&T | 7 | Lane Bryant | 1 | |
| Abercrombie & Fitch | 1 | Lane Furniture | 3 | |
| Abercrombie Kids | 1 | LensCrafters | 1 | |
| Ace Hardware | 2 | Little Caesars Pizza | 3 | |
| Advance Auto Parts | 1 | Long John Silver's | 2 | |
| Aeropostale | 1 | Lowe's | 2 | |
| American Eagle Outfitters | 2 | Macy's | 1 | |
| Applebee's | 2 | Marriott | 2 | |
| Arby's | 6 | MasterBrand Cabinets | 16 | |
| Ascend Collection | 1 | Maurices | 1 | |
| Ashley Furniture | 1 | Mazda | 1 | |
| Audi | 1 | McDonald's | 12 | |
| AutoZone | 4 | Meijer | 1 | |
| BMW | 1 | Men's Wearhouse | 2 | |
| Bakers | 1 | Menards | 1 | |
| Bakers Square | 1 | Microtel | 1 | |
| Barnes & Noble | 1 | Motel 6 | 1 | |
| Baskin-Robbins | 2 | Motherhood Maternity | 3 | |
| Bath & Body Works | 2 | New Balance | 4 | |
| Baymont Inn | 1 | Nike | 13 | |
| Bed Bath & Beyond | 1 | Nissan | 1 | |
| Best Western | 1 | Office Depot | 1 | |
| Budget Car Rental | 1 | OfficeMax | 1 | |
| Buffalo Wild Wings | 2 | Old Navy | 1 | |
| Burger King | 5 | Olive Garden | 1 | |
| Burlington Coat Factory | 1 | Outback | 1 | |
| CVS | 7 | Outback Steakhouse | 1 | |
| Carson Pirie Scott | 1 | Pac Sun | 1 | |
| Casual Male XL | 1 | Panda Express | 1 | |
| Catherines | 1 | Panera Bread | 2 | |
| Charlotte Russe | 1 | Papa John's Pizza | 3 | |
| Chevrolet | 1 | Payless | 2 | |
| Chico's | 1 | Penske | 1 | |
| Chipotle | 1 | PetSmart | 1 | |
| Chuck E. Cheese's | 1 | Pier 1 Imports | 1 | |
| Circle K | 7 | Pizza Hut | 4 | |
| Cold Stone Creamery | 1 | Plato's Closet | 1 | |
| Coldwater Creek | 1 | Popeyes | 2 | |
| Comfort Inn | 1 | Quiznos | 2 | |
| Comfort Suites | 1 | RadioShack | 4 | |
| Cracker Barrel | 1 | Ramada | 2 | |
| Curves | 2 | Red Lobster | 1 | |
| DHL | 1 | Red Roof Inn | 1 | |
| Dairy Queen | 2 | Rue21 | 1 | |
| Days Inn | 1 | Ryan's Grill | 1 | |
| Deb | 1 | Ryder Rental & Truck Leasing | 1 | |
| Decora Cabinetry | 2 | SAS Shoes | 1 | |
| Dennys | 2 | SONIC Drive-In | 3 | |
| Discount Tire | 1 | Sam's Club | 1 | |
| Domino's Pizza | 1 | Sears | 3 | |
| DressBarn | 1 | Shoe Carnival | 1 | |
| Dressbarn | 1 | Sleep Inn | 1 | |
| Dunkin Donuts | 1 | Slumberland | 1 | |
| Express | 1 | Spencer Gifts | 1 | |
| Fashion Bug | 1 | Sprint Nextel | 4 | |
| FedEx | 39 | Staples | 1 | |
| Finish Line | 1 | Starbucks | 6 | |
| Firestone Complete Auto Care | 2 | Steak 'n Shake | 4 | |
| Ford | 2 | Subaru | 1 | |
| GNC | 2 | Subway | 21 | |
| GameStop | 4 | Super 8 | 2 | |
| Gap | 1 | T-Mobile | 8 | |
| Goodwill | 1 | T.G.I. Driday's | 1 | |
| Gymboree | 1 | T.J.Maxx | 1 | |
| H&R Block | 9 | Taco Bell | 4 | |
| Hardee's | 4 | Talbots | 1 | |
| Hilton | 3 | Target | 1 | |
| Hobby Lobby | 1 | The Limited | 1 | |
| Holiday Inn | 4 | Toyota | 1 | |
| Hollister Co. | 1 | Toys"R"Us | 2 | |
| Honda | 1 | Travelodge | 1 | |
| Hot Topic | 1 | True Value | 3 | |
| Howard Johnson | 1 | U-Haul | 7 | |
| Hyundai | 1 | U.S. Cellular | 6 | |
| IHOP | 1 | UPS | 32 | |
| JCPenney | 1 | Vans | 3 | |
| Jimmy John's | 3 | Verizon Wireless | 1 | |
| JoS. A. Bank | 1 | Victoria's Secret | 1 | |
| Jones New York | 3 | Volkswagen | 1 | |
| Journeys | 1 | Walgreens | 13 | |
| Justice | 1 | Walmart | 3 | |
| KFC | 3 | Wendy's | 2 | |
| Kmart | 2 | Wet Seal | 1 | |
| Kohl's | 1 | YMCA | 1 | |
Strongest AM radio stations in Springfield:
- WFMB (1450 AM; 1 kW; SPRINGFIELD, IL; Owner: CAPSTAR TX LIMITED PARTNERSHIP)
- WTAX (1240 AM; 1 kW; SPRINGFIELD, IL; Owner: SAGA COMMUNICATIONS OF ILLINOIS, LLC)
- WMAY (970 AM; 1 kW; SPRINGFIELD, IL)
- KXEN (1010 AM; 50 kW; FESTUS-ST. LOUIS, MO; Owner: BDJ RADIO ENTERPRISES, LLC)
- KMOX (1120 AM; 50 kW; ST. LOUIS, MO; Owner: INFINITY BROADCASTING OPERATIONS, INC.)
- WSCR (670 AM; 50 kW; CHICAGO, IL; Owner: INFINITY BROADCASTING OPERATIONS, INC.)
- WLS (890 AM; 50 kW; CHICAGO, IL; Owner: WLS, INC.)
- WGN (720 AM; 50 kW; CHICAGO, IL; Owner: WGN CONTINENTAL BROADCASTING CO.)
- WBBM (780 AM; 50 kW; CHICAGO, IL; Owner: INFINITY BROADCASTING OPERATIONS, INC.)
- WYLL (1160 AM; 50 kW; CHICAGO, IL; Owner: SCA LICENSE CORPORATION)
- WSDZ (1260 AM; 20 kW; BELLEVILLE, IL)
- WMVP (1000 AM; 50 kW; CHICAGO, IL; Owner: ABC, INC.)
- WTMJ (620 AM; 50 kW; MILWAUKEE, WI; Owner: JOURNAL BROADCAST CORPORATION)
Strongest FM radio stations in Springfield:
- WFMB-FM (104.5 FM; SPRINGFIELD, IL; Owner: CAPSTAR TX LIMITED PARTNERSHIP)
- WDBR (103.7 FM; SPRINGFIELD, IL; Owner: SAGA COMMUNICATIONS OF ILLINOIS, LLC)
- WLUJ (89.7 FM; SPRINGFIELD, IL; Owner: CORNERSTONE COMMUNITY RADIO, INC.)
- WQNA (88.3 FM; SPRINGFIELD, IL; Owner: CAPITAL AREA CAREER CENTER)
- WQQL (101.9 FM; SPRINGFIELD, IL; Owner: SAGA COMMUNICATIONS OF ILLINOIS, LLC)
- WNNS (98.7 FM; SPRINGFIELD, IL; Owner: LONG NINE, INC.)
- WUIS (91.9 FM; SPRINGFIELD, IL; Owner: UNIVERSITY OF IL AT SPRINGFIELD)
- W205BG (88.9 FM; SPRINGFIELD, IL; Owner: COVENANT NETWORK)
- WQLZ (92.7 FM; TAYLORVILLE, IL; Owner: LONG NINE, INC.)
- WYVR (97.7 FM; PETERSBURG, IL; Owner: LONG NINE, INC.)
- WSCT (90.5 FM; SPRINGFIELD, IL; Owner: ILLINOIS BIBLE INSTITUTE)
- WYMG (100.5 FM; JACKSONVILLE, IL; Owner: SAGA COMMUNICATIONS OF ILLINOIS, LLC)
- WLWJ (88.1 FM; PETERSBURG, IL; Owner: CORNERSTONE COMMUNITY RADIO, INC.)
- WCVS-FM (96.7 FM; VIRDEN, IL; Owner: CAPSTAR TX LIMITED PARTNERSHIP)
- WMHX (93.9 FM; LINCOLN, IL; Owner: SAGA COMMUNICATIONS OF ILLINOIS, LLC)
TV broadcast stations around Springfield:
- W08DP (Channel 8; SPRINGFIELD, IL; Owner: W. CENTRAL ILLINOIS EDUC'L TELECOMM. CORPORATION)
- WICS (Channel 20; SPRINGFIELD, IL; Owner: WICS LICENSEE, LLC)
- W33AY (Channel 33; SPRINGFIELD, IL; Owner: VENTANA TELEVISION, INC.)
- WRSP-TV (Channel 55; SPRINGFIELD, IL; Owner: SPRINGFIELD BROADCASTING PARTNERS)
- W28BE (Channel 28; SPRINGFIELD, IL; Owner: THE MARIAN CENTER)
- WCFN (Channel 49; SPRINGFIELD, IL; Owner: NEXSTAR BROADCASTING OF CHAMPAIGN, L.L.C.)
- WSEC (Channel 14; JACKSONVILLE, IL; Owner: WEST CENTRAL ILLINOIS EDUCATIONAL TELECOMMUNICATIONS CORP.)
- WBUI (Channel 23; DECATUR, IL; Owner: ACME TV LICENSES OF ILLINOIS, LLC)
- WAND (Channel 17; DECATUR, IL; Owner: WAND(TV) PARTNERSHIP)
Medal of Honor Recipients
Medal of Honor Recipients born in Springfield: Arthur H. Wilson, Henry C. Courtney, John Hugh Catherwood.
- National Bridge Inventory (NBI) Statistics
- 196Number of bridges
- 2,654ft / 809mTotal length
- $10,364,000Total costs
- 2,701,650Total average daily traffic
- 377,073Total average daily truck traffic
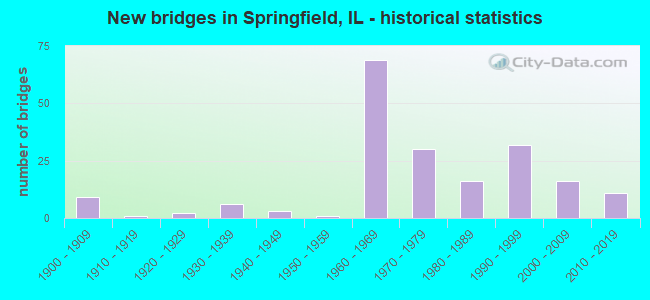
- New bridges - historical statistics
- 91900-1909
- 11910-1919
- 21920-1929
- 61930-1939
- 31940-1949
- 11950-1959
- 691960-1969
- 301970-1979
- 161980-1989
- 321990-1999
- 162000-2009
- 112010-2019
FCC Registered Antenna Towers: 505 (See the full list of FCC Registered Antenna Towers)
FCC Registered Commercial Land Mobile Towers: 12 (See the full list of FCC Registered Commercial Land Mobile Towers in Springfield, IL)
FCC Registered Private Land Mobile Towers: 13 (See the full list of FCC Registered Private Land Mobile Towers)
FCC Registered Broadcast Land Mobile Towers: 146 (See the full list of FCC Registered Broadcast Land Mobile Towers)
FCC Registered Microwave Towers: 195 (See the full list of FCC Registered Microwave Towers in this town)
FCC Registered Paging Towers: 21 (See the full list of FCC Registered Paging Towers)
FCC Registered Maritime Coast & Aviation Ground Towers: 18 (See the full list of FCC Registered Maritime Coast & Aviation Ground Towers)
FCC Registered Amateur Radio Licenses: 641 (See the full list of FCC Registered Amateur Radio Licenses in Springfield)
FAA Registered Aircraft Manufacturers and Dealers: 2 (See the full list of FAA Registered Manufacturers and Dealers in Springfield)
FAA Registered Aircraft: 147 (See the full list of FAA Registered Aircraft)
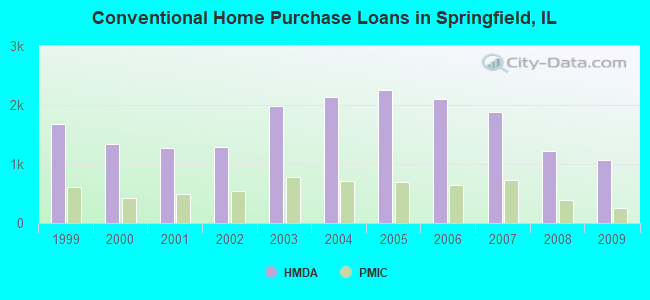
| Home Mortgage Disclosure Act Aggregated Statistics For Year 2009 (Based on 26 full and 15 partial tracts) | ||||||||||||||
| A) FHA, FSA/RHS & VA Home Purchase Loans | B) Conventional Home Purchase Loans | C) Refinancings | D) Home Improvement Loans | E) Loans on Dwellings For 5+ Families | F) Non-occupant Loans on < 5 Family Dwellings (A B C & D) | G) Loans On Manufactured Home Dwelling (A B C & D) | ||||||||
|---|---|---|---|---|---|---|---|---|---|---|---|---|---|---|
| Number | Average Value | Number | Average Value | Number | Average Value | Number | Average Value | Number | Average Value | Number | Average Value | Number | Average Value | |
| LOANS ORIGINATED | 609 | $98,317 | 1,072 | $98,227 | 4,361 | $114,520 | 308 | $45,513 | 18 | $133,837 | 417 | $70,506 | 10 | $71,252 |
| APPLICATIONS APPROVED, NOT ACCEPTED | 20 | $83,404 | 47 | $108,750 | 475 | $112,297 | 28 | $31,950 | 2 | $97,000 | 33 | $85,215 | 4 | $45,290 |
| APPLICATIONS DENIED | 66 | $89,525 | 94 | $68,033 | 602 | $91,950 | 129 | $22,509 | 0 | $0 | 55 | $47,162 | 12 | $31,297 |
| APPLICATIONS WITHDRAWN | 42 | $96,540 | 39 | $99,392 | 412 | $108,196 | 33 | $45,076 | 0 | $0 | 21 | $64,994 | 2 | $111,000 |
| FILES CLOSED FOR INCOMPLETENESS | 9 | $85,212 | 4 | $56,868 | 63 | $114,430 | 1 | $140,250 | 0 | $0 | 2 | $120,050 | 1 | $13,640 |
Detailed mortgage data for all 39 tracts in Springfield, IL
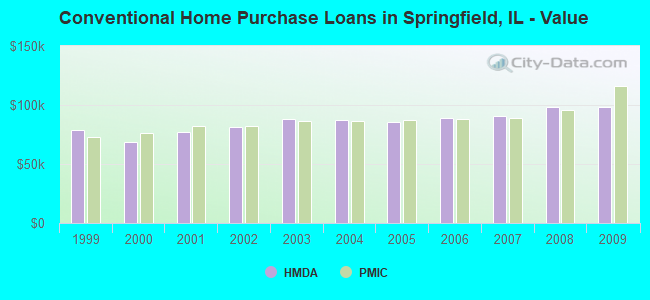
| Private Mortgage Insurance Companies Aggregated Statistics For Year 2009 (Based on 22 full and 15 partial tracts) | ||||||
| A) Conventional Home Purchase Loans | B) Refinancings | C) Non-occupant Loans on < 5 Family Dwellings (A & B) | ||||
|---|---|---|---|---|---|---|
| Number | Average Value | Number | Average Value | Number | Average Value | |
| LOANS ORIGINATED | 252 | $115,887 | 304 | $113,699 | 2 | $125,605 |
| APPLICATIONS APPROVED, NOT ACCEPTED | 36 | $107,967 | 64 | $118,967 | 4 | $38,500 |
| APPLICATIONS DENIED | 15 | $125,603 | 34 | $119,988 | 2 | $97,385 |
| APPLICATIONS WITHDRAWN | 11 | $139,048 | 19 | $100,419 | 1 | $62,460 |
| FILES CLOSED FOR INCOMPLETENESS | 4 | $59,725 | 2 | $98,415 | 1 | $22,840 |
2003 - 2018 National Fire Incident Reporting System (NFIRS) incidents
- Fire incident types reported to NFIRS in Springfield, IL
- 4,58844.6%Outside Fires
- 3,64035.4%Structure Fires
- 1,33913.0%Mobile Property/Vehicle Fires
- 7116.9%Other
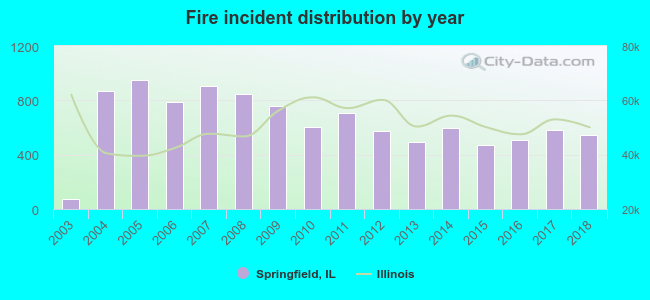 According to the data from the years 2003 - 2018 the average number of fire incidents per year is 642. The highest number of reported fire incidents - 952 took place in 2005, and the least - 75 in 2003. The data has a growing trend.
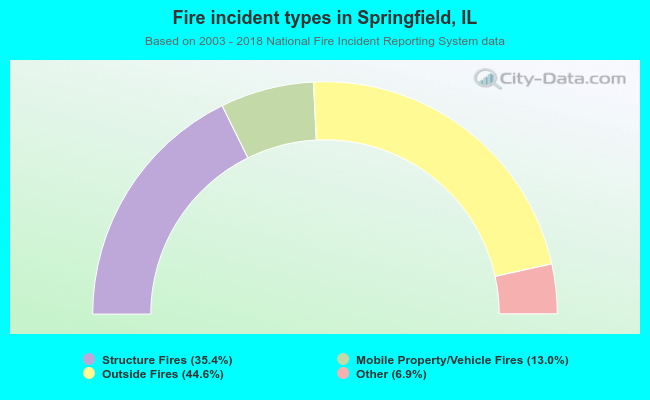 When looking into fire subcategories, the most reports belonged to: Outside Fires (44.6%), and Structure Fires (35.4%).
Fire-safe hotels and motels in Springfield, Illinois:
- Comfort Inn & Suites, 3675 S 6TH St, Springfield, Illinois 62703 , Phone: (217) 529-8898, Fax: (217) 529-1821
- Hilton Hotel Springfield, 700 E Adams St, Springfield, Illinois 62701 , Phone: (217) 789-1530, Fax: (217) 789-0709
- Fairfield Inn Springfield, 3446 Freedom Dr, Springfield, Illinois 62704 , Phone: (217) 793-9277
- Comfort Inn Springfield, 3442 Freedom Dr, Springfield, Illinois 62704 , Phone: (217) 787-2250, Fax: (217) 787-2250
- Motel 6 Springfield, 3125 Wide Track Dr, Springfield, Illinois 62703 , Phone: (217) 789-1063, Fax: (217) 528-7734
- Silver Fountain Inn, 2917 Peoria Rd, Springfield, Illinois 62702 , Phone: (217) 525-9520
- Drury Inn & Suites Springfield IL, 3180 S Dirksen Pkwy, Springfield, Illinois 62703 , Phone: (217) 529-3900
- Courtyard By Marriott Springfield, 3462 Freedom Dr, Springfield, Illinois 62704 , Phone: (217) 793-5300, Fax: (217) 793-5300
- 22 other hotels and motels
| Most common first names in Springfield, IL among deceased individuals | ||
| Name | Count | Lived (average) |
|---|---|---|
| Mary | 1,624 | 78.9 years |
| John | 1,454 | 74.1 years |
| William | 1,204 | 74.4 years |
| James | 943 | 71.1 years |
| Robert | 926 | 70.4 years |
| Charles | 799 | 73.3 years |
| Helen | 737 | 80.4 years |
| George | 656 | 75.5 years |
| Margaret | 573 | 80.9 years |
| Joseph | 535 | 75.4 years |
| Most common last names in Springfield, IL among deceased individuals | ||
| Last name | Count | Lived (average) |
|---|---|---|
| Smith | 513 | 75.3 years |
| Miller | 277 | 75.2 years |
| Johnson | 277 | 72.2 years |
| Brown | 273 | 75.3 years |
| Jones | 269 | 74.2 years |
| Davis | 254 | 74.9 years |
| Williams | 240 | 71.4 years |
| Wilson | 161 | 73.5 years |
| Moore | 157 | 73.1 years |
| White | 151 | 74.3 years |
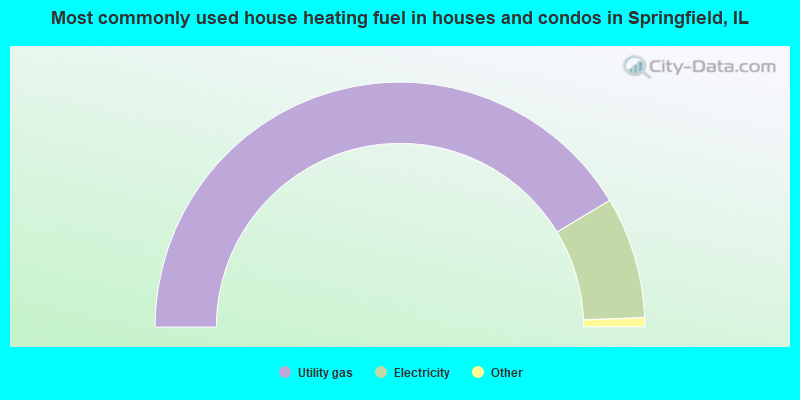
- 82.7%Utility gas
- 16.1%Electricity
- 0.7%Bottled, tank, or LP gas
- 0.2%No fuel used
- 0.1%Other fuel
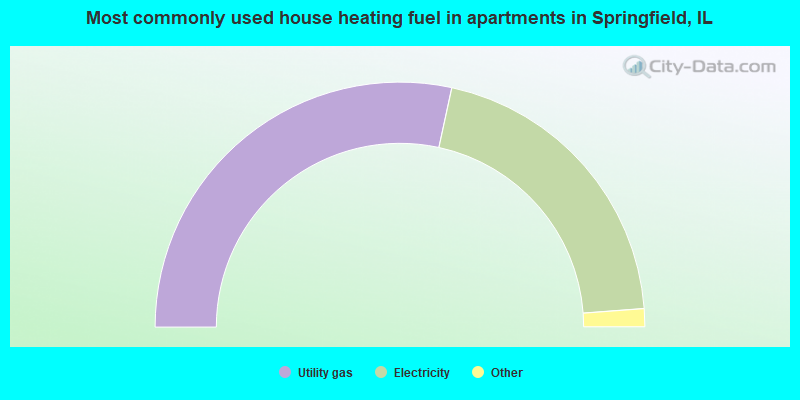
- 56.8%Utility gas
- 40.8%Electricity
- 1.1%No fuel used
- 0.8%Bottled, tank, or LP gas
- 0.2%Other fuel
- 0.1%Solar energy
Springfield compared to Illinois state average:
- Median house value below state average.
- Unemployed percentage significantly below state average.
- Hispanic race population percentage significantly below state average.
- Foreign-born population percentage significantly below state average.
Springfield on our top lists:
- #2 on the list of "Top 101 cities with the largest wind speed differences during a year (population 50,000+)"
- #11 on the list of "Top 101 cities with largest percentage of males in industries: public administration (population 50,000+)"
- #20 on the list of "Top 101 cities with largest percentage of females in industries: public administration (population 50,000+)"
- #22 on the list of "Top 101 cities with largest percentage of males in occupations: law enforcement workers including supervisors (population 50,000+)"
- #28 on the list of "Top 101 cities with the largest percentage of elementary and middle school students in private schools (5,000+ students)"
- #30 on the list of "Top 101 cities with the highest number of thefts per 100,000 residents, excludes tourist destinations and others with a lot of outsiders visiting based on city industries data (population 50,000+)"
- #36 on the list of "Top 100 cities with shortest commuting times (pop. 50,000+)"
- #42 on the list of "Top 101 cities with largest percentage of males in occupations: office and administrative support occupations (population 50,000+)"
- #44 on the list of "Top 101 cities with largest percentage of females in occupations: legal occupations (population 50,000+)"
- #44 on the list of "Top 101 cities with the highest number of assaults per 100,000 residents, excludes tourist destinations and others with a lot of outsiders visiting based on city industries data (population 50,000+)"
- #45 on the list of "Top 101 cities with the largest percentage of high school students in private schools (3,000+ students)"
- #46 on the list of "Top 101 cities with the most people born in the same U.S. state as the city (population 50,000+)"
- #48 on the list of "Top 101 cities with the largest city-data.com crime index decrease from 2011 to 2012 (population 50,000+)"
- #53 on the list of "Top 101 cities with largest percentage of males in occupations: legal occupations (population 50,000+)"
- #53 on the list of "Top 101 cities with the highest number of rapes per 100,000 residents, excludes tourist destinations and others with a lot of outsiders visiting based on city industries data (population 50,000+)"
- #66 on the list of "Top 101 cities with largest percentage of females in occupations: transportation occupations (population 50,000+)"
- #67 on the list of "Top 101 cities with the highest city-data.com crime index, excludes tourist destinations and others with a lot of outsiders visiting based on city industries data (population 50,000+)"
- #70 on the list of "Top 100 cities with the largest percentage of females (pop. 50,000+)"
- #71 on the list of "Top 101 cities with the highest percentage of English-only speaking households, population 50,000+"
- #74 on the list of "Top 101 cities with the highest number of burglaries per 100,000 residents, excludes tourist destinations and others with a lot of outsiders visiting based on city industries data (population 50,000+)"
- #2 on the list of "Top 101 counties with the lowest percentage of residents relocating from foreign countries between 2010 and 2011"
- #45 on the list of "Top 101 counties with the lowest percentage of residents relocating to foreign countries in 2011"
- #97 on the list of "Top 101 counties with the lowest percentage of residents relocating to other counties in 2011 (pop. 50,000+)"

|
|
Total of 342 patent applications in 2008-2024.