Estimated zip code population in 2022: 34,876 Zip code population in 2010: 35,439 Zip code population in 2000: 36,885
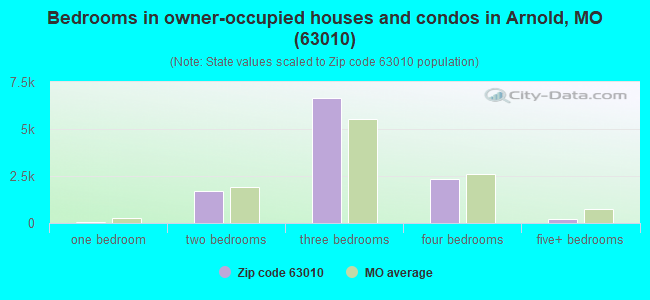
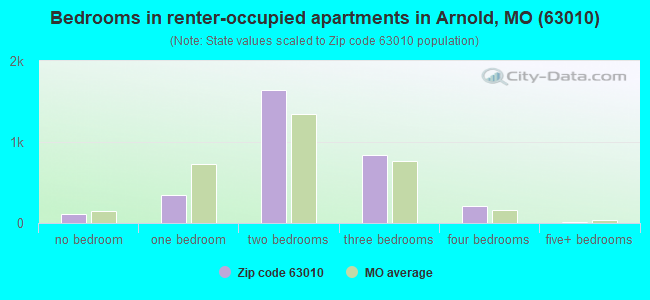
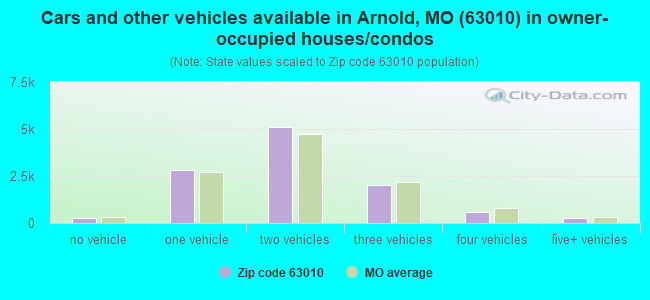
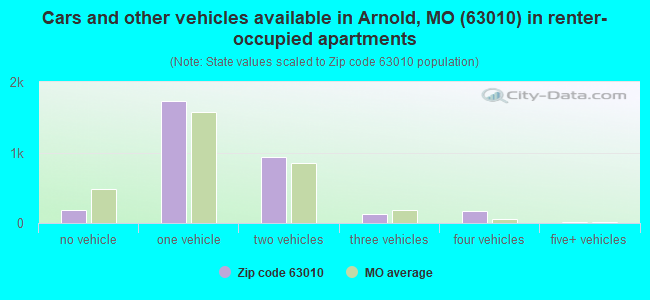
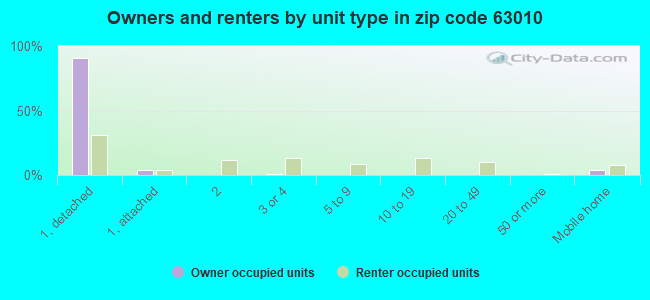
Houses and condos: 14,874 Renter-occupied apartments: 3,158
% of renters here:
22%
State:
32%
March 2022 cost of living index in zip code 63010: 95.5 (near average, U.S. average is 100)
Land area: 21.8 sq. mi. Water area: 0.5 sq. mi.
Population density: 1,603 people per square mile
(low).
OSM Map
General Map
Google Map
MSN Map
OSM Map
General Map
Google Map
MSN Map
OSM Map
General Map
Google Map
MSN Map
OSM Map
General Map
Google Map
MSN Map
Please wait while loading the map...
Real estate property taxes paid for housing units in 2022:
This zip code:
0.8% ($1,703)
Missouri:
0.8% ($1,810)
Median real estate property taxes paid for housing units with mortgages in 2022: $1,751 (0.8%) Median real estate property taxes paid for housing units with no mortgage in 2022: $1,613 (0.8%)
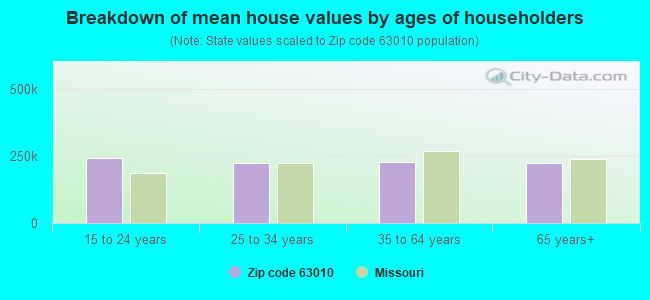
Estimated median house/condo value in 2022: $216,874
63010:
$216,874
Missouri:
$221,200
According to our research of Missouri and other state lists, there were 65 registered sex offenders living in 63010 zip code as of April 27, 2024. The ratio of all residents to sex offenders in zip code 63010 is 564 to 1. The ratio of registered sex offenders to all residents in this zip code is lower than the state average.
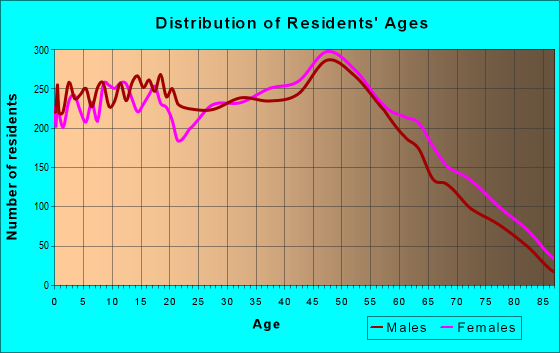
Median resident age:
This zip code:
40.6 years
Missouri median age:
39.1 years
Average household size:
This zip code:
2.4 people
Missouri:
2.4 people
Averages for the 2020 tax year for zip code 63010, filed in 2021:
Average Adjusted Gross Income (AGI) in 2020: $58,915 (Individual Income Tax Returns)
Here:
$58,915
State:
$68,151
Salary/wage: $54,390 (reported on 81.2% of returns)
Here:
$54,390
State:
$56,131
(% of AGI for various income ranges: 1101.3% for AGIs below $25k, 3543.4% for AGIs $25k-50k, 6309.1% for AGIs $50k-75k, 9595.0% for AGIs $75k-100k, 16889.8% for AGIs $100k-200k, 62067.7% for AGIs over 200k)
Taxable interest for individuals: $856 (reported on 30.9% of returns)
This zip code:
$856
Missouri:
$1,586
(% of AGI for various income ranges: 19.1% for AGIs below $25k, 23.3% for AGIs $25k-50k, 36.2% for AGIs $50k-75k, 50.6% for AGIs $75k-100k, 67.0% for AGIs $100k-200k, 469.2% for AGIs over 200k)
Ordinary dividends: $2,796 (reported on 18.5% of returns)
Here:
$2,796
State:
$10,947
(% of AGI for various income ranges: 25.7% for AGIs below $25k, 33.2% for AGIs $25k-50k, 72.5% for AGIs $50k-75k, 92.8% for AGIs $75k-100k, 163.0% for AGIs $100k-200k, 1235.4% for AGIs over 200k)
Net capital gain/loss in AGI: +$6,538 (reported on 14.8% of returns)
Here:
+$6,538
State:
+$18,453
(% of AGI for various income ranges: 11.0% for AGIs below $25k, 26.5% for AGIs $25k-50k, 62.0% for AGIs $50k-75k, 103.6% for AGIs $75k-100k, 299.6% for AGIs $100k-200k, 6522.3% for AGIs over 200k)
Profit/loss from business: +$12,752 (reported on 12.5% of returns)
Here:
+$12,752
State:
+$12,260
(% of AGI for various income ranges: 98.7% for AGIs below $25k, 159.9% for AGIs $25k-50k, 218.5% for AGIs $50k-75k, 327.0% for AGIs $75k-100k, 322.1% for AGIs $100k-200k, 3624.6% for AGIs over 200k)
Taxable individual retirement arrangement distribution: $17,529 (reported on 10.4% of returns)
63010:
$17,529
Missouri:
$19,719
(% of AGI for various income ranges: 78.7% for AGIs below $25k, 134.9% for AGIs $25k-50k, 223.1% for AGIs $50k-75k, 323.8% for AGIs $75k-100k, 700.9% for AGIs $100k-200k, 3302.3% for AGIs over 200k)
Self-employed (Keogh) retirement plans: $21,933 (reported on 0.2% of returns)
63010:
$21,933
Missouri:
$24,851
(% of AGI for various income ranges: 40.1% for AGIs $100k-200k)
Total itemized deductions: $29,080 (reported on 5.3% of returns)
Here:
$29,080
State:
$36,651
(% of AGI for various income ranges: 52.1% for AGIs below $25k, 81.6% for AGIs $25k-50k, 198.2% for AGIs $50k-75k, 288.7% for AGIs $75k-100k, 534.2% for AGIs $100k-200k, 4452.3% for AGIs over 200k)
Charity contributions: $7,550 (reported on 4.1% of returns)
Here:
$7,550
State:
$15,671
(% of AGI for various income ranges: 1.9% for AGIs below $25k, 10.7% for AGIs $25k-50k, 30.5% for AGIs $50k-75k, 45.9% for AGIs $75k-100k, 139.1% for AGIs $100k-200k, 1181.5% for AGIs over 200k)
Taxes paid: $6,769 (reported on 5.2% of returns)
63010:
$6,769
State:
$7,608
(% of AGI for various income ranges: 4.9% for AGIs below $25k, 12.5% for AGIs $25k-50k, 41.0% for AGIs $50k-75k, 78.0% for AGIs $75k-100k, 162.7% for AGIs $100k-200k, 867.7% for AGIs over 200k)
Earned income credit: $2,046 (reported on 12.4% of returns)
Here:
$2,046
State:
$2,315
(% of AGI for various income ranges: 67.2% for AGIs below $25k, 54.8% for AGIs $25k-50k, 1.5% for AGIs $50k-75k)
Percentage of individuals using paid preparers for their 2020 taxes: 91.9%
Here:
92%
State:
93%
(% for various income ranges: 91.1% for AGIs below $25k, 92.4% for AGIs $25k-50k, 93.0% for AGIs $50k-75k, 91.1% for AGIs $75k-100k, 92.3% for AGIs $100k-200k, 92.3% for AGIs over 200k)
Averages for the 2012 tax year for zip code 63010, filed in 2013:
Average Adjusted Gross Income (AGI) in 2012: $48,898 (Individual Income Tax Returns)
Here:
$48,898
State:
$55,896
Salary/wage: $45,068 (reported on 85.1% of returns)
Here:
$45,068
State:
$46,205
(% of AGI for various income ranges: 72.5% for AGIs below $25k, 77.7% for AGIs $25k-50k, 79.4% for AGIs $50k-75k, 83.1% for AGIs $75k-100k, 82.1% for AGIs $100k-200k, 55.9% for AGIs over 200k)
Taxable interest for individuals: $790 (reported on 32.9% of returns)
This zip code:
$790
Missouri:
$1,559
(% of AGI for various income ranges: 1.2% for AGIs below $25k, 0.6% for AGIs $25k-50k, 0.5% for AGIs $50k-75k, 0.4% for AGIs $75k-100k, 0.5% for AGIs $100k-200k, 0.5% for AGIs over 200k)
Ordinary dividends: $2,337 (reported on 19.1% of returns)
Here:
$2,337
State:
$7,410
(% of AGI for various income ranges: 1.2% for AGIs below $25k, 0.8% for AGIs $25k-50k, 0.7% for AGIs $50k-75k, 0.6% for AGIs $75k-100k, 0.8% for AGIs $100k-200k, 3.0% for AGIs over 200k)
Net capital gain/loss in AGI: +$2,754 (reported on 12.9% of returns)
Here:
+$2,754
State:
+$11,579
(% of AGI for various income ranges: 0.2% for AGIs $25k-50k, 0.3% for AGIs $50k-75k, 0.4% for AGIs $75k-100k, 0.7% for AGIs $100k-200k, 5.9% for AGIs over 200k)
Profit/loss from business: +$11,024 (reported on 11.9% of returns)
Here:
+$11,024
State:
+$11,688
(% of AGI for various income ranges: 6.1% for AGIs below $25k, 3.5% for AGIs $25k-50k, 1.8% for AGIs $50k-75k, 1.7% for AGIs $75k-100k, 2.0% for AGIs $100k-200k, 4.0% for AGIs over 200k)
Taxable individual retirement arrangement distribution: $12,665 (reported on 11.0% of returns)
63010:
$12,665
Missouri:
$14,773
(% of AGI for various income ranges: 3.4% for AGIs below $25k, 3.0% for AGIs $25k-50k, 2.6% for AGIs $50k-75k, 2.2% for AGIs $75k-100k, 2.7% for AGIs $100k-200k, 5.0% for AGIs over 200k)
Self-employment retirement plans: $11,967 (reported on 0.2% of returns)
63010:
$11,967
Missouri:
$20,502
Total itemized deductions: $17,653 (21% of AGI, reported on 32.4% of returns)
Here:
$17,653
State:
$22,730
Here:
21.0% of AGI
State:
19.2% of AGI
(% of AGI for various income ranges: 8.0% for AGIs below $25k, 9.7% for AGIs $25k-50k, 11.5% for AGIs $50k-75k, 12.5% for AGIs $75k-100k, 13.8% for AGIs $100k-200k, 12.4% for AGIs over 200k)
Charity contributions: $2,692 (reported on 25.2% of returns)
Here:
$2,692
State:
$4,745
(% of AGI for various income ranges: 0.7% for AGIs below $25k, 0.9% for AGIs $25k-50k, 1.3% for AGIs $50k-75k, 1.4% for AGIs $75k-100k, 1.8% for AGIs $100k-200k, 2.0% for AGIs over 200k)
Taxes paid: $5,845 (reported on 32.3% of returns)
63010:
$5,845
State:
$8,399
(% of AGI for various income ranges: 1.3% for AGIs below $25k, 2.3% for AGIs $25k-50k, 3.2% for AGIs $50k-75k, 4.3% for AGIs $75k-100k, 5.6% for AGIs $100k-200k, 5.6% for AGIs over 200k)
Earned income credit: $2,051 (reported on 15.0% of returns)
Here:
$2,051
State:
$2,288
(% of AGI for various income ranges: 4.9% for AGIs below $25k, 1.0% for AGIs $25k-50k)
Percentage of individuals using paid preparers for their 2012 taxes: 46.8%
Here:
47%
State:
55%
(% for various income ranges: 42.3% for AGIs below $25k, 47.8% for AGIs $25k-50k, 50.7% for AGIs $50k-75k, 49.7% for AGIs $75k-100k, 49.2% for AGIs $100k-200k, 68.8% for AGIs over 200k)
Averages for the 2004 tax year for zip code 63010, filed in 2005:
Average Adjusted Gross Income (AGI) in 2004: $43,192 (Individual Income Tax Returns)
Here:
$43,192
State:
$44,591
Salary/wage: $40,676 (reported on 89.1% of returns)
Here:
$40,676
State:
$38,941
(% of AGI for various income ranges: 91.8% for AGIs below $10k, 76.6% for AGIs $10k-25k, 83.1% for AGIs $25k-50k, 87.1% for AGIs $50k-75k, 89.0% for AGIs $75k-100k, 77.6% for AGIs over 100k)
Taxable interest for individuals: $882 (reported on 44.3% of returns)
This zip code:
$882
Missouri:
$1,801
(% of AGI for various income ranges: 3.5% for AGIs below $10k, 1.8% for AGIs $10k-25k, 1.2% for AGIs $25k-50k, 0.5% for AGIs $50k-75k, 0.7% for AGIs $75k-100k, 0.7% for AGIs over 100k)
Taxable dividends: $1,120 (reported on 22.6% of returns)
Here:
$1,120
State:
$3,677
(% of AGI for various income ranges: 2.1% for AGIs below $10k, 1.0% for AGIs $10k-25k, 0.6% for AGIs $25k-50k, 0.4% for AGIs $50k-75k, 0.4% for AGIs $75k-100k, 0.6% for AGIs over 100k)
Net capital gain/loss: +$3,268 (reported on 14.8% of returns)
Here:
+$3,268
State:
+$8,915
(% of AGI for various income ranges: -0.7% for AGIs below $10k, 0.2% for AGIs $10k-25k, 0.3% for AGIs $25k-50k, 0.3% for AGIs $50k-75k, 0.8% for AGIs $75k-100k, 4.0% for AGIs over 100k)
Profit/loss from business: +$7,774 (reported on 11.5% of returns)
Here:
+$7,774
State:
+$9,793
(% of AGI for various income ranges: 3.7% for AGIs below $10k, 3.9% for AGIs $10k-25k, 2.4% for AGIs $25k-50k, 1.8% for AGIs $50k-75k, 1.2% for AGIs $75k-100k, 2.0% for AGIs over 100k)
IRA payment deduction: $2,943 (reported on 2.2% of returns)
63010:
$2,943
Missouri:
$2,972
(% of AGI for various income ranges: 0.2% for AGIs $10k-25k, 0.2% for AGIs $25k-50k, 0.2% for AGIs $50k-75k, 0.1% for AGIs $75k-100k, 0.1% for AGIs over 100k)
Self-employed pension: $5,386 (reported on 0.3% of returns)
Here:
$5,386
Missouri:
$14,365
Total itemized deductions: $15,488 (22% of AGI, reported on 37.7% of returns)
Here:
$15,488
State:
$18,261
Here:
22.1% of AGI
State:
20.5% of AGI
(% of AGI for various income ranges: 10.3% for AGIs below $10k, 7.7% for AGIs $10k-25k, 11.6% for AGIs $25k-50k, 13.8% for AGIs $50k-75k, 14.6% for AGIs $75k-100k, 16.8% for AGIs over 100k)
Charity contributions deductions: $1,957 (3% of AGI, reported on 33.2% of returns)
Here:
$1,957
State:
$3,665
Here:
2.7% of AGI
State:
3.9% of AGI
(% of AGI for various income ranges: 0.6% for AGIs below $10k, 0.7% for AGIs $10k-25k, 1.2% for AGIs $25k-50k, 1.6% for AGIs $50k-75k, 1.8% for AGIs $75k-100k, 1.8% for AGIs over 100k)
Total tax: $5,016 (reported on 79.8% of returns)
63010:
$5,016
State:
$6,999
(% of AGI for various income ranges: 2.2% for AGIs below $10k, 4.4% for AGIs $10k-25k, 6.9% for AGIs $25k-50k, 8.4% for AGIs $50k-75k, 10.1% for AGIs $75k-100k, 14.7% for AGIs over 100k)
Earned income credit: $1,513 (reported on 10.9% of returns)
Here:
$1,513
State:
$1,728
Percentage of individuals using paid preparers for their 2004 taxes: 52.7%
Here:
53%
State:
62%
(% for various income ranges: 41.5% for AGIs below $10k, 53.6% for AGIs $10k-25k, 55.3% for AGIs $25k-50k, 57.4% for AGIs $50k-75k, 53.4% for AGIs $75k-100k, 54.5% for AGIs over 100k)
Likely homosexual households (counted as self-reported same-sex unmarried-partner households)
Lesbian couples: 0.1% of all households
Gay men: 0.2% of all households
Household received Food Stamps/SNAP in the past 12 months: 789 Household did not receive Food Stamps/SNAP in the past 12 months: 13,448
Women who had a birth in the past 12 months: 331 (235 now married, 94 unmarried) Women who did not have a birth in the past 12 months: 7,812 (3,249 now married, 4,564 unmarried)
Housing units in zip code 63010 with a mortgage: 7,105 (443 second mortgage, 4 home equity loan, 287 both second mortgage and home equity loan) Houses without a mortgage: 207
Median monthly owner costs for units with a mortgage: $1,369 Median monthly owner costs for units without a mortgage: $497
Residents with income below the poverty level in 2022:
This zip code:
7.2%
Whole state:
13.2%
Residents with income below 50% of the poverty level in 2022:
This zip code:
4.0%
Whole state:
6.8%
Median number of rooms in houses and condos:
Here:
6.2
State:
6.4
Median number of rooms in apartments:
Here:
4.3
State:
4.4
Notable locations in this zip code not listed on our city pages
Notable locations in zip code 63010: Flamm City Public Access (A), Rock Community Fire Protection District House 1 Headquarters (B), James J Rickman Auditorium (C), Rock Community Fire Protection District House 5 (D), Rock Community Fire Protection District House 3 (E). Display/hide their locations on the map
Shopping Centers: Richardson Crossing Shopping Center (1), Richardson Square Shopping Center (2), Watertower Place Shopping Center (3), Arnold Crossroads Shopping Center (4), Jefferson County Plaza Shopping Center (5). Display/hide their locations on the map
Churches in zip code 63010 include: Starling Road Church (A), Grace Freewill Church (B), Good Shepard Church (C), Arnold Church (D), Radiant Love Church (E), Lighthouse Church (F), New Hope Church (G). Display/hide their locations on the map
4,548 married couples with children.
1,919 single-parent households (651 men, 1,268 women).
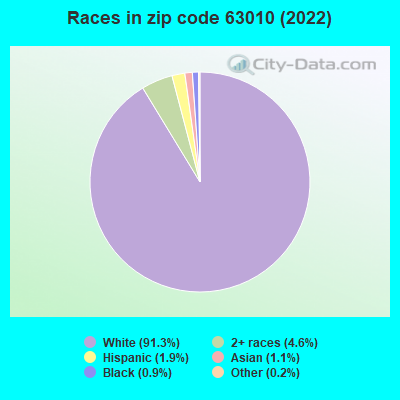
93.0% of residents of 63010 zip code speak English at home.
1.5% of residents speak Spanish at home (57% very well, 15% well, 23% not well, 4% not at all).
4.6% of residents speak other Indo-European language at home (63% very well, 26% well, 10% not well, 1% not at all).
0.9% of residents speak Asian or Pacific Island language at home (45% very well, 55% well).
0.3% of residents speak other language at home (79% very well, 21% well).
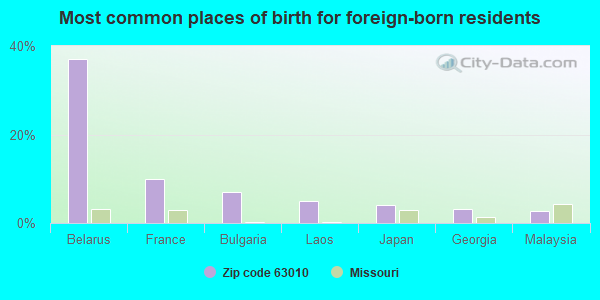
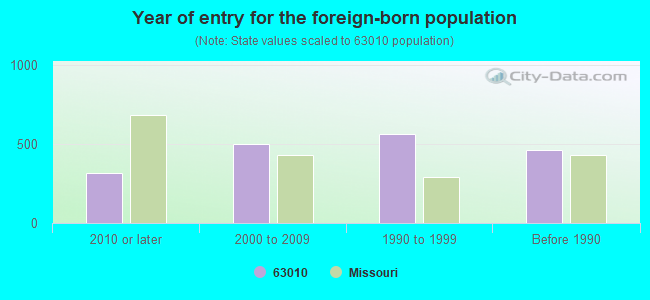
Foreign born population: 1,655 (4.7%) (65.9% of them are naturalized citizens)
This zip code:
4.7%
Whole state:
4.1%
37%Belarus
10%France
7%Bulgaria
5%Laos
4%Japan
3%Georgia
3%Malaysia
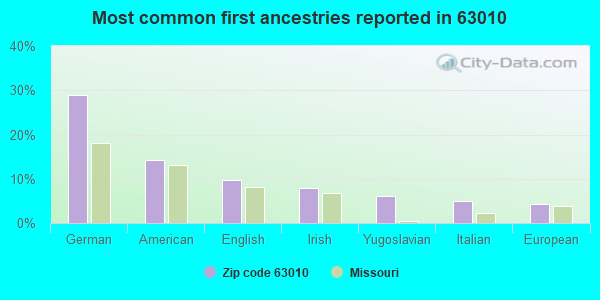
29%German
14%American
10%English
8%Irish
6%Yugoslavian
5%Italian
4%European
Year of entry for the foreign-born population
3152010 or later
4982000 to 2009
5651990 to 1999
463Before 1990
Major facilities with environmental interests located in this zip code:
ACCESS RD TO HWY 141 (HWY 141 2 M NW DOWNTOWN ARNOLD in ARNOLD, MO)
(Integrated Compliance Information System) - ICIS-07-2001-0292, FORMAL ENFORCEMENT ACTION, ICIS-07-1983-0005, STATE MASTER (Missouri monitoring and compilance) - ICIS-34618, ENFORCEMENT/COMPLIANCE ACTIVITY, RCRAINFO-MOR000008292, LQG (Resource Conservation and Recovery Act (tracking hazardous waste)) Business SIC classification: NONCLASSIFIABLE ESTABLISHMENTS Organizations: VALLEY DISPOSAL CO (CONTACT/OWNER)
Alternative names: OLD ACCESS RD TO HWY 141
ARNOLD AUTO REPAIR INCORPORATED (1521 JEFFCO BOULEVARD in ARNOLD, MO)
AIR MINOR (AIRS/AFS) STATE MASTER (Missouri monitoring and compilance) - AIRS/AFS-MO0994482, AIR MINOR (Resource Conservation and Recovery Act (tracking hazardous waste)) Business SIC classification: GENERAL AUTOMOTIVE REPAIR SHOPS Organizations: JOE GANGLOFF (CONTACT/OPERATOR)
AMERICAN CLEANERS (12 ARNOLD PARK MALL in ARNOLD, MO)
AIR MINOR (AIRS/AFS) STATE MASTER (Missouri monitoring and compilance) - AIRS/AFS-MO0953999, AIR MINOR, RCRAINFO-MOD981129166, NOT IN A UNIVERSE, NEI-NTI34404, AIR PROGRAM, NTI-NTI34404, CRITERIA AND HAZARDOUS AIR POLLUTANT INVENTORY (Inventory of air pollution sources) (Resource Conservation and Recovery Act (tracking hazardous waste)) Business SIC classification: DRYCLEANING PLANTS, EXCEPT RUG CLEANING Business NAICS classification: DRYCLEANING AND LAUNDRY SERVICES (EXCEPT COIN-OPERATED). Organizations: JOSEPH MACH (CONTACT/OWNER)
Alternative names: AMERICAN CLEANERS - ARNOLD
FOX ELEMENTARY SCHOOL (739 JEFFCO BOULEVARD in ARNOLD, MO)
STATE MASTER (Missouri monitoring and compilance) - PCS-MOR101761, NPDES NON-MAJOR (National Center for Education Statistics) - STATE ID-4020050012 Business SIC classification: HEAVY CONSTRUCTION Organizations: FOX C-6 (SCHOOL DISTRICT)
GUNTERS SERVICES INCORPORATED (1368 LONEDELL in ARNOLD, MO)
AIR MINOR (AIRS/AFS) STATE MASTER (Missouri monitoring and compilance) - AIRS/AFS-MO0901285, AIR MINOR, RCRAINFO-MOD114219777, SQG Small Quantity Generators, between 100 kg and 1000 kg of hazardous waste/month (Resource Conservation and Recovery Act (tracking hazardous waste)) Business SIC classification: TRUCK AND BUS BODIES; INDUSTRIAL MACHINERY AND EQUIPMENT; GENERAL AUTOMOTIVE REPAIR SHOPS Organizations: MMP BUSINESS ASSOCIATES INC (CONTACT/OPERATOR)
, GARY GUNTER (CONTACT/OWNER)
(Integrated Compliance Information System) - ICIS-07-1982-0009, FORMAL ENFORCEMENT ACTION STATE MASTER (Missouri monitoring and compilance) - ICIS-40284, ENFORCEMENT/COMPLIANCE ACTIVITY Business SIC classification: SEWERAGE SYSTEMS
IMPERIAL UTIL CORP COUNTRY CLU (NE1/4 NE1/4 SEC33 T43N R5E in ARNOLD, MO)
(Integrated Compliance Information System) - ICIS-07-1982-0009, FORMAL ENFORCEMENT ACTION STATE MASTER (Missouri monitoring and compilance) - ICIS-37548, ENFORCEMENT/COMPLIANCE ACTIVITY Business SIC classification: SEWERAGE SYSTEMS
IMPERIAL UTIL CORP GREENWOOD (R6N 742N SEC19 NW1/4 NE1/4 NE in ARNOLD, MO)
(Integrated Compliance Information System) - ICIS-07-1982-0009, FORMAL ENFORCEMENT ACTION STATE MASTER (Missouri monitoring and compilance) - ICIS-40290, ENFORCEMENT/COMPLIANCE ACTIVITY Business SIC classification: SEWERAGE SYSTEMS
(Integrated Compliance Information System) - ICIS-07-1982-0009, FORMAL ENFORCEMENT ACTION STATE MASTER (Missouri monitoring and compilance) - ICIS-40288, ENFORCEMENT/COMPLIANCE ACTIVITY Business SIC classification: SEWERAGE SYSTEMS
(Integrated Compliance Information System) - ICIS-07-1982-0009, FORMAL ENFORCEMENT ACTION STATE MASTER (Missouri monitoring and compilance) - ICIS-40289, ENFORCEMENT/COMPLIANCE ACTIVITY Business SIC classification: SEWERAGE SYSTEMS
IMPERIAL UTIL CORP NEWTOWNE L (R6E SEC8 NE1/4 NE1/4 SW1/4 in ARNOLD, MO)
(Integrated Compliance Information System) - ICIS-07-1982-0009, FORMAL ENFORCEMENT ACTION STATE MASTER (Missouri monitoring and compilance) - ICIS-40287, ENFORCEMENT/COMPLIANCE ACTIVITY Business SIC classification: SEWERAGE SYSTEMS
IMPERIAL UTIL CORP ROCK CREEK (R5E T43N SEC28 SE1/4 NE1/4 SW in ARNOLD, MO)
(Integrated Compliance Information System) - ICIS-07-1982-0009, FORMAL ENFORCEMENT ACTION STATE MASTER (Missouri monitoring and compilance) - ICIS-40286, ENFORCEMENT/COMPLIANCE ACTIVITY Business SIC classification: SEWERAGE SYSTEMS
IMPERIAL UTIL CORP SECKMAN LAG (R5E T42W SEC11 NW1/4 NE1/4 in ARNOLD, MO)
(Integrated Compliance Information System) - ICIS-07-1982-0009, FORMAL ENFORCEMENT ACTION STATE MASTER (Missouri monitoring and compilance) - ICIS-40285, ENFORCEMENT/COMPLIANCE ACTIVITY Business SIC classification: SEWERAGE SYSTEMS
Housing units lacking complete plumbing facilities: 0.9% Housing units lacking complete kitchen facilities: 2.1%
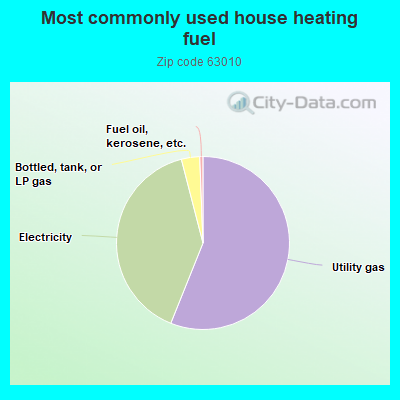
55.8%Utility gas
39.7%Electricity
3.4%Bottled, tank, or LP gas
0.6%Fuel oil, kerosene, etc.
Population in 1990: 29,195. Population change in the 1990s: +7,690 (+26.3%).
Place of birth for U.S.-born residents:
This state: 27,416
Northeast: 561
Midwest: 3,245
South: 1,164
West: 441
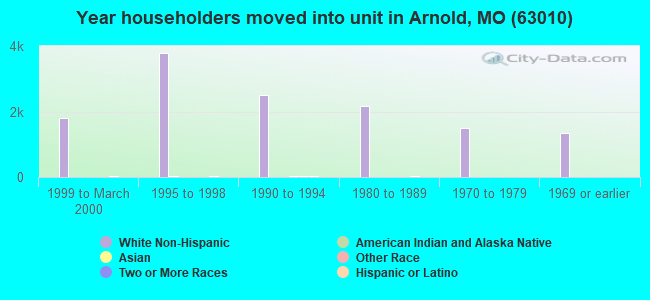
60% of the 63010 zip code residents lived in the same house 5 years ago. Out of people who lived in different houses, 46% lived in this county. Out of people who lived in different counties, 50% lived in Missouri.
93% of the 63010 zip code residents lived in the same house 1 year ago. Out of people who lived in different houses, 25% moved from this county. Out of people who lived in different houses, 69% moved from different county within same state. Out of people who lived in different houses, 6% moved from different state. Out of people who lived in different houses, 4% moved from abroad.
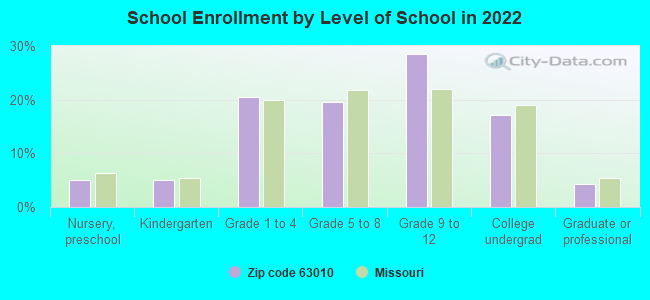
Private vs. public school enrollment:
Students in private schools in grades 1 to 8 (elementary and middle school): 247
Here:
8.6%
Missouri:
15.4%
Students in private schools in grades 9 to 12 (high school): 569
Here:
27.5%
Missouri:
13.9%
Students in private undergraduate colleges: 336
Here:
27.6%
Missouri:
22.6%
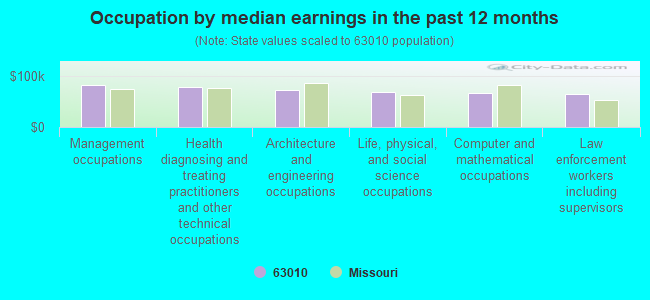
Occupation by median earnings in the past 12 months ($)
81,900Management occupations
78,758Health diagnosing and treating practitioners and other technical occupations
72,531Architecture and engineering occupations
68,527Life, physical, and social science occupations
66,948Computer and mathematical occupations
64,248Law enforcement workers including supervisors
Companies with biggest federal contracts located in this zip code (ARNOLD, MO):
HARVARD INDUSTRIES INC (3000 ARNOLD TENBROOK RD) : $9,805,416 in 12 contractsfrom 1999 to 2005
Contracts for Launchers, Rocket and Pyrotechnic, Pyrotechnics, Switches by Army Signed by year:2000: $75,283; 2001: $0; 2002: $4,921,953; 2003: $2,324,042; 2004: $1,676,430; 2005: $654,494; 2006: $0.
Biggest contracts:
$4,265,250 with Army for Launchers, Rocket and Pyrotechnic. Signed on 2002-07-24. Completion date: 2005-12-31.
$2,307,228, same as above.Signed on 2003-02-18. Completion date: 2005-12-31.
$1,676,430, same as above.Signed on 2004-12-07. Completion date: 2005-12-31.
$521,444, same as above.Signed on 2005-05-26. Completion date: 2006-01-18.
ARNOLD DEFENSE AND ELECTRONICS (3000 ARNOLD TENBROOK RD; small business) : $2,442,337 in 13 contractsfrom 2003 to 2006
Contracts for Launchers, Rocket and Pyrotechnic, Rockets, Rocket Ammunition and Rocket Components, Guided Missile Components by Army, Navy Signed by year:2000: $0; 2001: $0; 2002: $0; 2003: $6,592; 2004: $2,370,745; 2005: $50,000; 2006: $15,000.
Biggest contracts:
$2,185,350 with Army for Launchers, Rocket and Pyrotechnic. Signed on 2004-02-05. Completion date: 2005-12-31.
$154,259 with Navy for Rockets, Rocket Ammunition and Rocket Components. Signed on 2004-04-05. Completion date: 2004-08-27.
$50,000, same as above.Signed on 2005-09-30. Completion date: 2005-12-23.
$15,000 with Navy for Guided Missile Components. Signed on 2006-05-25. Completion date: 2006-08-07.
BARTELS & MISSEY SIDING & INSU (3486 TELEGRAPH RD; small business) : $119,099 in 2 contractsin 2006
$109,167 with Army for Maintenance, Repair and Rebuilding of Equipment -- Electric Wire, and Power and Distribution Equipment. Signed on 2006-05-31. Completion date: 2006-07-30.
$9,932 with Army for Maintenance, Repair or Alteration of Real Property -- Maintenance Buildings. Signed on 2006-02-23. Completion date: 2006-03-25.
BATTALION THREE INC (23 GRANDVIEW PARK DR; small business) : $86,827 in 7 contractsfrom 2003 to 2006
Contracts for Miscellaneous Items, Fire Fighting Equipment, Fire Control Computing Sights and Devices, Clothing, Special Purpose by Army Signed by year:2000: $0; 2001: $0; 2002: $0; 2003: $9,100; 2004: $5,498; 2005: $65,196; 2006: $7,033.
Biggest contracts:
$21,175 with Army for Miscellaneous Items. Signed on 2005-09-23. Completion date: 2005-12-21.
$19,969 with Army for Fire Fighting Equipment. Signed on 2005-06-13. Completion date: 2005-08-12.
$17,512, same as above.Signed on 2005-04-14. Completion date: 2005-06-01.
$9,100 with Army for Fire Control Computing Sights and Devices. Signed on 2003-05-12. Completion date: 2003-06-12.
C L SMITH INDUSTRIAL COMPANY (2972 ARNOLD TENBROOK RD; small business) : $49,950 in 2 contractsfrom 2003 to 2005
$41,950 with Navy for Modification of Equipment -- Miscellaneous. Signed on 2003-01-13. Completion date: 2003-01-31.
$8,000 with Navy for Maintenance, Repair and Rebuilding of Equipment -- Miscellaneous. Signed on 2005-01-28. Completion date: 2005-02-04.
VIDEO ASSISTANCE COMPANY (2130 OLD LEMAY FERRY ROAD; small business) : $43,540 in 2 contractsfrom 2004 to 2005
$35,398 with Air Force for Video Recording and Reproducing Equipment. Signed on 2004-07-23. Completion date: 2005-01-31.
$8,142 with Air Force for ADP Components. Taking place in IL. Signed on 2005-08-30. Completion date: 2005-09-06.
L & M STEAM CLEANING (727 IRENE DRIVE; small business)
$32,693 with Air Force for Maintenance, Repair and Rebuilding of Equipment -- Miscellaneous. Taking place in IL. Signed on 2000-11-21. Completion date: 2001-09-30.
OZ ARC GAS EQUIPMENT & SUPPLY (1909 MEYER-DRURY DRIVE; small business) : $24,570 in 6 contractsfrom 2003 to 2006
Contracts for Chemicals, Chemical Analysis Instruments by Navy Signed by year:2000: $0; 2001: $0; 2002: $0; 2003: $0; 2004: $0; 2005: $17,570; 2006: $7,000.
Biggest contracts:
$8,400 with Navy for Chemicals. Taking place in CT. Signed on 2005-08-22. Completion date: 2005-12-20.
$7,000, same as above.Signed on 2006-03-22. Completion date: 2006-07-22.
$5,670 with Navy for Chemical Analysis Instruments. Taking place in CT. Signed on 2005-04-08. Completion date: 2005-07-05.
$3,500 with Navy for Chemicals. Taking place in CT. Signed on 2005-05-04. Completion date: 2005-09-01.
WILCO DEVELOPMENT & MARKETING (1519 BIG BILL ROAD; small business)
$14,618 with Army for Taps, Dies, and Collets; Hand and Machine. Signed on 2003-02-19. Completion date: 2003-03-01.
ARCHITECTURAL ALUMINUM ERECTOR (3878 W ELM PLACE; small business) : $10,560 in 2 contractsin 2004
$5,280 with U.S. Army Corps of Engineers - civil program financing only for Construction of Structures and Facilities -- Other Administrative Facilities and Service Buildings. Signed on 2004-06-30. Completion date: 2004-07-30.
$5,280 with Army for Construction of Structures and Facilities -- Other Administrative Facilities and Service Buildings. Signed on 2004-06-30. Completion date: 2004-07-30.
Top industries in this zip code by the number of employees in 2005:
Administrative and Support and Waste Management and Remediation Services: Telemarketing Bureaus (over 1000 employees: 1 establishment)
2002 - 2018 National Fire Incident Reporting System (NFIRS) incidents
Based on the data from the years 2002 - 2018 the average number of fire incidents per year is 120. The highest number of reported fire incidents - 208 took place in 2002, and the least - 15 in 2016. The data has a decreasing trend.
When looking into fire subcategories, the most incidents belonged to: Outside Fires (37.9%), and Structure Fires (34.1%).
Fire incident types reported to NFIRS in Zip Code 63010
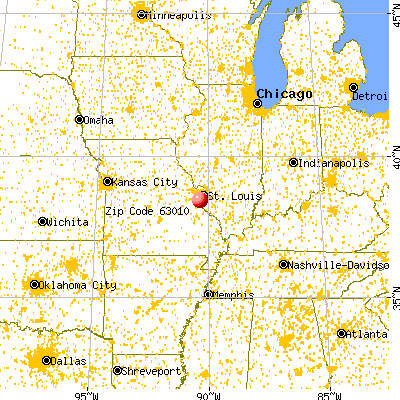


 Nearest zip codes: 63052, 63128, 63053, 63129, 63057, 63026.


 Based on the data from the years 2002 - 2018 the average number of fire incidents per year is 120. The highest number of reported fire incidents - 208 took place in 2002, and the least - 15 in 2016. The data has a decreasing trend.
 When looking into fire subcategories, the most incidents belonged to: Outside Fires (37.9%), and Structure Fires (34.1%).