Estimated zip code population in 2022: 2,036 Zip code population in 2010: 2,076 Zip code population in 2000: 2,201
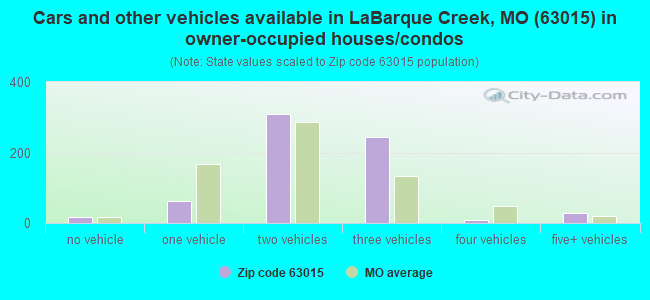
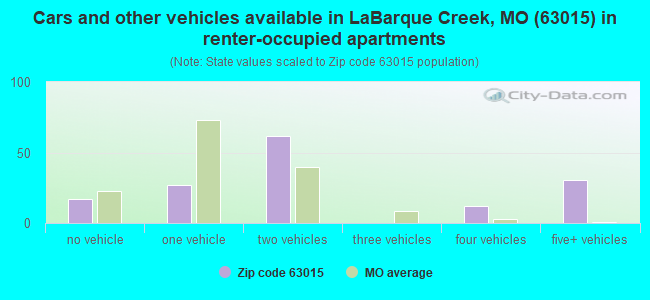
Houses and condos: 850 Renter-occupied apartments: 144
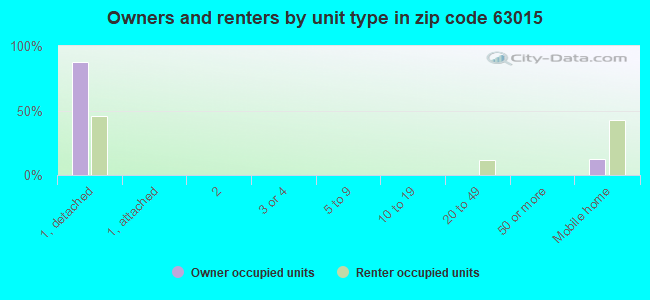
% of renters here:
18%
State:
32%
March 2022 cost of living index in zip code 63015: 85.5 (less than average, U.S. average is 100)
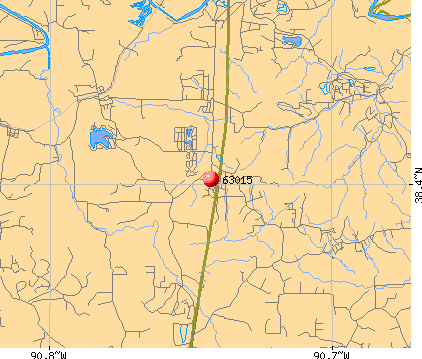
Land area: 16.8 sq. mi. Water area: 0.2 sq. mi.
Population density: 121 people per square mile
(very low).
OSM Map
General Map
Google Map
MSN Map
OSM Map
General Map
Google Map
MSN Map
OSM Map
General Map
Google Map
MSN Map
OSM Map
General Map
Google Map
MSN Map
Please wait while loading the map...
Real estate property taxes paid for housing units in 2022:
This zip code:
0.8% ($1,700)
Missouri:
0.8% ($1,810)
Median real estate property taxes paid for housing units with mortgages in 2022: $1,887 (1.0%) Median real estate property taxes paid for housing units with no mortgage in 2022: $1,450 (0.7%)
Business Search- 14 Million verified businesses
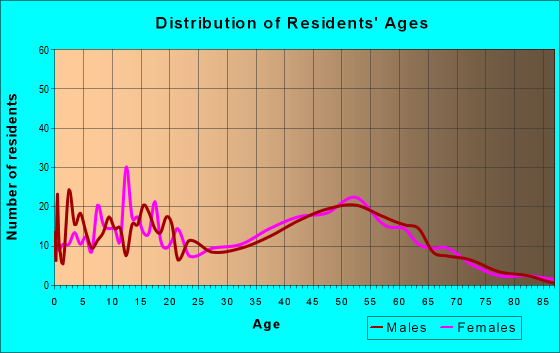
Males: 903
(44.3%)
Females: 1,133
(55.7%)
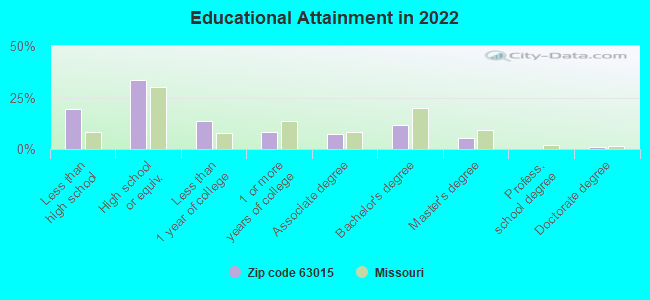
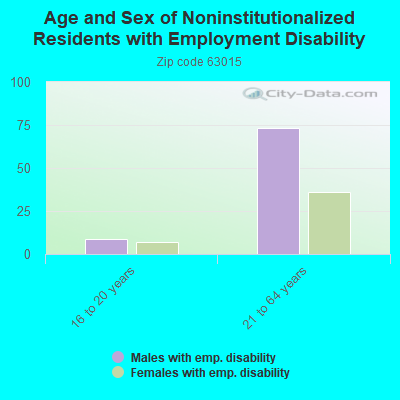
For population 25 years and over in 63015:
High school or higher: 80.4%
Bachelor's degree or higher: 18.0%
Graduate or professional degree: 6.5%
Unemployed: 8.2%
Mean travel time to work (commute): 36.5 minutes
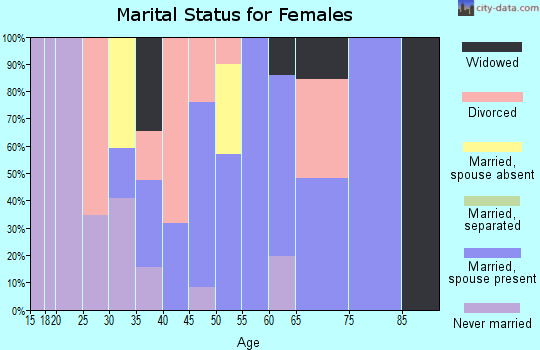
For population 15 years and over in 63015:
Never married: 24.7%
Now married: 57.8%
Separated: 0.8%
Widowed: 3.6%
Divorced: 13.0%
Zip code 63015 compared to state average:
Unemployed percentage above state average.
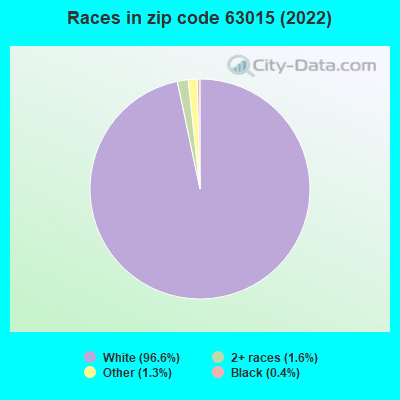
Black race population percentage significantly below state average.
Hispanic race population percentage significantly below state average.
Median age significantly above state average.
Foreign-born population percentage significantly below state average.
Renting percentage below state average.
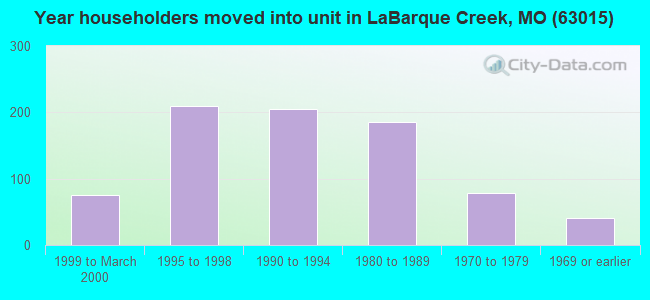
Length of stay since moving in significantly above state average.
Percentage of population with a bachelor's degree or higher below state average.
Averages for the 2020 tax year for zip code 63015, filed in 2021:
Average Adjusted Gross Income (AGI) in 2020: $56,376 (Individual Income Tax Returns)
Here:
$56,376
State:
$68,151
Salary/wage: $51,101 (reported on 81.7% of returns)
Here:
$51,101
State:
$56,131
(% of AGI for various income ranges: 1184.6% for AGIs below $25k, 3354.8% for AGIs $25k-50k, 6819.1% for AGIs $50k-75k, 9172.5% for AGIs $75k-100k, 18256.4% for AGIs $100k-200k)
Taxable interest for individuals: $538 (reported on 31.2% of returns)
This zip code:
$538
Missouri:
$1,586
(% of AGI for various income ranges: 6.2% for AGIs below $25k, 20.9% for AGIs $25k-50k, 21.8% for AGIs $50k-75k, 26.2% for AGIs $75k-100k, 68.2% for AGIs $100k-200k)
Ordinary dividends: $2,957 (reported on 19.3% of returns)
Here:
$2,957
State:
$10,947
(% of AGI for various income ranges: 20.4% for AGIs below $25k, 34.8% for AGIs $25k-50k, 71.8% for AGIs $50k-75k, 65.0% for AGIs $75k-100k, 328.2% for AGIs $100k-200k)
Net capital gain/loss in AGI: +$3,750 (reported on 16.5% of returns)
Here:
+$3,750
State:
+$18,453
(% of AGI for various income ranges: 0.4% for AGIs below $25k, 40.0% for AGIs $25k-50k, 40.9% for AGIs $50k-75k, 42.5% for AGIs $75k-100k, 457.3% for AGIs $100k-200k)
Profit/loss from business: +$7,694 (reported on 15.6% of returns)
Here:
+$7,694
State:
+$12,260
(% of AGI for various income ranges: 146.2% for AGIs below $25k, 80.9% for AGIs $25k-50k, 195.5% for AGIs $50k-75k, 505.5% for AGIs $100k-200k)
Taxable individual retirement arrangement distribution: $11,960 (reported on 9.2% of returns)
63015:
$11,960
Missouri:
$19,719
(% of AGI for various income ranges: 210.0% for AGIs $25k-50k, 891.2% for AGIs $75k-100k)
Total itemized deductions: $23,125 (reported on 3.7% of returns)
Here:
$23,125
State:
$36,651
(% of AGI for various income ranges: 840.9% for AGIs $100k-200k)
Charity contributions: $6,267 (reported on 2.8% of returns)
Here:
$6,267
State:
$15,671
(% of AGI for various income ranges: 235.0% for AGIs $75k-100k)
Taxes paid: $6,800 (reported on 3.7% of returns)
63015:
$6,800
State:
$7,608
(% of AGI for various income ranges: 247.3% for AGIs $100k-200k)
Earned income credit: $2,153 (reported on 13.8% of returns)
Here:
$2,153
State:
$2,315
(% of AGI for various income ranges: 86.7% for AGIs below $25k, 50.0% for AGIs $25k-50k)
Percentage of individuals using paid preparers for their 2020 taxes: 91.7%
Here:
92%
State:
93%
(% for various income ranges: 91.4% for AGIs below $25k, 92.6% for AGIs $25k-50k, 93.8% for AGIs $50k-75k, 90.9% for AGIs $75k-100k, 90.0% for AGIs $100k-200k)
Averages for the 2012 tax year for zip code 63015, filed in 2013:
Average Adjusted Gross Income (AGI) in 2012: $45,771 (Individual Income Tax Returns)
Here:
$45,771
State:
$55,896
Salary/wage: $40,859 (reported on 84.2% of returns)
Here:
$40,859
State:
$46,205
(% of AGI for various income ranges: 73.2% for AGIs below $25k, 74.0% for AGIs $25k-50k, 81.0% for AGIs $50k-75k, 80.2% for AGIs $75k-100k, 69.4% for AGIs $100k-200k)
Taxable interest for individuals: $381 (reported on 31.7% of returns)
This zip code:
$381
Missouri:
$1,559
(% of AGI for various income ranges: 0.5% for AGIs below $25k, 0.4% for AGIs $25k-50k, 0.2% for AGIs $50k-75k, 0.2% for AGIs $75k-100k, 0.2% for AGIs $100k-200k)
Ordinary dividends: $1,831 (reported on 15.8% of returns)
Here:
$1,831
State:
$7,410
(% of AGI for various income ranges: 0.7% for AGIs below $25k, 0.5% for AGIs $25k-50k, 0.8% for AGIs $50k-75k, 0.4% for AGIs $75k-100k, 0.7% for AGIs $100k-200k)
Net capital gain/loss in AGI: +$391 (reported on 10.9% of returns)
Here:
+$391
State:
+$11,579
(% of AGI for various income ranges: 0.3% for AGIs $50k-75k, 0.2% for AGIs $100k-200k)
Profit/loss from business: +$8,276 (reported on 16.8% of returns)
Here:
+$8,276
State:
+$11,688
(% of AGI for various income ranges: 8.8% for AGIs below $25k, 4.1% for AGIs $25k-50k, 1.4% for AGIs $50k-75k, 3.4% for AGIs $100k-200k)
Taxable individual retirement arrangement distribution: $9,878 (reported on 8.9% of returns)
63015:
$9,878
Missouri:
$14,773
(% of AGI for various income ranges: 1.8% for AGIs below $25k, 2.3% for AGIs $25k-50k, 5.8% for AGIs $50k-75k)
Total itemized deductions: $18,368 (23% of AGI, reported on 30.7% of returns)
Here:
$18,368
State:
$22,730
Here:
22.5% of AGI
State:
19.2% of AGI
(% of AGI for various income ranges: 8.9% for AGIs below $25k, 10.8% for AGIs $25k-50k, 11.3% for AGIs $50k-75k, 14.7% for AGIs $75k-100k, 13.8% for AGIs $100k-200k)
Charity contributions: $3,170 (reported on 22.8% of returns)
Here:
$3,170
State:
$4,745
(% of AGI for various income ranges: 1.6% for AGIs $25k-50k, 0.8% for AGIs $50k-75k, 1.9% for AGIs $75k-100k, 2.5% for AGIs $100k-200k)
Taxes paid: $5,939 (reported on 30.7% of returns)
63015:
$5,939
State:
$8,399
(% of AGI for various income ranges: 1.9% for AGIs below $25k, 2.5% for AGIs $25k-50k, 3.3% for AGIs $50k-75k, 4.8% for AGIs $75k-100k, 5.6% for AGIs $100k-200k)
Earned income credit: $1,717 (reported on 17.8% of returns)
Here:
$1,717
State:
$2,288
(% of AGI for various income ranges: 4.7% for AGIs below $25k, 1.0% for AGIs $25k-50k)
Percentage of individuals using paid preparers for their 2012 taxes: 52.5%
Here:
52%
State:
55%
(% for various income ranges: 48.8% for AGIs below $25k, 50.0% for AGIs $25k-50k, 58.8% for AGIs $50k-75k, 55.6% for AGIs $75k-100k, 60.0% for AGIs $100k-200k)
Averages for the 2004 tax year for zip code 63015, filed in 2005:
Average Adjusted Gross Income (AGI) in 2004: $39,886 (Individual Income Tax Returns)
Here:
$39,886
State:
$44,591
Salary/wage: $37,646 (reported on 88.6% of returns)
Here:
$37,646
State:
$38,941
(% of AGI for various income ranges: 131.0% for AGIs below $10k, 77.9% for AGIs $10k-25k, 82.6% for AGIs $25k-50k, 85.9% for AGIs $50k-75k, 91.0% for AGIs $75k-100k, 72.6% for AGIs over 100k)
Taxable interest for individuals: $490 (reported on 43.2% of returns)
This zip code:
$490
Missouri:
$1,801
(% of AGI for various income ranges: 3.6% for AGIs below $10k, 0.6% for AGIs $10k-25k, 0.4% for AGIs $25k-50k, 0.3% for AGIs $50k-75k, 0.5% for AGIs $75k-100k, 0.8% for AGIs over 100k)
Taxable dividends: $1,313 (reported on 21.4% of returns)
Here:
$1,313
State:
$3,677
(% of AGI for various income ranges: 1.4% for AGIs below $10k, 0.6% for AGIs $10k-25k, 0.6% for AGIs $25k-50k, 0.2% for AGIs $50k-75k, 0.6% for AGIs $75k-100k, 1.6% for AGIs over 100k)
Net capital gain/loss: +$6,519 (reported on 13.7% of returns)
Here:
+$6,519
State:
+$8,915
(% of AGI for various income ranges: 0.5% for AGIs $10k-25k, 0.3% for AGIs $25k-50k, 2.2% for AGIs $50k-75k, -0.2% for AGIs $75k-100k, 8.3% for AGIs over 100k)
Profit/loss from business: +$3,604 (reported on 15.9% of returns)
Here:
+$3,604
State:
+$9,793
(% of AGI for various income ranges: -23.8% for AGIs below $10k, 8.7% for AGIs $10k-25k, 1.9% for AGIs $25k-50k, 2.5% for AGIs $50k-75k, -0.4% for AGIs $75k-100k)
IRA payment deduction: $1,154 (reported on 1.4% of returns)
63015:
$1,154
Missouri:
$2,972
Total itemized deductions: $14,814 (22% of AGI, reported on 37.1% of returns)
Here:
$14,814
State:
$18,261
Here:
22.1% of AGI
State:
20.5% of AGI
(% of AGI for various income ranges: 11.3% for AGIs $10k-25k, 13.2% for AGIs $25k-50k, 14.8% for AGIs $50k-75k, 16.0% for AGIs $75k-100k, 13.4% for AGIs over 100k)
Charity contributions deductions: $1,873 (3% of AGI, reported on 31.0% of returns)
Here:
$1,873
State:
$3,665
Here:
2.7% of AGI
State:
3.9% of AGI
(% of AGI for various income ranges: 0.8% for AGIs $10k-25k, 1.1% for AGIs $25k-50k, 1.6% for AGIs $50k-75k, 1.8% for AGIs $75k-100k, 1.8% for AGIs over 100k)
Total tax: $4,724 (reported on 77.8% of returns)
63015:
$4,724
State:
$6,999
(% of AGI for various income ranges: 3.9% for AGIs below $10k, 4.5% for AGIs $10k-25k, 6.5% for AGIs $25k-50k, 7.9% for AGIs $50k-75k, 10.6% for AGIs $75k-100k, 16.1% for AGIs over 100k)
Earned income credit: $1,723 (reported on 13.8% of returns)
Here:
$1,723
State:
$1,728
Percentage of individuals using paid preparers for their 2004 taxes: 60.0%
Here:
60%
State:
62%
(% for various income ranges: 47.2% for AGIs below $10k, 58.0% for AGIs $10k-25k, 65.4% for AGIs $25k-50k, 65.5% for AGIs $50k-75k, 63.3% for AGIs $75k-100k, 68.1% for AGIs over 100k)
Household received Food Stamps/SNAP in the past 12 months: 63 Household did not receive Food Stamps/SNAP in the past 12 months: 754
Women who had a birth in the past 12 months: 16 (15 now married, 0 unmarried) Women who did not have a birth in the past 12 months: 373 (106 now married, 268 unmarried)
Housing units in zip code 63015 with a mortgage: 340 (40 second mortgage, 41 both second mortgage and home equity loan) Median monthly owner costs for units with a mortgage: $1,146 Median monthly owner costs for units without a mortgage: $591
Residents with income below the poverty level in 2022:
This zip code:
11.7%
Whole state:
13.2%
Residents with income below 50% of the poverty level in 2022:
This zip code:
5.1%
Whole state:
6.8%
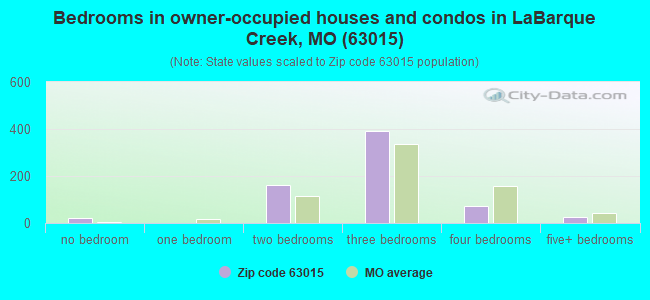
Median number of rooms in houses and condos:
Here:
6.6
State:
6.4
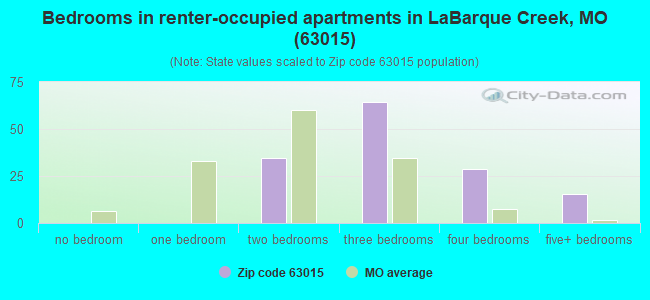
Median number of rooms in apartments:
Here:
6.8
State:
4.4
Notable locations in this zip code not listed on our city pages
Reservoirs: Evergreen Lakes (A), Lake Serene (B), Seyer Lake (C), Von Der Rosa Number 2 Reservoir (D), Lynch Lake (E). Display/hide their locations on the map
Size of family households: 208 2-persons, 219 3-persons, 108 4-persons, 16 5-persons, 16 7-or-more-persons
Size of nonfamily households: 133 1-person, 112 2-persons
148 married couples with children.
90 single-parent households (90 women).
98.7% of residents of 63015 zip code speak English at home.
1.4% of residents speak Spanish at home (100% very well).
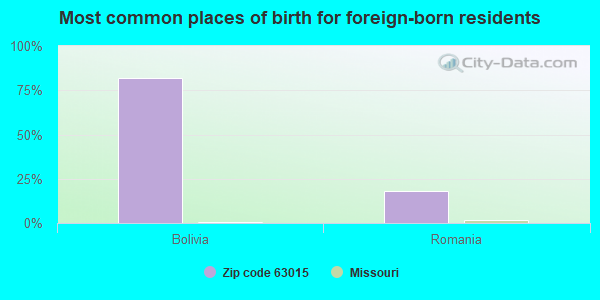
Foreign born population: 22 (1.1%) (30.7% of them are naturalized citizens)
This zip code:
1.1%
Whole state:
4.1%
82%Bolivia
18%Romania
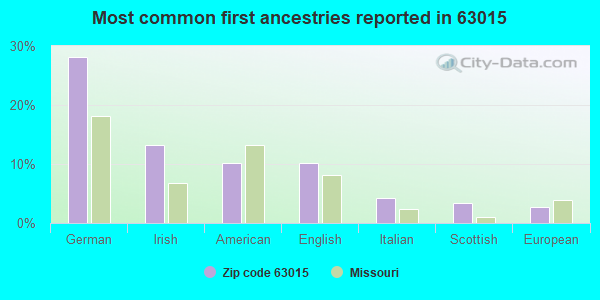
28%German
13%Irish
10%American
10%English
4%Italian
3%Scottish
3%European
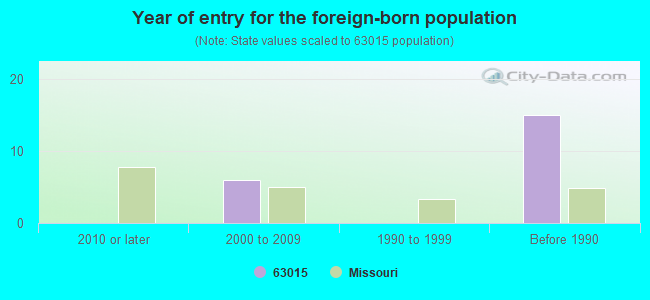
Year of entry for the foreign-born population
02010 or later
62000 to 2009
01990 to 1999
15Before 1990
Public elementary/middle school in in zip code 63015 not listed on the city page:
NIKE ELEM. (Location: 2264 HWY AP, Grades: KG-5)
Facilities with environmental interests located in this zip code:
HOWE OIL (HWY O & HH in CATAWISSA, MO)
STATE MASTER (Missouri monitoring and compilance) - RCRAINFO-MOP000029827, NOT IN A UNIVERSE (Resource Conservation and Recovery Act (tracking hazardous waste))
Housing units lacking complete plumbing facilities: 4.8% Housing units lacking complete kitchen facilities: 4.2%
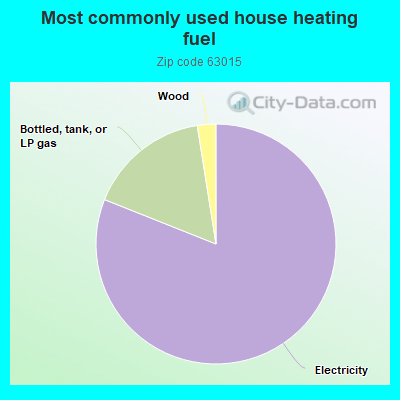
81.2%Electricity
16.5%Bottled, tank, or LP gas
2.5%Wood
Population in 1990: 831. Population change in the 1990s: +1,370 (+164.9%).
Place of birth for U.S.-born residents:
This state: 1,469
Northeast: 70
Midwest: 289
South: 94
West: 89
71% of the 63015 zip code residents lived in the same house 5 years ago. Out of people who lived in different houses, 50% lived in this county. Out of people who lived in different counties, 50% lived in Missouri.
92% of the 63015 zip code residents lived in the same house 1 year ago. Out of people who lived in different houses, 37% moved from this county. Out of people who lived in different houses, 52% moved from different county within same state. Out of people who lived in different houses, 13% moved from different state.
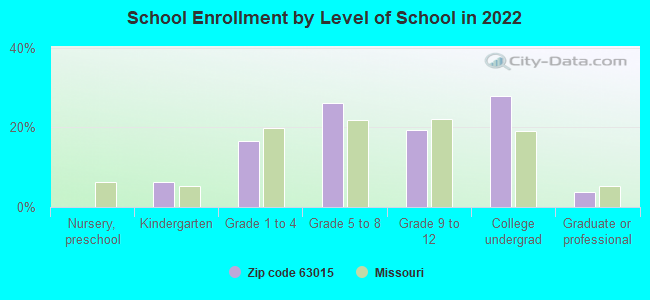
Private vs. public school enrollment:
Students in private schools in grades 1 to 8 (elementary and middle school): 7
Here:
6.9%
Missouri:
15.4%
Students in private schools in grades 9 to 12 (high school):
Here:
0.0%
Missouri:
13.9%
Students in private undergraduate colleges:
Here:
0.0%
Missouri:
22.6%
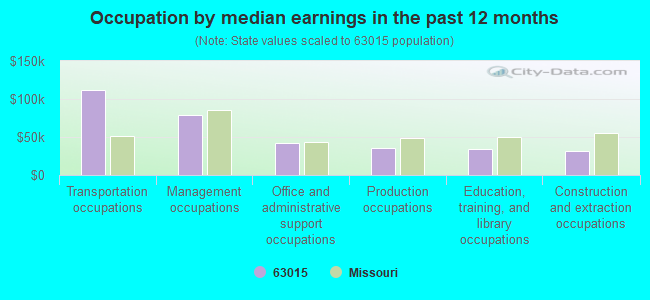
Occupation by median earnings in the past 12 months ($)
112,292Transportation occupations
79,014Management occupations
42,216Office and administrative support occupations
35,680Production occupations
34,209Education, training, and library occupations
31,725Construction and extraction occupations
Top industries in this zip code by the number of employees in 2005:
Administrative and Support and Waste Management and Remediation Services: Landscaping Services (5-9 employees: 2 establishments)
Construction: Poured Concrete Foundation and Structure Contractors (5-9: 1, 1-4: 1)
Professional, Scientific, and Technical Services: Testing Laboratories (5-9: 1)
Construction: Other Building Equipment Contractors (5-9: 1)
Construction: All Other Specialty Trade Contractors (5-9: 1)
Other Services (except Public Administration): Religious Organizations (5-9: 1)
Construction: New Single-Family Housing Construction (except Operative Builders) (1-4: 2)
Construction: Plumbing, Heating, and Air-Conditioning Contractors (1-4: 1)
People in group quarters in 2000:
41 people in nursing homes
7 people in religious group quarters
Fatal accident statistics in 2014:
Fatal accident count: 1
Vehicles involved in fatal accidents: 2
Fatal accidents caused by drunken drivers: 1
Fatalities: 1
Persons involved in fatal accidents: 3
Pedestrians involved in fatal accidents: 0
Fatal accident statistics in 2011:
Fatal accident count: 1
Vehicles involved in fatal accidents: 1
Fatal accidents caused by drunken drivers: 1
Fatalities: 1
Persons involved in fatal accidents: 1
Pedestrians involved in fatal accidents: 0
Home Mortgage Disclosure Act Aggregated Statistics For Year 2009 (Based on 4 partial tracts)
A) FHA, FSA/RHS & VA Home Purchase Loans
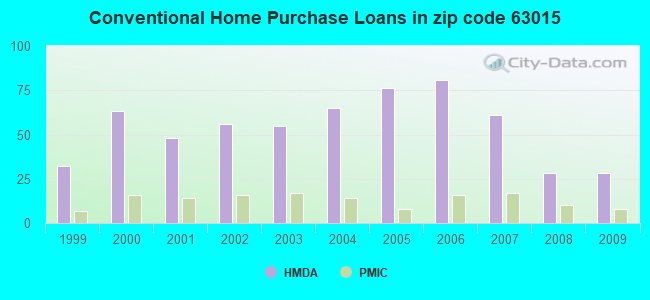
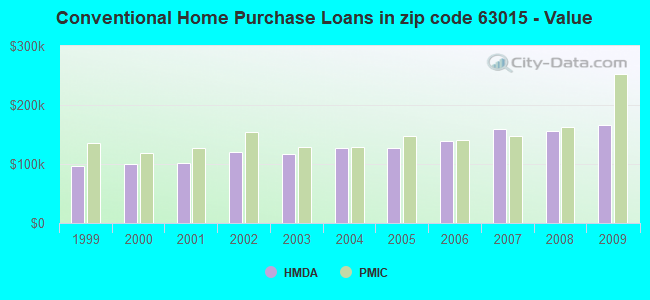
B) Conventional Home Purchase Loans
C) Refinancings
D) Home Improvement Loans
F) Non-occupant Loans on < 5 Family Dwellings (A B C & D)
G) Loans On Manufactured Home Dwelling (A B C & D)
Number
Average Value
Number
Average Value
Number
Average Value
Number
Average Value
Number
Average Value
Number
Average Value
LOANS ORIGINATED
18
$154,901
28
$166,453
166
$175,305
8
$82,321
10
$130,611
7
$89,461
APPLICATIONS APPROVED, NOT ACCEPTED
1
$125,770
3
$180,940
18
$186,116
1
$92,850
1
$109,820
1
$74,620
APPLICATIONS DENIED
4
$137,908
3
$86,223
51
$164,881
6
$63,310
2
$147,630
5
$104,162
APPLICATIONS WITHDRAWN
4
$114,320
3
$166,373
34
$181,876
2
$51,340
1
$116,500
0
$0
FILES CLOSED FOR INCOMPLETENESS
0
$0
1
$45,940
6
$188,602
0
$0
0
$0
1
$46,460
Aggregated Statistics For Year 2008 (Based on 4 partial tracts)
A) FHA, FSA/RHS & VA Home Purchase Loans
B) Conventional Home Purchase Loans
C) Refinancings
D) Home Improvement Loans
F) Non-occupant Loans on < 5 Family Dwellings (A B C & D)
G) Loans On Manufactured Home Dwelling (A B C & D)
Number
Average Value
Number
Average Value
Number
Average Value
Number
Average Value
Number
Average Value
Number
Average Value
LOANS ORIGINATED
16
$153,472
28
$155,504
104
$171,149
12
$60,665
13
$97,595
8
$68,044
APPLICATIONS APPROVED, NOT ACCEPTED
1
$98,530
3
$112,670
17
$149,139
3
$72,207
0
$0
3
$83,917
APPLICATIONS DENIED
4
$121,992
6
$110,623
61
$165,084
8
$25,211
3
$90,880
9
$76,383
APPLICATIONS WITHDRAWN
2
$98,280
4
$171,252
26
$164,551
3
$107,423
1
$158,720
2
$124,275
FILES CLOSED FOR INCOMPLETENESS
0
$0
1
$182,730
6
$163,352
1
$119,940
1
$94,940
0
$0
Aggregated Statistics For Year 2007 (Based on 4 partial tracts)
A) FHA, FSA/RHS & VA Home Purchase Loans
B) Conventional Home Purchase Loans
C) Refinancings
D) Home Improvement Loans
F) Non-occupant Loans on < 5 Family Dwellings (A B C & D)
G) Loans On Manufactured Home Dwelling (A B C & D)
Number
Average Value
Number
Average Value
Number
Average Value
Number
Average Value
Number
Average Value
Number
Average Value
LOANS ORIGINATED
10
$142,389
61
$158,579
125
$156,921
16
$52,883
12
$123,252
12
$101,485
APPLICATIONS APPROVED, NOT ACCEPTED
1
$181,020
9
$125,022
26
$132,024
4
$86,310
1
$127,530
3
$85,920
APPLICATIONS DENIED
2
$147,120
18
$170,998
84
$137,913
15
$60,564
3
$126,483
13
$79,741
APPLICATIONS WITHDRAWN
1
$183,000
7
$128,543
35
$160,500
6
$92,382
0
$0
2
$127,285
FILES CLOSED FOR INCOMPLETENESS
0
$0
2
$157,325
12
$220,930
1
$148,300
0
$0
1
$67,230
Aggregated Statistics For Year 2006 (Based on 4 partial tracts)
A) FHA, FSA/RHS & VA Home Purchase Loans
B) Conventional Home Purchase Loans
C) Refinancings
D) Home Improvement Loans
F) Non-occupant Loans on < 5 Family Dwellings (A B C & D)
G) Loans On Manufactured Home Dwelling (A B C & D)
Number
Average Value
Number
Average Value
Number
Average Value
Number
Average Value
Number
Average Value
Number
Average Value
LOANS ORIGINATED
8
$140,712
81
$138,827
136
$149,734
19
$69,103
12
$127,265
18
$89,029
APPLICATIONS APPROVED, NOT ACCEPTED
0
$0
12
$124,196
25
$155,125
3
$30,877
2
$136,040
3
$92,153
APPLICATIONS DENIED
3
$109,530
20
$104,295
83
$130,983
14
$61,806
4
$78,918
15
$87,757
APPLICATIONS WITHDRAWN
0
$0
8
$129,018
52
$156,701
6
$102,940
0
$0
3
$77,947
FILES CLOSED FOR INCOMPLETENESS
0
$0
3
$76,310
21
$157,649
0
$0
0
$0
1
$60,540
Aggregated Statistics For Year 2005 (Based on 4 partial tracts)
A) FHA, FSA/RHS & VA Home Purchase Loans
B) Conventional Home Purchase Loans
C) Refinancings
D) Home Improvement Loans
F) Non-occupant Loans on < 5 Family Dwellings (A B C & D)
G) Loans On Manufactured Home Dwelling (A B C & D)
Number
Average Value
Number
Average Value
Number
Average Value
Number
Average Value
Number
Average Value
Number
Average Value
LOANS ORIGINATED
10
$114,594
76
$127,505
162
$136,962
16
$63,782
19
$96,088
19
$90,768
APPLICATIONS APPROVED, NOT ACCEPTED
1
$65,960
14
$128,305
27
$141,114
4
$68,790
2
$168,245
3
$108,993
APPLICATIONS DENIED
2
$104,745
23
$110,807
93
$133,955
15
$43,945
3
$121,283
21
$97,507
APPLICATIONS WITHDRAWN
0
$0
13
$119,188
67
$153,256
6
$129,332
4
$122,520
5
$91,000
FILES CLOSED FOR INCOMPLETENESS
0
$0
3
$110,017
14
$129,124
0
$0
1
$48,700
1
$80,830
Aggregated Statistics For Year 2004 (Based on 4 partial tracts)
A) FHA, FSA/RHS & VA Home Purchase Loans
B) Conventional Home Purchase Loans
C) Refinancings
D) Home Improvement Loans
F) Non-occupant Loans on < 5 Family Dwellings (A B C & D)
G) Loans On Manufactured Home Dwelling (A B C & D)
Number
Average Value
Number
Average Value
Number
Average Value
Number
Average Value
Number
Average Value
Number
Average Value
LOANS ORIGINATED
10
$119,635
65
$126,866
172
$130,738
6
$55,580
11
$87,045
22
$89,857
APPLICATIONS APPROVED, NOT ACCEPTED
1
$112,900
9
$120,742
25
$131,472
1
$45,290
2
$80,305
3
$59,207
APPLICATIONS DENIED
4
$114,922
21
$100,991
80
$125,719
12
$65,332
5
$122,912
15
$80,320
APPLICATIONS WITHDRAWN
0
$0
8
$115,668
65
$115,846
3
$77,160
1
$80,930
6
$81,272
FILES CLOSED FOR INCOMPLETENESS
0
$0
1
$102,010
11
$116,932
2
$27,225
0
$0
1
$65,320
Aggregated Statistics For Year 2003 (Based on 4 partial tracts)
A) FHA, FSA/RHS & VA Home Purchase Loans
B) Conventional Home Purchase Loans
C) Refinancings
D) Home Improvement Loans
F) Non-occupant Loans on < 5 Family Dwellings (A B C & D)
Number
Average Value
Number
Average Value
Number
Average Value
Number
Average Value
Number
Average Value
LOANS ORIGINATED
7
$106,470
55
$117,077
355
$122,288
9
$21,327
10
$101,472
APPLICATIONS APPROVED, NOT ACCEPTED
1
$48,830
8
$84,742
43
$116,397
1
$36,340
1
$110,850
APPLICATIONS DENIED
2
$93,960
19
$78,987
94
$120,807
4
$14,952
4
$79,375
APPLICATIONS WITHDRAWN
1
$148,620
7
$142,849
62
$119,776
1
$30,600
1
$156,590
FILES CLOSED FOR INCOMPLETENESS
1
$60,520
2
$86,500
11
$137,772
1
$22,890
0
$0
Aggregated Statistics For Year 2002 (Based on 4 partial tracts)
A) FHA, FSA/RHS & VA Home Purchase Loans
B) Conventional Home Purchase Loans
C) Refinancings
D) Home Improvement Loans
F) Non-occupant Loans on < 5 Family Dwellings (A B C & D)
Number
Average Value
Number
Average Value
Number
Average Value
Number
Average Value
Number
Average Value
LOANS ORIGINATED
7
$115,037
56
$120,479
251
$118,842
10
$25,366
10
$98,792
APPLICATIONS APPROVED, NOT ACCEPTED
1
$107,490
10
$102,970
33
$112,820
1
$26,100
0
$0
APPLICATIONS DENIED
4
$72,550
23
$64,821
66
$100,300
8
$26,698
2
$44,375
APPLICATIONS WITHDRAWN
1
$124,080
7
$101,607
46
$115,816
2
$12,780
1
$58,190
FILES CLOSED FOR INCOMPLETENESS
1
$51,750
3
$86,087
15
$97,499
0
$0
0
$0
Aggregated Statistics For Year 2001 (Based on 4 partial tracts)
A) FHA, FSA/RHS & VA Home Purchase Loans
B) Conventional Home Purchase Loans
C) Refinancings
D) Home Improvement Loans
F) Non-occupant Loans on < 5 Family Dwellings (A B C & D)
Number
Average Value
Number
Average Value
Number
Average Value
Number
Average Value
Number
Average Value
LOANS ORIGINATED
11
$109,789
48
$101,725
194
$109,012
18
$52,094
7
$62,319
APPLICATIONS APPROVED, NOT ACCEPTED
2
$89,350
7
$82,534
25
$94,424
4
$45,975
1
$23,530
APPLICATIONS DENIED
2
$69,130
25
$62,143
62
$98,032
6
$14,738
1
$43,910
APPLICATIONS WITHDRAWN
2
$81,655
6
$104,493
39
$100,369
3
$24,663
1
$83,400
FILES CLOSED FOR INCOMPLETENESS
1
$44,020
1
$40,030
9
$98,299
1
$24,480
0
$0
Aggregated Statistics For Year 2000 (Based on 4 partial tracts)
A) FHA, FSA/RHS & VA Home Purchase Loans
B) Conventional Home Purchase Loans
C) Refinancings
D) Home Improvement Loans
F) Non-occupant Loans on < 5 Family Dwellings (A B C & D)
Number
Average Value
Number
Average Value
Number
Average Value
Number
Average Value
Number
Average Value
LOANS ORIGINATED
10
$90,008
63
$99,254
85
$95,026
18
$19,733
9
$61,827
APPLICATIONS APPROVED, NOT ACCEPTED
3
$43,347
9
$73,204
19
$82,285
4
$20,452
1
$53,470
APPLICATIONS DENIED
6
$46,408
28
$58,451
39
$76,034
8
$22,196
1
$67,120
APPLICATIONS WITHDRAWN
2
$69,970
7
$78,041
23
$71,904
2
$35,830
1
$54,590
FILES CLOSED FOR INCOMPLETENESS
0
$0
1
$108,360
5
$82,094
0
$0
0
$0
Aggregated Statistics For Year 1999 (Based on 2 partial tracts)
A) FHA, FSA/RHS & VA Home Purchase Loans
B) Conventional Home Purchase Loans
C) Refinancings
D) Home Improvement Loans
F) Non-occupant Loans on < 5 Family Dwellings (A B C & D)
Detailed PMIC statistics for the following Tracts:7004.00
, 8008.00
2002 - 2018 National Fire Incident Reporting System (NFIRS) incidents
Based on the data from the years 2002 - 2018 the average number of fires per year is 11. The highest number of reported fire incidents - 27 took place in 2004, and the least - 1 in 2013. The data has a constant trend.
When looking into fire subcategories, the most reports belonged to: Structure Fires (49.5%), and Outside Fires (33.7%).
Fire incident types reported to NFIRS in Zip Code 63015
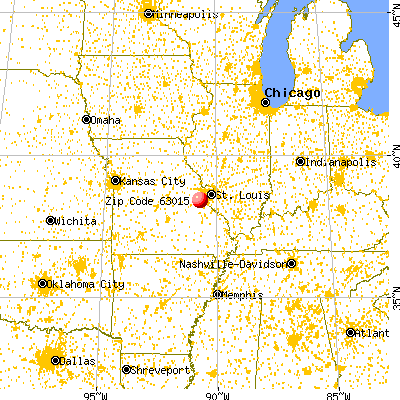


 Nearest zip codes: 63072, 63069, 63039, 63016, 63089, 63061.


 (Location: 2264 HWY AP, Grades: KG-5)
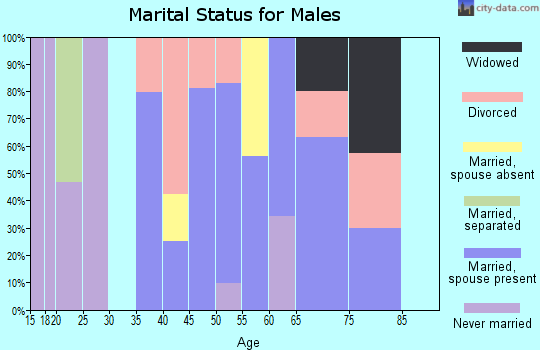
 Based on the data from the years 2002 - 2018 the average number of fires per year is 11. The highest number of reported fire incidents - 27 took place in 2004, and the least - 1 in 2013. The data has a constant trend.
 When looking into fire subcategories, the most reports belonged to: Structure Fires (49.5%), and Outside Fires (33.7%).