Estimated zip code population in 2022: 646 Zip code population in 2010: 726 Zip code population in 2000: 832
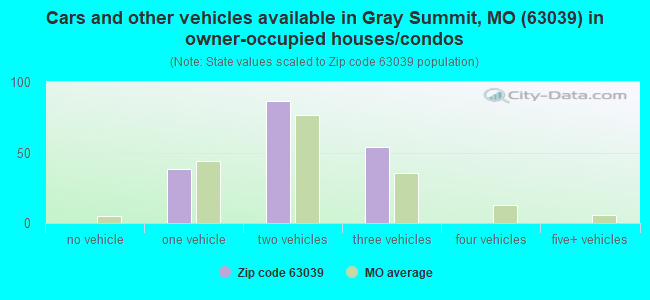
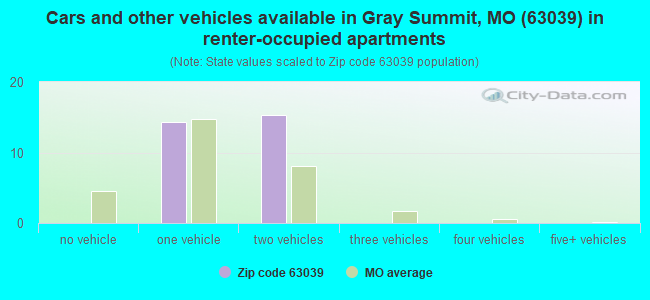
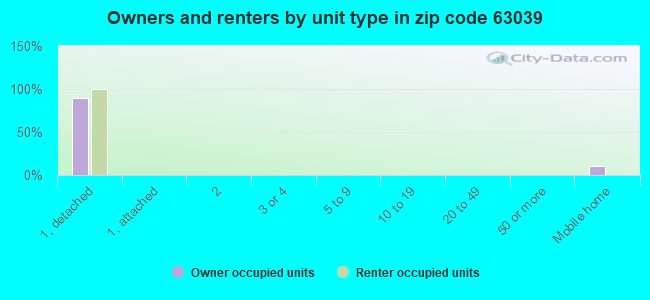
Houses and condos: 240 Renter-occupied apartments: 29
% of renters here:
14%
State:
32%
March 2022 cost of living index in zip code 63039: 82.2 (low, U.S. average is 100)
Land area: 3.8 sq. mi. Water area: 0.0 sq. mi.
Population density: 169 people per square mile
(very low).
OSM Map
General Map
Google Map
MSN Map
OSM Map
General Map
Google Map
MSN Map
OSM Map
General Map
Google Map
MSN Map
OSM Map
General Map
Google Map
MSN Map
Please wait while loading the map...
Real estate property taxes paid for housing units in 2022:
This zip code:
0.7% ($1,051)
Missouri:
0.8% ($1,810)
Median real estate property taxes paid for housing units with mortgages in 2022: $764 (0.6%) Median real estate property taxes paid for housing units with no mortgage in 2022: $1,216 (0.8%)
Business Search- 14 Million verified businesses
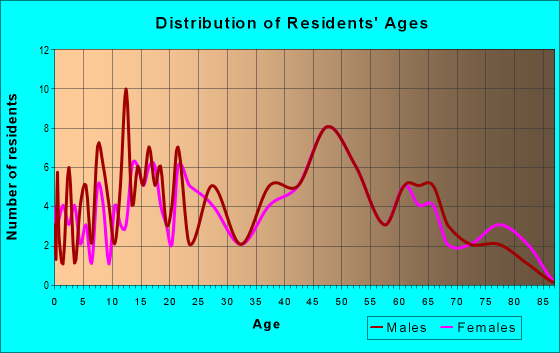
Males: 344
(53.3%)
Females: 301
(46.7%)
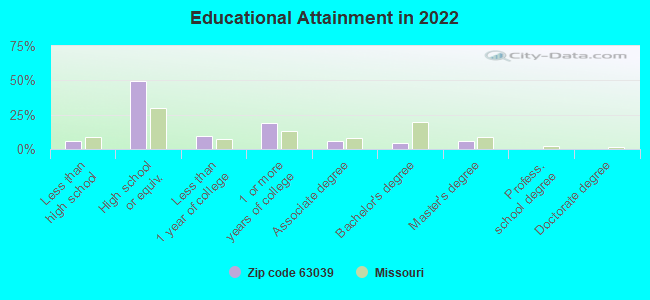
For population 25 years and over in 63039:
High school or higher: 91.8%
Bachelor's degree or higher: 9.9%
Graduate or professional degree: 5.8%
Mean travel time to work (commute): 25.9 minutes
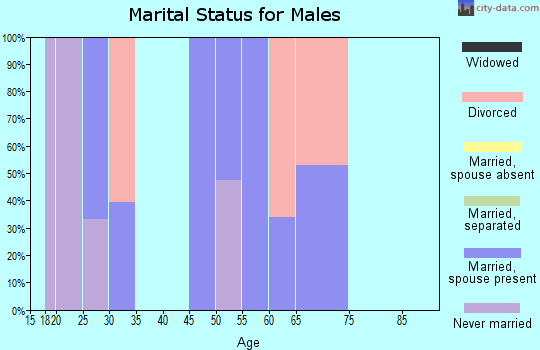
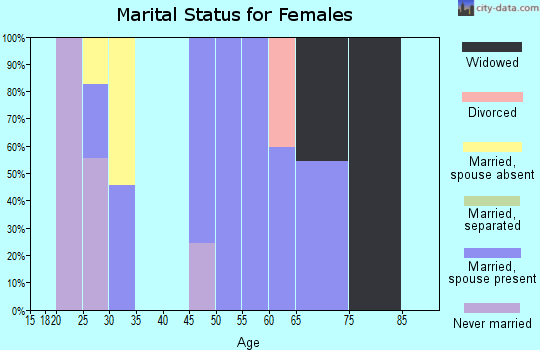
For population 15 years and over in 63039:
Never married: 34.0%
Now married: 53.3%
Separated: 0.0%
Widowed: 0.0%
Divorced: 12.7%
Zip code 63039 compared to state average:
Median house value below state average.
Unemployed percentage significantly below state average.
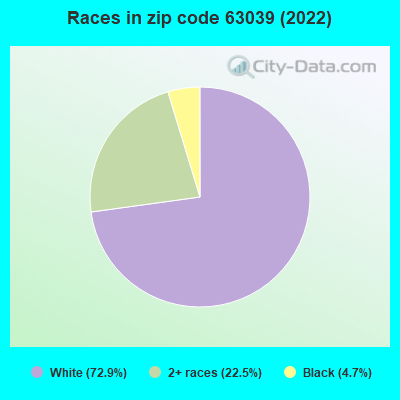
Black race population percentage below state average.
Hispanic race population percentage significantly below state average.
Median age below state average.
Foreign-born population percentage significantly below state average.
Renting percentage significantly below state average.
Length of stay since moving in significantly below state average.
Number of college students significantly below state average.
Percentage of population with a bachelor's degree or higher significantly below state average.
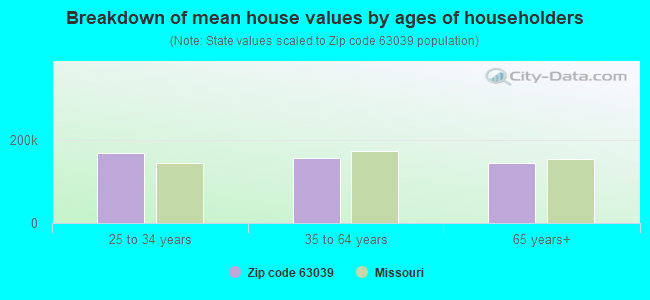
Estimated median house/condo value in 2022: $141,107
63039:
$141,107
Missouri:
$221,200
Median resident age:
This zip code:
33.2 years
Missouri median age:
39.1 years
Average household size:
This zip code:
3.1 people
Missouri:
2.4 people
Averages for the 2020 tax year for zip code 63039, filed in 2021:
Average Adjusted Gross Income (AGI) in 2020: $51,122 (Individual Income Tax Returns)
Here:
$51,122
State:
$68,151
Salary/wage: $46,689 (reported on 77.8% of returns)
Here:
$46,689
State:
$56,131
(% of AGI for various income ranges: 1203.0% for AGIs below $25k, 3170.9% for AGIs $25k-50k, 5676.7% for AGIs $50k-75k, 8103.3% for AGIs $75k-100k, 14532.5% for AGIs $100k-200k)
Taxable interest for individuals: $336 (reported on 31.1% of returns)
This zip code:
$336
Missouri:
$1,586
(% of AGI for various income ranges: 8.0% for AGIs below $25k, 8.2% for AGIs $25k-50k, 40.0% for AGIs $50k-75k, 15.0% for AGIs $100k-200k)
Ordinary dividends: $2,017 (reported on 13.3% of returns)
Here:
$2,017
State:
$10,947
(% of AGI for various income ranges: 58.2% for AGIs $25k-50k, 190.0% for AGIs $75k-100k)
Net capital gain/loss in AGI: +$2,140 (reported on 11.1% of returns)
Here:
+$2,140
State:
+$18,453
(% of AGI for various income ranges: 52.0% for AGIs below $25k, 91.7% for AGIs $50k-75k)
Profit/loss from business: +$2,600 (reported on 8.9% of returns)
Here:
+$2,600
State:
+$12,260
(% of AGI for various income ranges: 94.5% for AGIs $25k-50k)
Taxable individual retirement arrangement distribution: $11,550 (reported on 8.9% of returns)
63039:
$11,550
Missouri:
$19,719
(% of AGI for various income ranges: 194.0% for AGIs below $25k, 446.7% for AGIs $50k-75k)
Earned income credit: $2,283 (reported on 13.3% of returns)
Here:
$2,283
State:
$2,315
(% of AGI for various income ranges: 79.0% for AGIs below $25k, 52.7% for AGIs $25k-50k)
Percentage of individuals using paid preparers for their 2020 taxes: 93.3%
Here:
93%
State:
93%
(% for various income ranges: 92.9% for AGIs below $25k, 92.9% for AGIs $25k-50k, 100.0% for AGIs $50k-75k, 100.0% for AGIs $75k-100k, 83.3% for AGIs $100k-200k)
Averages for the 2012 tax year for zip code 63039, filed in 2013:
Average Adjusted Gross Income (AGI) in 2012: $42,425 (Individual Income Tax Returns)
Here:
$42,425
State:
$55,896
Salary/wage: $37,271 (reported on 86.4% of returns)
Here:
$37,271
State:
$46,205
(% of AGI for various income ranges: 71.9% for AGIs below $25k, 72.6% for AGIs $25k-50k, 77.8% for AGIs $50k-75k, 80.0% for AGIs $75k-100k, 74.6% for AGIs $100k-200k)
Taxable interest for individuals: $429 (reported on 31.8% of returns)
This zip code:
$429
Missouri:
$1,559
(% of AGI for various income ranges: 0.6% for AGIs below $25k, 0.5% for AGIs $25k-50k, 0.2% for AGIs $50k-75k, 0.5% for AGIs $75k-100k)
Ordinary dividends: $957 (reported on 15.9% of returns)
Here:
$957
State:
$7,410
Profit/loss from business: +$9,725 (reported on 9.1% of returns)
Here:
+$9,725
State:
+$11,688
Taxable individual retirement arrangement distribution: $13,075 (reported on 9.1% of returns)
63039:
$13,075
Missouri:
$14,773
Total itemized deductions: $14,725 (21% of AGI, reported on 27.3% of returns)
Here:
$14,725
State:
$22,730
Here:
21.0% of AGI
State:
19.2% of AGI
(% of AGI for various income ranges: 9.6% for AGIs $25k-50k, 7.6% for AGIs $50k-75k, 11.0% for AGIs $75k-100k, 15.3% for AGIs $100k-200k)
Charity contributions: $3,300 (reported on 15.9% of returns)
Here:
$3,300
State:
$4,745
(% of AGI for various income ranges: 1.1% for AGIs $25k-50k, 2.0% for AGIs $75k-100k, 2.8% for AGIs $100k-200k)
Taxes paid: $4,883 (reported on 27.3% of returns)
63039:
$4,883
State:
$8,399
(% of AGI for various income ranges: 2.7% for AGIs $25k-50k, 1.9% for AGIs $50k-75k, 3.9% for AGIs $75k-100k, 5.9% for AGIs $100k-200k)
Earned income credit: $2,086 (reported on 15.9% of returns)
Here:
$2,086
State:
$2,288
(% of AGI for various income ranges: 6.9% for AGIs below $25k)
Percentage of individuals using paid preparers for their 2012 taxes: 56.8%
Here:
57%
State:
55%
(% for various income ranges: 47.1% for AGIs below $25k, 63.6% for AGIs $25k-50k, 62.5% for AGIs $50k-75k, 100.0% for AGIs $75k-100k)
Averages for the 2004 tax year for zip code 63039, filed in 2005:
Average Adjusted Gross Income (AGI) in 2004: $40,211 (Individual Income Tax Returns)
Here:
$40,211
State:
$44,591
Salary/wage: $35,993 (reported on 89.0% of returns)
Here:
$35,993
State:
$38,941
(% of AGI for various income ranges: 76.2% for AGIs below $10k, 76.2% for AGIs $10k-25k, 83.7% for AGIs $25k-50k, 85.3% for AGIs $50k-75k, 74.2% for AGIs $75k-100k, 72.6% for AGIs over 100k)
Taxable interest for individuals: $738 (reported on 38.7% of returns)
This zip code:
$738
Missouri:
$1,801
(% of AGI for various income ranges: 1.5% for AGIs below $10k, 2.2% for AGIs $10k-25k, 0.8% for AGIs $25k-50k, 0.3% for AGIs $50k-75k, 0.7% for AGIs $75k-100k, 0.4% for AGIs over 100k)
Taxable dividends: $701 (reported on 20.5% of returns)
Here:
$701
State:
$3,677
(% of AGI for various income ranges: 1.1% for AGIs $10k-25k, 0.2% for AGIs $25k-50k, 0.2% for AGIs $50k-75k, 0.5% for AGIs $75k-100k, 0.3% for AGIs over 100k)
Net capital gain/loss: +$3,610 (reported on 12.5% of returns)
Here:
+$3,610
State:
+$8,915
(% of AGI for various income ranges: 0.4% for AGIs below $10k, -0.1% for AGIs $25k-50k, 0.2% for AGIs $50k-75k, 5.8% for AGIs over 100k)
Profit/loss from business: +$4,674 (reported on 9.7% of returns)
Here:
+$4,674
State:
+$9,793
Total itemized deductions: $14,200 (21% of AGI, reported on 26.4% of returns)
Here:
$14,200
State:
$18,261
Here:
20.9% of AGI
State:
20.5% of AGI
(% of AGI for various income ranges: 6.2% for AGIs $10k-25k, 10.1% for AGIs $25k-50k, 7.6% for AGIs $50k-75k, 13.4% for AGIs $75k-100k, 10.7% for AGIs over 100k)
Charity contributions deductions: $2,651 (4% of AGI, reported on 22.4% of returns)
Here:
$2,651
State:
$3,665
Here:
3.7% of AGI
State:
3.9% of AGI
(% of AGI for various income ranges: 1.7% for AGIs $25k-50k, 0.8% for AGIs $50k-75k, 3.6% for AGIs $75k-100k, 1.5% for AGIs over 100k)
Total tax: $4,997 (reported on 75.9% of returns)
63039:
$4,997
State:
$6,999
(% of AGI for various income ranges: 1.7% for AGIs below $10k, 4.1% for AGIs $10k-25k, 6.4% for AGIs $25k-50k, 8.8% for AGIs $50k-75k, 11.4% for AGIs $75k-100k, 16.5% for AGIs over 100k)
Earned income credit: $1,443 (reported on 12.9% of returns)
Here:
$1,443
State:
$1,728
Percentage of individuals using paid preparers for their 2004 taxes: 58.8%
Here:
59%
State:
62%
(% for various income ranges: 52.6% for AGIs below $10k, 53.7% for AGIs $10k-25k, 58.0% for AGIs $25k-50k, 65.9% for AGIs $50k-75k, 69.4% for AGIs $75k-100k, 66.7% for AGIs over 100k)
Household received Food Stamps/SNAP in the past 12 months: 0 Household did not receive Food Stamps/SNAP in the past 12 months: 209
Women who had a birth in the past 12 months: 25 (16 now married, 8 unmarried) Women who did not have a birth in the past 12 months: 59 (15 now married, 43 unmarried)
Housing units in zip code 63039 with a mortgage: 126 Houses without a mortgage: 10
Median monthly owner costs for units with a mortgage: $1,188 Median monthly owner costs for units without a mortgage: $388
Residents with income below the poverty level in 2022:
This zip code:
20.7%
Whole state:
13.2%
Residents with income below 50% of the poverty level in 2022:
This zip code:
20.7%
Whole state:
6.8%
Median number of rooms in houses and condos:
Here:
5.9
State:
6.4
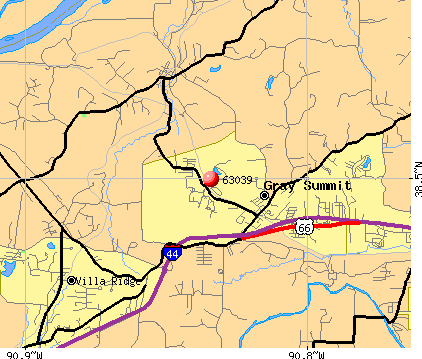
Notable locations in this zip code not listed on our city pages
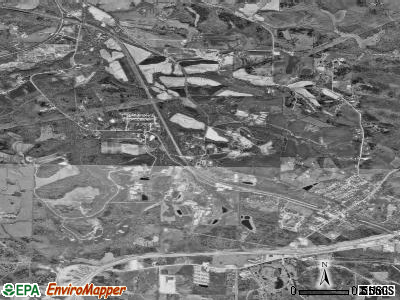
Notable locations in zip code 63039: Purina Farm (A), Purina Mills Farm (B), Boles Fire Protection District Station 1 (C). Display/hide their locations on the map
Size of family households: 66 2-persons, 47 3-persons, 3 4-persons, 52 6-persons
Size of nonfamily households: 42 1-person
74 married couples with children.
101 single-parent households (67 men, 34 women).
100.2% of residents of 63039 zip code speak English at home.
Foreign born population: 0 (0.0%)
:
0.0%
Whole state:
4.1%
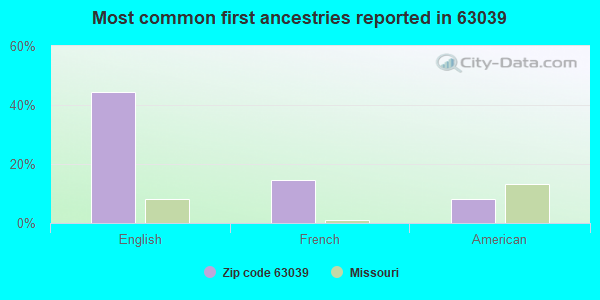
44%English
14%French
8%American
Facilities with environmental interests located in this zip code:
PURINA MILLS RESEARCH CENTER (100 DANFORTH DRIVE in GRAY SUMMIT, MO)
AIR MINOR (AIRS/AFS) STATE MASTER (Missouri monitoring and compilance) - AIRS/AFS-MO0806372, AIR MINOR, AIRS/AFS-MO0886887, RCRAINFO-MOD071954721, SQG, PCS-MOG010169, NPDES NON-MAJOR, PCS-MOR105883, NEI-NTIMO15208, AIR PROGRAM National Pollutant Discharge Elimination System NON-MAJOR (Tracking pollutant discharge elimination systems) - permit Small Quantity Generators, between 100 kg and 1000 kg of hazardous waste/month (Resource Conservation and Recovery Act (tracking hazardous waste)) - notification Business SIC classification: BROILER, FRYER, AND ROASTER CHICKENS; HEAVY CONSTRUCTION; REFUSE SYSTEMS; GENERAL MEDICAL AND SURGICAL HOSPITALS Organizations: PURINA MILLS, LLC (CONTACT/OWNER)
Alternative names: LAND O'LAKES PURENA FEED LLC, PURINA MILLS, INC., PURINA MILLS, GRAY SUMMIT RESEARCH FARM, RALSTON PURINA RESEARCH FARM
QUAIL RUN MOBILE MANOR (STATE HIGHWAY 100 2 MI E OF in GRAY SUMMIT, MO)
SUPERFUND (Superfund database) (Integrated Compliance Information System) - ICIS-07-1996-0220, FORMAL ENFORCEMENT ACTION, ICIS-07-1985-0123, ICIS-07-1984-0014, ICIS-07-1983-0005, STATE MASTER (Missouri monitoring and compilance) - ICIS-44188, ENFORCEMENT/COMPLIANCE ACTIVITY, CERCLIS-MOD980688634, SUPERFUND, RCRAINFO-MOD980688634, LQG (Resource Conservation and Recovery Act (tracking hazardous waste)) Organizations: GARY A AND TERESA A CROSS (CONTACT/OWNER)
Alternative names: BELL MOBILE HOME, CHLANDRA PROPERTY, GRAY SUMMIT TRAILER PARK, MAHANEY RESIDENCE, TRAILER PARK IN GRAY SUMMIT
SUPERFUND (Superfund database) (Integrated Compliance Information System) - ICIS-07-1984-0014, FORMAL ENFORCEMENT ACTION STATE MASTER (Missouri monitoring and compilance) - ICIS-34531, ENFORCEMENT/COMPLIANCE ACTIVITY, CERCLIS-MOD980861926, SUPERFUND Business SIC classification: NONCLASSIFIABLE ESTABLISHMENTS Alternative names: CHLANDA SITE (FINDS), QUAIL RUN MOBILE PARK
FRANKLIN COUNTY PWSD #3 (GRAY SUMMIT in GRAY SUMMIT, MO)
STATE MASTER (Missouri monitoring and compilance) - PCS-MO0111937, NPDES NON-MAJOR National Pollutant Discharge Elimination System NON-MAJOR (Tracking pollutant discharge elimination systems) - permit Business SIC classification: SEWERAGE SYSTEMS Organizations: FRANKLIN CO PWSD #3 (CONTACT/OWNER)
Alternative names: FCPWSD #3, LITTLE FOX CR
BEAUTY VIEW ACRES SEW DIS (BEAUTY VIEW DRIVE in GRAY SUMMIT, MO)
STATE MASTER (Missouri monitoring and compilance) - PCS-MO0109177, NPDES NON-MAJOR National Pollutant Discharge Elimination System NON-MAJOR (Tracking pollutant discharge elimination systems) - permit Business SIC classification: SEWERAGE SYSTEMS
PURINA MILLS, LLC. (3562 HIGHWAY MM in GRAY SUMMIT, MO)
STATE MASTER (Missouri monitoring and compilance) - PCS-MO0100587, NPDES NON-MAJOR National Pollutant Discharge Elimination System NON-MAJOR (Tracking pollutant discharge elimination systems) - permit Business SIC classification: PREPARED FEEDS AND FEED INGREDIENTS FOR ANIMALS AND FOWLS, EXCEPT DOGS AND CATS Alternative names: PURINA MILLS, INC., PURINA MILLS RESEARCH CTR
GRAY SUMMIT SEWER DIST (GRAY SUMMIT in GRAY SUMMIT, MO)
STATE MASTER (Missouri monitoring and compilance) - PCS-MO0098981, NPDES NON-MAJOR National Pollutant Discharge Elimination System NON-MAJOR (Tracking pollutant discharge elimination systems) - permit Business SIC classification: SEWERAGE SYSTEMS Organizations: GRAY SUMMIT SEWER DISTRIC (CONTACT/OWNER)
GSA, CAMP FIDDLECREEK (HWY 100 in GRAY SUMMIT, MO)
STATE MASTER (Missouri monitoring and compilance) - PCS-MO0115291, NPDES NON-MAJOR National Pollutant Discharge Elimination System NON-MAJOR (Tracking pollutant discharge elimination systems) - permit Business SIC classification: SPORTING AND RECREATIONAL CAMPS Organizations: GIRL SCOUT COUNCIL OF GRE (CONTACT/OWNER)
Alternative names: GIRL SCOUT CNCL/ST LOUIS
FOX CREEK, LLC (FOX CR LANE & HWY 100 in GRAY SUMMIT, MO)
STATE MASTER (Missouri monitoring and compilance) - PCS-MOR104167, NPDES NON-MAJOR National Pollutant Discharge Elimination System NON-MAJOR (Tracking pollutant discharge elimination systems) - permit Business SIC classification: HEAVY CONSTRUCTION Alternative names: FOX CREEK MHP, ROB ROSENFELD, FOX CR LLC
FRANKLIN COUNTY PUBLIC WA (PINE LAKE ESTATES in GRAY SUMMIT, MO)
STATE MASTER (Missouri monitoring and compilance) - PCS-MO0111554, NPDES NON-MAJOR National Pollutant Discharge Elimination System NON-MAJOR (Tracking pollutant discharge elimination systems) - permit Business SIC classification: SEWERAGE SYSTEMS Alternative names: FCPWSD #3,PINE LK EST SUB, FRANKLIN COUNTY PWSD #3
AMERICAN TEL & TEL CO LONG LINES (RR in GRAY SUMMIT, MO)
STATE MASTER (Missouri monitoring and compilance) - RCRAINFO-MOD980518138, NOT IN A UNIVERSE (Resource Conservation and Recovery Act (tracking hazardous waste))
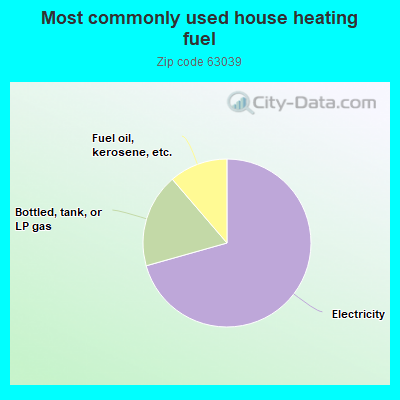
71.4%Electricity
18.3%Bottled, tank, or LP gas
11.4%Fuel oil, kerosene, etc.
Population in 1990: 752. Population change in the 1990s: +80 (+10.6%).
Place of birth for U.S.-born residents:
This state: 478
Northeast: 4
Midwest: 106
South: 35
West: 22
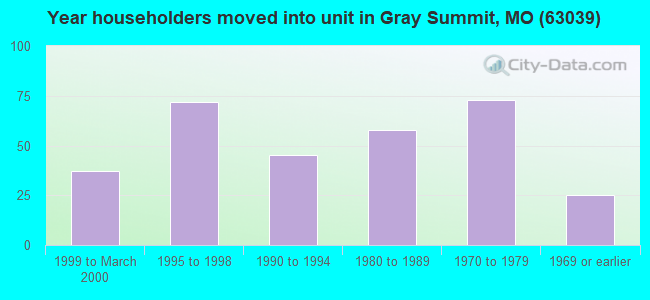
65% of the 63039 zip code residents lived in the same house 5 years ago. Out of people who lived in different houses, 56% lived in this county. Out of people who lived in different counties, 50% lived in Missouri.
97% of the 63039 zip code residents lived in the same house 1 year ago. Out of people who lived in different houses, 100% moved from this county.
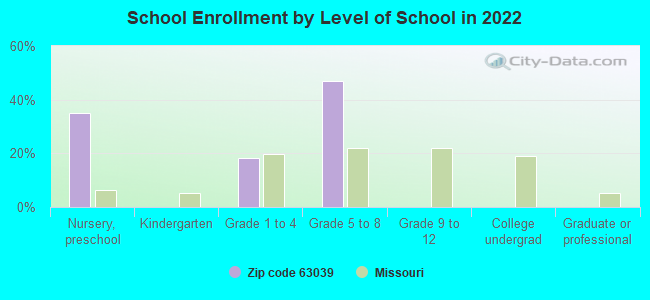
Private vs. public school enrollment:
Students in private schools in grades 1 to 8 (elementary and middle school): 55
Here:
46.1%
Missouri:
15.4%
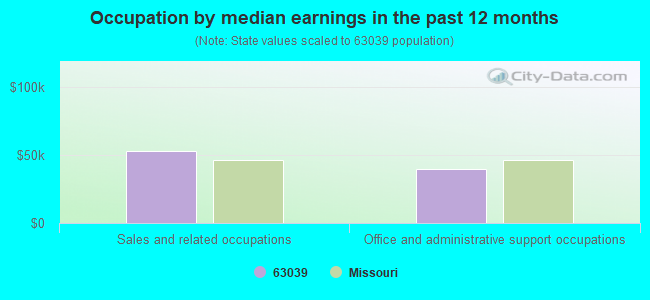
Occupation by median earnings in the past 12 months ($)
52,962Sales and related occupations
39,835Office and administrative support occupations
Top industries in this zip code by the number of employees in 2005:
Professional, Scientific, and Technical Services: Marketing Research and Public Opinion Polling (over 1000 employees: 1 establishment)
Other Services (except Public Administration): Religious Organizations (20-49: 1, 5-9: 1)
Administrative and Support and Waste Management and Remediation Services: All Other Support Services (20-49: 1)
Arts, Entertainment, and Recreation: Zoos and Botanical Gardens (20-49: 1)
Construction: Power and Communication Line and Related Structures Construction (5-9: 1)
Wholesale Trade: Other Professional Equipment and Supplies Merchant Wholesalers (5-9: 1)
Finance and Insurance: Commercial Banking (5-9: 1)
Real Estate and Rental and Leasing: Offices of Real Estate Agents and Brokers (1-4: 1)
Fatal accident statistics in 2013:
Fatal accident count: 1
Vehicles involved in fatal accidents: 2
Fatal accidents caused by drunken drivers: 0
Fatalities: 1
Persons involved in fatal accidents: 4
Pedestrians involved in fatal accidents: 0
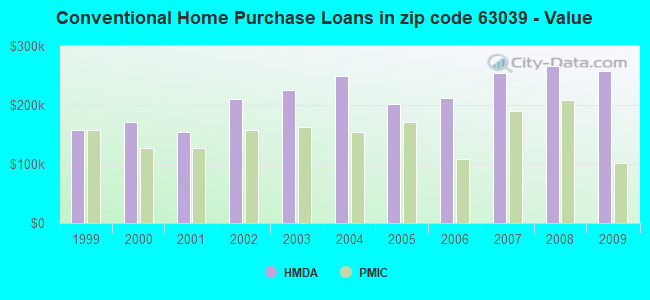
Home Mortgage Disclosure Act Aggregated Statistics For Year 2009 (Based on 2 partial tracts)
A) FHA, FSA/RHS & VA Home Purchase Loans
B) Conventional Home Purchase Loans
C) Refinancings
D) Home Improvement Loans
F) Non-occupant Loans on < 5 Family Dwellings (A B C & D)
G) Loans On Manufactured Home Dwelling (A B C & D)
Number
Average Value
Number
Average Value
Number
Average Value
Number
Average Value
Number
Average Value
Number
Average Value
LOANS ORIGINATED
2
$179,655
6
$257,785
49
$235,533
2
$74,100
3
$163,673
1
$115,890
APPLICATIONS APPROVED, NOT ACCEPTED
0
$0
0
$0
4
$218,468
0
$0
0
$0
0
$0
APPLICATIONS DENIED
0
$0
1
$48,530
11
$269,329
1
$111,960
1
$31,130
1
$24,330
APPLICATIONS WITHDRAWN
0
$0
1
$151,200
8
$264,739
0
$0
0
$0
0
$0
FILES CLOSED FOR INCOMPLETENESS
0
$0
0
$0
3
$247,737
0
$0
0
$0
0
$0
Aggregated Statistics For Year 2008 (Based on 2 partial tracts)
A) FHA, FSA/RHS & VA Home Purchase Loans
B) Conventional Home Purchase Loans
C) Refinancings
D) Home Improvement Loans
F) Non-occupant Loans on < 5 Family Dwellings (A B C & D)
G) Loans On Manufactured Home Dwelling (A B C & D)
Number
Average Value
Number
Average Value
Number
Average Value
Number
Average Value
Number
Average Value
Number
Average Value
LOANS ORIGINATED
2
$170,955
9
$266,716
26
$251,005
3
$68,453
3
$227,940
1
$230,600
APPLICATIONS APPROVED, NOT ACCEPTED
0
$0
1
$151,070
4
$164,972
1
$48,270
0
$0
1
$50,360
APPLICATIONS DENIED
1
$46,560
1
$101,630
9
$250,802
2
$37,280
0
$0
2
$75,600
APPLICATIONS WITHDRAWN
0
$0
1
$93,650
6
$215,188
0
$0
1
$77,560
0
$0
FILES CLOSED FOR INCOMPLETENESS
0
$0
0
$0
2
$215,755
0
$0
0
$0
0
$0
Aggregated Statistics For Year 2007 (Based on 2 partial tracts)
A) FHA, FSA/RHS & VA Home Purchase Loans
B) Conventional Home Purchase Loans
C) Refinancings
D) Home Improvement Loans
F) Non-occupant Loans on < 5 Family Dwellings (A B C & D)
G) Loans On Manufactured Home Dwelling (A B C & D)
Number
Average Value
Number
Average Value
Number
Average Value
Number
Average Value
Number
Average Value
Number
Average Value
LOANS ORIGINATED
1
$141,390
16
$253,621
34
$292,957
4
$84,628
3
$190,750
4
$51,438
APPLICATIONS APPROVED, NOT ACCEPTED
0
$0
2
$427,260
7
$252,537
1
$63,310
0
$0
0
$0
APPLICATIONS DENIED
0
$0
4
$358,490
19
$330,779
4
$97,152
2
$167,490
1
$56,640
APPLICATIONS WITHDRAWN
0
$0
2
$190,510
8
$204,359
0
$0
0
$0
1
$64,220
FILES CLOSED FOR INCOMPLETENESS
0
$0
0
$0
4
$324,318
0
$0
0
$0
0
$0
Aggregated Statistics For Year 2006 (Based on 2 partial tracts)
A) FHA, FSA/RHS & VA Home Purchase Loans
B) Conventional Home Purchase Loans
C) Refinancings
D) Home Improvement Loans
F) Non-occupant Loans on < 5 Family Dwellings (A B C & D)
G) Loans On Manufactured Home Dwelling (A B C & D)
Number
Average Value
Number
Average Value
Number
Average Value
Number
Average Value
Number
Average Value
Number
Average Value
LOANS ORIGINATED
2
$95,745
18
$212,281
31
$283,861
4
$164,940
4
$156,272
4
$55,230
APPLICATIONS APPROVED, NOT ACCEPTED
0
$0
3
$172,177
6
$258,722
1
$30,480
0
$0
1
$68,280
APPLICATIONS DENIED
0
$0
3
$178,237
21
$216,430
4
$73,608
0
$0
2
$69,715
APPLICATIONS WITHDRAWN
0
$0
2
$236,160
11
$166,009
1
$99,150
0
$0
0
$0
FILES CLOSED FOR INCOMPLETENESS
0
$0
1
$191,100
3
$210,370
0
$0
0
$0
0
$0
Aggregated Statistics For Year 2005 (Based on 2 partial tracts)
A) FHA, FSA/RHS & VA Home Purchase Loans
B) Conventional Home Purchase Loans
C) Refinancings
D) Home Improvement Loans
F) Non-occupant Loans on < 5 Family Dwellings (A B C & D)
G) Loans On Manufactured Home Dwelling (A B C & D)
Number
Average Value
Number
Average Value
Number
Average Value
Number
Average Value
Number
Average Value
Number
Average Value
LOANS ORIGINATED
2
$107,255
23
$201,187
37
$251,235
3
$93,480
3
$112,270
3
$71,330
APPLICATIONS APPROVED, NOT ACCEPTED
0
$0
3
$127,180
5
$265,394
1
$57,940
1
$79,920
1
$52,840
APPLICATIONS DENIED
0
$0
5
$157,090
15
$186,433
2
$45,845
1
$145,320
3
$71,983
APPLICATIONS WITHDRAWN
0
$0
4
$123,998
13
$194,701
2
$137,730
1
$360,220
0
$0
FILES CLOSED FOR INCOMPLETENESS
0
$0
1
$164,420
3
$179,457
0
$0
0
$0
0
$0
Aggregated Statistics For Year 2004 (Based on 2 partial tracts)
A) FHA, FSA/RHS & VA Home Purchase Loans
B) Conventional Home Purchase Loans
C) Refinancings
D) Home Improvement Loans
F) Non-occupant Loans on < 5 Family Dwellings (A B C & D)
G) Loans On Manufactured Home Dwelling (A B C & D)
Number
Average Value
Number
Average Value
Number
Average Value
Number
Average Value
Number
Average Value
Number
Average Value
LOANS ORIGINATED
1
$133,940
16
$248,994
41
$206,820
2
$36,430
2
$186,585
2
$42,640
APPLICATIONS APPROVED, NOT ACCEPTED
0
$0
3
$189,660
6
$144,643
0
$0
0
$0
1
$34,010
APPLICATIONS DENIED
0
$0
4
$245,838
16
$216,482
1
$77,560
0
$0
2
$43,820
APPLICATIONS WITHDRAWN
0
$0
2
$223,800
13
$148,599
0
$0
0
$0
1
$57,940
FILES CLOSED FOR INCOMPLETENESS
0
$0
0
$0
2
$110,855
0
$0
0
$0
0
$0
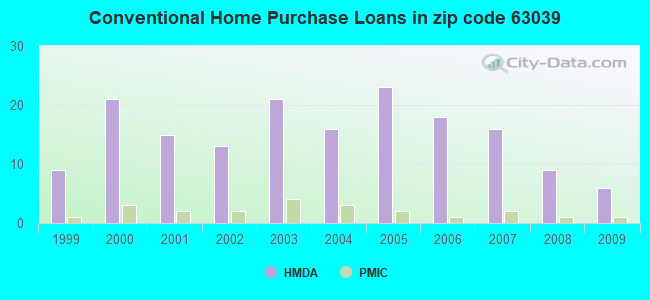
Aggregated Statistics For Year 2003 (Based on 2 partial tracts)
A) FHA, FSA/RHS & VA Home Purchase Loans
B) Conventional Home Purchase Loans
C) Refinancings
D) Home Improvement Loans
F) Non-occupant Loans on < 5 Family Dwellings (A B C & D)
Number
Average Value
Number
Average Value
Number
Average Value
Number
Average Value
Number
Average Value
LOANS ORIGINATED
2
$124,650
21
$225,057
90
$208,851
2
$38,260
2
$172,000
APPLICATIONS APPROVED, NOT ACCEPTED
0
$0
2
$161,995
8
$168,666
0
$0
0
$0
APPLICATIONS DENIED
0
$0
5
$85,752
16
$155,211
1
$25,770
0
$0
APPLICATIONS WITHDRAWN
0
$0
2
$239,690
13
$162,162
0
$0
1
$58,990
FILES CLOSED FOR INCOMPLETENESS
0
$0
1
$82,930
2
$233,480
0
$0
0
$0
Aggregated Statistics For Year 2002 (Based on 2 partial tracts)
A) FHA, FSA/RHS & VA Home Purchase Loans
B) Conventional Home Purchase Loans
C) Refinancings
D) Home Improvement Loans
F) Non-occupant Loans on < 5 Family Dwellings (A B C & D)
Number
Average Value
Number
Average Value
Number
Average Value
Number
Average Value
Number
Average Value
LOANS ORIGINATED
2
$128,775
13
$210,789
69
$193,303
2
$22,300
3
$177,453
APPLICATIONS APPROVED, NOT ACCEPTED
0
$0
2
$124,720
7
$155,820
1
$16,220
0
$0
APPLICATIONS DENIED
0
$0
5
$131,114
12
$137,548
1
$10,330
0
$0
APPLICATIONS WITHDRAWN
0
$0
2
$154,735
12
$137,089
1
$12,430
0
$0
FILES CLOSED FOR INCOMPLETENESS
0
$0
1
$100,320
2
$127,335
0
$0
0
$0
Aggregated Statistics For Year 2001 (Based on 2 partial tracts)
A) FHA, FSA/RHS & VA Home Purchase Loans
B) Conventional Home Purchase Loans
C) Refinancings
D) Home Improvement Loans
F) Non-occupant Loans on < 5 Family Dwellings (A B C & D)
Number
Average Value
Number
Average Value
Number
Average Value
Number
Average Value
Number
Average Value
LOANS ORIGINATED
2
$127,465
15
$154,876
51
$171,992
3
$61,520
2
$199,470
APPLICATIONS APPROVED, NOT ACCEPTED
0
$0
2
$184,560
5
$135,876
1
$16,220
0
$0
APPLICATIONS DENIED
0
$0
6
$40,832
12
$124,903
2
$17,005
0
$0
APPLICATIONS WITHDRAWN
0
$0
1
$318,370
8
$120,679
0
$0
0
$0
FILES CLOSED FOR INCOMPLETENESS
0
$0
0
$0
2
$171,215
0
$0
0
$0
Aggregated Statistics For Year 2000 (Based on 2 partial tracts)
A) FHA, FSA/RHS & VA Home Purchase Loans
B) Conventional Home Purchase Loans
C) Refinancings
D) Home Improvement Loans
F) Non-occupant Loans on < 5 Family Dwellings (A B C & D)
Number
Average Value
Number
Average Value
Number
Average Value
Number
Average Value
Number
Average Value
LOANS ORIGINATED
3
$103,810
21
$171,298
17
$119,636
3
$21,017
3
$169,560
APPLICATIONS APPROVED, NOT ACCEPTED
0
$0
3
$97,533
3
$107,430
1
$28,510
0
$0
APPLICATIONS DENIED
1
$35,580
14
$46,677
6
$119,682
2
$20,730
0
$0
APPLICATIONS WITHDRAWN
0
$0
1
$110,920
3
$98,360
0
$0
0
$0
FILES CLOSED FOR INCOMPLETENESS
0
$0
0
$0
1
$75,730
0
$0
0
$0
Aggregated Statistics For Year 1999 (Based on 1 partial tract)
A) FHA, FSA/RHS & VA Home Purchase Loans
B) Conventional Home Purchase Loans
C) Refinancings
D) Home Improvement Loans
F) Non-occupant Loans on < 5 Family Dwellings (A B C & D)
Detailed PMIC statistics for the following Tracts:8001.00
2002 - 2018 National Fire Incident Reporting System (NFIRS) incidents
Based on the data from the years 2002 - 2018 the average number of fire incidents per year is 10. The highest number of reported fire incidents - 25 took place in 2004, and the least - 1 in 2002. The data has an increasing trend.
When looking into fire subcategories, the most incidents belonged to: Structure Fires (58.0%), and Outside Fires (27.8%).
Fire incident types reported to NFIRS in Zip Code 63039


 Nearest zip codes: 63055, 63089, 63069, 63073, 63332, 63015.


 Based on the data from the years 2002 - 2018 the average number of fire incidents per year is 10. The highest number of reported fire incidents - 25 took place in 2004, and the least - 1 in 2002. The data has an increasing trend.
 When looking into fire subcategories, the most incidents belonged to: Structure Fires (58.0%), and Outside Fires (27.8%).