Estimated zip code population in 2022: 25,561 Zip code population in 2010: 23,940 Zip code population in 2000: 21,978
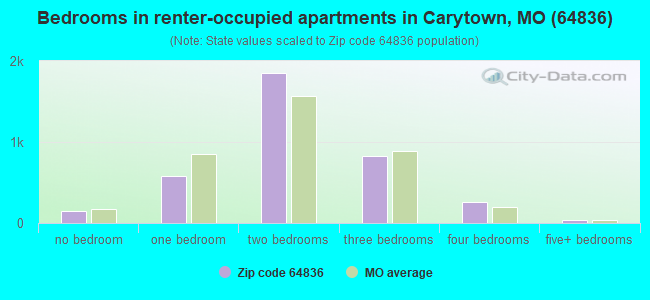
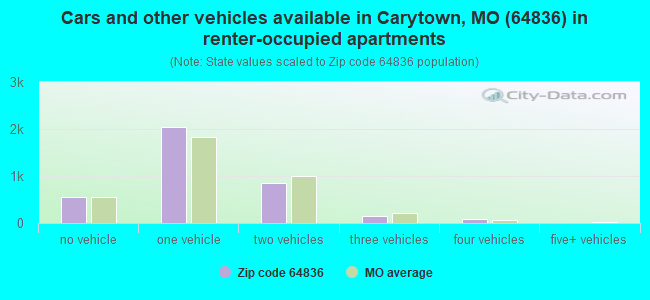
Houses and condos: 10,489 Renter-occupied apartments: 3,688
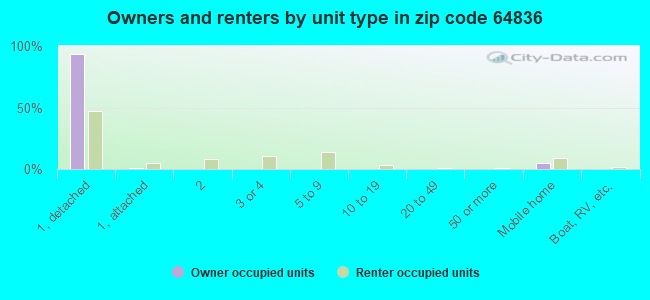
% of renters here:
38%
State:
32%
March 2022 cost of living index in zip code 64836: 82.6 (low, U.S. average is 100)
Land area: 182.1 sq. mi. Water area: 0.7 sq. mi.
Population density: 140 people per square mile
(very low).
OSM Map
General Map
Google Map
MSN Map
OSM Map
General Map
Google Map
MSN Map
OSM Map
General Map
Google Map
MSN Map
OSM Map
General Map
Google Map
MSN Map
Please wait while loading the map...
Real estate property taxes paid for housing units in 2022:
This zip code:
0.7% ($1,233)
Missouri:
0.8% ($1,810)
Median real estate property taxes paid for housing units with mortgages in 2022: $1,303 (0.8%) Median real estate property taxes paid for housing units with no mortgage in 2022: $1,099 (0.7%)
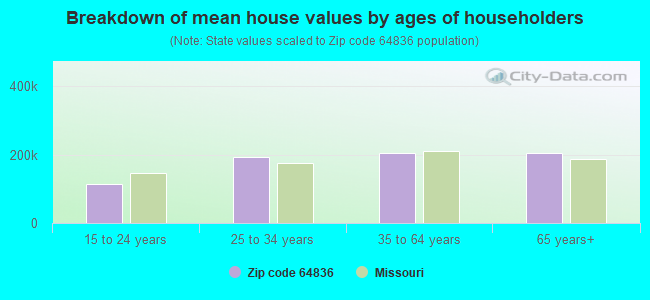
Estimated median house/condo value in 2022: $167,065
64836:
$167,065
Missouri:
$221,200
According to our research of Missouri and other state lists, there were 80 registered sex offenders living in 64836 zip code as of April 27, 2024. The ratio of all residents to sex offenders in zip code 64836 is 295 to 1. The ratio of registered sex offenders to all residents in this zip code is near the state average.
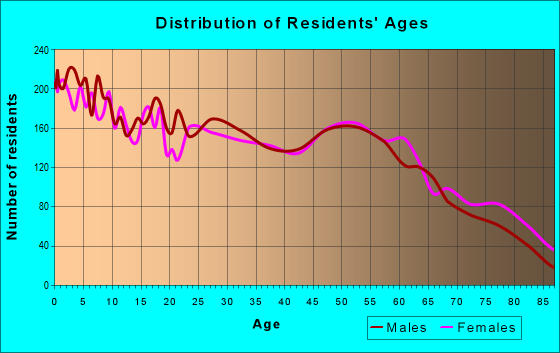
Median resident age:
This zip code:
36.3 years
Missouri median age:
39.1 years
Average household size:
This zip code:
2.6 people
Missouri:
2.4 people
Averages for the 2020 tax year for zip code 64836, filed in 2021:
Average Adjusted Gross Income (AGI) in 2020: $52,291 (Individual Income Tax Returns)
Here:
$52,291
State:
$68,151
Salary/wage: $45,383 (reported on 81.2% of returns)
Here:
$45,383
State:
$56,131
(% of AGI for various income ranges: 1274.3% for AGIs below $25k, 3861.9% for AGIs $25k-50k, 6450.6% for AGIs $50k-75k, 9918.8% for AGIs $75k-100k, 18031.8% for AGIs $100k-200k, 108188.0% for AGIs over 200k)
Taxable interest for individuals: $1,469 (reported on 23.4% of returns)
This zip code:
$1,469
Missouri:
$1,586
(% of AGI for various income ranges: 18.2% for AGIs below $25k, 16.5% for AGIs $25k-50k, 42.5% for AGIs $50k-75k, 64.8% for AGIs $75k-100k, 145.6% for AGIs $100k-200k, 2558.0% for AGIs over 200k)
Ordinary dividends: $11,335 (reported on 16.9% of returns)
Here:
$11,335
State:
$10,947
(% of AGI for various income ranges: 29.7% for AGIs below $25k, 43.7% for AGIs $25k-50k, 122.6% for AGIs $50k-75k, 226.0% for AGIs $75k-100k, 649.6% for AGIs $100k-200k, 26138.0% for AGIs over 200k)
Net capital gain/loss in AGI: +$19,076 (reported on 14.4% of returns)
Here:
+$19,076
State:
+$18,453
(% of AGI for various income ranges: 12.9% for AGIs below $25k, 25.4% for AGIs $25k-50k, 103.3% for AGIs $50k-75k, 273.0% for AGIs $75k-100k, 850.7% for AGIs $100k-200k, 43906.0% for AGIs over 200k)
Profit/loss from business: +$10,883 (reported on 13.5% of returns)
Here:
+$10,883
State:
+$12,260
(% of AGI for various income ranges: 111.9% for AGIs below $25k, 112.7% for AGIs $25k-50k, 215.0% for AGIs $50k-75k, 200.5% for AGIs $75k-100k, 643.6% for AGIs $100k-200k, 6954.0% for AGIs over 200k)
Taxable individual retirement arrangement distribution: $16,359 (reported on 8.2% of returns)
64836:
$16,359
Missouri:
$19,719
(% of AGI for various income ranges: 54.5% for AGIs below $25k, 66.0% for AGIs $25k-50k, 170.9% for AGIs $50k-75k, 373.0% for AGIs $75k-100k, 993.1% for AGIs $100k-200k, 5242.0% for AGIs over 200k)
Total itemized deductions: $40,634 (reported on 3.8% of returns)
Here:
$40,634
State:
$36,651
(% of AGI for various income ranges: 31.4% for AGIs below $25k, 36.1% for AGIs $25k-50k, 152.1% for AGIs $50k-75k, 343.7% for AGIs $75k-100k, 872.9% for AGIs $100k-200k, 14378.0% for AGIs over 200k)
Charity contributions: $19,465 (reported on 3.2% of returns)
Here:
$19,465
State:
$15,671
(% of AGI for various income ranges: 4.4% for AGIs below $25k, 51.2% for AGIs $50k-75k, 121.8% for AGIs $75k-100k, 337.3% for AGIs $100k-200k, 7336.0% for AGIs over 200k)
Taxes paid: $6,459 (reported on 3.8% of returns)
64836:
$6,459
State:
$7,608
(% of AGI for various income ranges: 1.5% for AGIs below $25k, 4.0% for AGIs $25k-50k, 21.7% for AGIs $50k-75k, 59.7% for AGIs $75k-100k, 186.9% for AGIs $100k-200k, 2130.0% for AGIs over 200k)
Earned income credit: $2,504 (reported on 20.7% of returns)
Here:
$2,504
State:
$2,315
(% of AGI for various income ranges: 118.4% for AGIs below $25k, 91.7% for AGIs $25k-50k, 2.9% for AGIs $50k-75k)
Percentage of individuals using paid preparers for their 2020 taxes: 94.1%
Here:
94%
State:
93%
(% for various income ranges: 93.0% for AGIs below $25k, 95.1% for AGIs $25k-50k, 94.9% for AGIs $50k-75k, 93.5% for AGIs $75k-100k, 94.3% for AGIs $100k-200k, 95.5% for AGIs over 200k)
Averages for the 2012 tax year for zip code 64836, filed in 2013:
Average Adjusted Gross Income (AGI) in 2012: $46,405 (Individual Income Tax Returns)
Here:
$46,405
State:
$55,896
Salary/wage: $39,200 (reported on 84.9% of returns)
Here:
$39,200
State:
$46,205
(% of AGI for various income ranges: 78.6% for AGIs below $25k, 83.6% for AGIs $25k-50k, 78.1% for AGIs $50k-75k, 77.0% for AGIs $75k-100k, 71.1% for AGIs $100k-200k, 47.9% for AGIs over 200k)
Taxable interest for individuals: $1,507 (reported on 25.7% of returns)
This zip code:
$1,507
Missouri:
$1,559
(% of AGI for various income ranges: 1.5% for AGIs below $25k, 0.7% for AGIs $25k-50k, 0.7% for AGIs $50k-75k, 0.7% for AGIs $75k-100k, 0.9% for AGIs $100k-200k, 0.8% for AGIs over 200k)
Ordinary dividends: $10,901 (reported on 19.2% of returns)
Here:
$10,901
State:
$7,410
(% of AGI for various income ranges: 1.8% for AGIs below $25k, 1.3% for AGIs $25k-50k, 2.1% for AGIs $50k-75k, 1.6% for AGIs $75k-100k, 3.9% for AGIs $100k-200k, 13.5% for AGIs over 200k)
Net capital gain/loss in AGI: +$7,978 (reported on 13.5% of returns)
Here:
+$7,978
State:
+$11,579
(% of AGI for various income ranges: 0.4% for AGIs below $25k, 0.6% for AGIs $25k-50k, 0.8% for AGIs $50k-75k, 1.3% for AGIs $75k-100k, 2.2% for AGIs $100k-200k, 7.1% for AGIs over 200k)
Profit/loss from business: +$12,064 (reported on 14.5% of returns)
Here:
+$12,064
State:
+$11,688
(% of AGI for various income ranges: 6.1% for AGIs below $25k, 2.6% for AGIs $25k-50k, 2.3% for AGIs $50k-75k, 3.3% for AGIs $75k-100k, 3.5% for AGIs $100k-200k, 5.3% for AGIs over 200k)
Taxable individual retirement arrangement distribution: $11,247 (reported on 8.8% of returns)
64836:
$11,247
Missouri:
$14,773
(% of AGI for various income ranges: 2.6% for AGIs below $25k, 1.9% for AGIs $25k-50k, 1.9% for AGIs $50k-75k, 2.8% for AGIs $75k-100k, 3.1% for AGIs $100k-200k, 1.3% for AGIs over 200k)
Self-employment retirement plans: $21,700 (reported on 0.3% of returns)
64836:
$21,700
Missouri:
$20,502
(% of AGI for various income ranges: 0.9% for AGIs $100k-200k)
Total itemized deductions: $24,515 (21% of AGI, reported on 18.7% of returns)
Here:
$24,515
State:
$22,730
Here:
21.0% of AGI
State:
19.2% of AGI
(% of AGI for various income ranges: 6.7% for AGIs below $25k, 6.0% for AGIs $25k-50k, 7.5% for AGIs $50k-75k, 11.2% for AGIs $75k-100k, 13.4% for AGIs $100k-200k, 14.5% for AGIs over 200k)
Charity contributions: $7,242 (reported on 13.9% of returns)
Here:
$7,242
State:
$4,745
(% of AGI for various income ranges: 0.7% for AGIs below $25k, 0.8% for AGIs $25k-50k, 1.6% for AGIs $50k-75k, 2.5% for AGIs $75k-100k, 3.2% for AGIs $100k-200k, 3.9% for AGIs over 200k)
Taxes paid: $7,398 (reported on 18.6% of returns)
64836:
$7,398
State:
$8,399
(% of AGI for various income ranges: 0.9% for AGIs below $25k, 1.0% for AGIs $25k-50k, 1.6% for AGIs $50k-75k, 3.1% for AGIs $75k-100k, 4.5% for AGIs $100k-200k, 6.2% for AGIs over 200k)
Earned income credit: $2,356 (reported on 23.4% of returns)
Here:
$2,356
State:
$2,288
(% of AGI for various income ranges: 6.9% for AGIs below $25k, 1.6% for AGIs $25k-50k)
Percentage of individuals using paid preparers for their 2012 taxes: 60.6%
Here:
61%
State:
55%
(% for various income ranges: 57.1% for AGIs below $25k, 62.8% for AGIs $25k-50k, 61.3% for AGIs $50k-75k, 62.5% for AGIs $75k-100k, 67.3% for AGIs $100k-200k, 81.2% for AGIs over 200k)
Averages for the 2004 tax year for zip code 64836, filed in 2005:
Average Adjusted Gross Income (AGI) in 2004: $37,107 (Individual Income Tax Returns)
Here:
$37,107
State:
$44,591
Salary/wage: $32,201 (reported on 84.4% of returns)
Here:
$32,201
State:
$38,941
(% of AGI for various income ranges: 127.0% for AGIs below $10k, 78.8% for AGIs $10k-25k, 83.0% for AGIs $25k-50k, 80.5% for AGIs $50k-75k, 75.5% for AGIs $75k-100k, 51.0% for AGIs over 100k)
Taxable interest for individuals: $2,073 (reported on 37.0% of returns)
This zip code:
$2,073
Missouri:
$1,801
(% of AGI for various income ranges: 8.6% for AGIs below $10k, 2.7% for AGIs $10k-25k, 1.5% for AGIs $25k-50k, 1.7% for AGIs $50k-75k, 1.2% for AGIs $75k-100k, 2.5% for AGIs over 100k)
Taxable dividends: $5,098 (reported on 25.2% of returns)
Here:
$5,098
State:
$3,677
(% of AGI for various income ranges: 4.9% for AGIs below $10k, 1.5% for AGIs $10k-25k, 1.2% for AGIs $25k-50k, 1.3% for AGIs $50k-75k, 2.2% for AGIs $75k-100k, 8.6% for AGIs over 100k)
Net capital gain/loss: +$9,207 (reported on 19.1% of returns)
Here:
+$9,207
State:
+$8,915
(% of AGI for various income ranges: 7.8% for AGIs below $10k, 1.1% for AGIs $10k-25k, 1.1% for AGIs $25k-50k, 1.6% for AGIs $50k-75k, 2.9% for AGIs $75k-100k, 12.9% for AGIs over 100k)
Profit/loss from business: +$9,112 (reported on 15.8% of returns)
Here:
+$9,112
State:
+$9,793
(% of AGI for various income ranges: 3.5% for AGIs below $10k, 4.6% for AGIs $10k-25k, 3.1% for AGIs $25k-50k, 2.1% for AGIs $50k-75k, 4.2% for AGIs $75k-100k, 5.5% for AGIs over 100k)
IRA payment deduction: $3,157 (reported on 2.3% of returns)
64836:
$3,157
Missouri:
$2,972
(% of AGI for various income ranges: 0.2% for AGIs $10k-25k, 0.2% for AGIs $25k-50k, 0.2% for AGIs $50k-75k, 0.3% for AGIs $75k-100k, 0.2% for AGIs over 100k)
Self-employed pension: $14,576 (reported on 0.4% of returns)
Here:
$14,576
Missouri:
$14,365
Total itemized deductions: $18,010 (21% of AGI, reported on 20.9% of returns)
Here:
$18,010
State:
$18,261
Here:
21.1% of AGI
State:
20.5% of AGI
(% of AGI for various income ranges: 13.6% for AGIs below $10k, 6.4% for AGIs $10k-25k, 7.1% for AGIs $25k-50k, 10.2% for AGIs $50k-75k, 13.0% for AGIs $75k-100k, 13.6% for AGIs over 100k)
Charity contributions deductions: $5,555 (6% of AGI, reported on 16.9% of returns)
Here:
$5,555
State:
$3,665
Here:
5.9% of AGI
State:
3.9% of AGI
(% of AGI for various income ranges: 0.7% for AGIs below $10k, 0.9% for AGIs $10k-25k, 1.2% for AGIs $25k-50k, 2.1% for AGIs $50k-75k, 2.4% for AGIs $75k-100k, 5.1% for AGIs over 100k)
Total tax: $5,447 (reported on 68.6% of returns)
64836:
$5,447
State:
$6,999
(% of AGI for various income ranges: 3.5% for AGIs below $10k, 3.6% for AGIs $10k-25k, 6.0% for AGIs $25k-50k, 8.0% for AGIs $50k-75k, 10.6% for AGIs $75k-100k, 19.0% for AGIs over 100k)
Earned income credit: $1,817 (reported on 22.0% of returns)
Here:
$1,817
State:
$1,728
Percentage of individuals using paid preparers for their 2004 taxes: 68.5%
Here:
69%
State:
62%
(% for various income ranges: 60.9% for AGIs below $10k, 71.9% for AGIs $10k-25k, 70.5% for AGIs $25k-50k, 66.9% for AGIs $50k-75k, 66.7% for AGIs $75k-100k, 79.0% for AGIs over 100k)
Likely homosexual households (counted as self-reported same-sex unmarried-partner households)
Lesbian couples: 0.0% of all households
Gay men: 0.4% of all households
Household received Food Stamps/SNAP in the past 12 months: 1,524 Household did not receive Food Stamps/SNAP in the past 12 months: 8,080
Women who had a birth in the past 12 months: 291 (218 now married, 69 unmarried) Women who did not have a birth in the past 12 months: 5,994 (2,676 now married, 3,314 unmarried)
Housing units in zip code 64836 with a mortgage: 3,628 (279 second mortgage, 1 home equity loan, 255 both second mortgage and home equity loan) Houses without a mortgage: 125
Median monthly owner costs for units with a mortgage: $1,117 Median monthly owner costs for units without a mortgage: $457
Residents with income below the poverty level in 2022:
This zip code:
26.0%
Whole state:
13.2%
Residents with income below 50% of the poverty level in 2022:
This zip code:
13.2%
Whole state:
6.8%
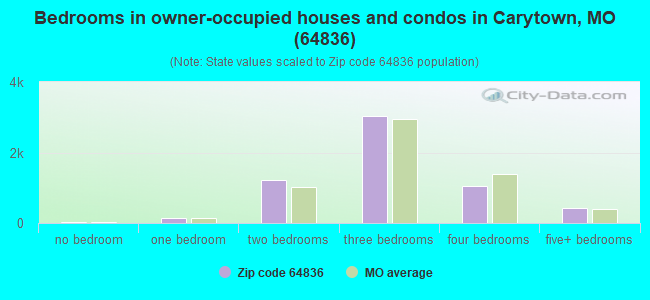
Median number of rooms in houses and condos:
Here:
6.3
State:
6.4
Median number of rooms in apartments:
Here:
4.4
State:
4.4
Notable locations in this zip code not listed on our city pages
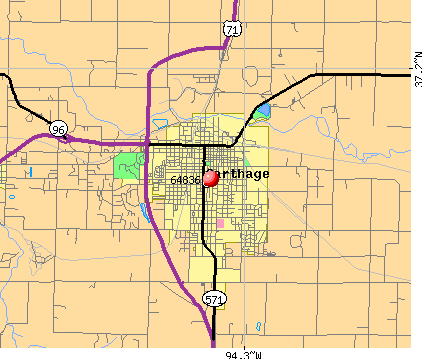
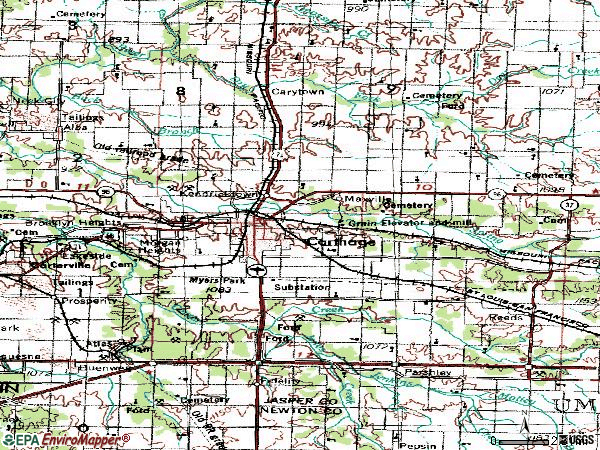
Notable locations in zip code 64836: Cyokamo Camp (A), Camp Putnam (B), Edwin (C), Knells Park (D), Mansur (E), Midway (F), Moss Springs Picnic Area (G), Carthage Fire Department (H). Display/hide their locations on the map
Churches in zip code 64836 include: Emanuel Church (A), Fairview Church (B), Pleasant View Church (C), Lakeside Church (D), Union Chapel (E), Atlas Church (F), Bethany Church (G), Bethel Church (H), Center Church (I). Display/hide their locations on the map
Cemeteries: Jasper Cemetery (1), Grey Cemetery (2), Hackney Cemetery (3), Fairview Cemetery (4), Fasken Cemetery (5), Fidelity Cemetery (6), Moss Springs Cemetery (7). Display/hide their locations on the map
Streams, rivers, and creeks: Dry Fork (A), Deer Creek (B), Stony Branch (C), Jones Creek (D), Jenkins Creek (E), Grove Creek (F), Fidelity Branch (G). Display/hide their locations on the map
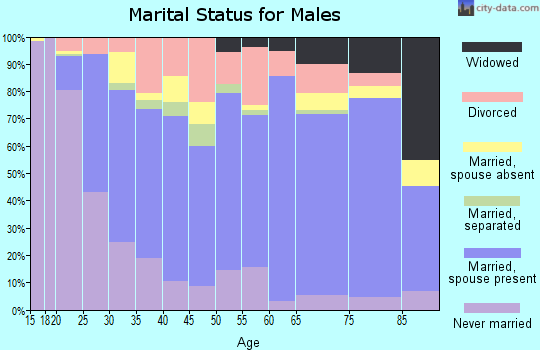
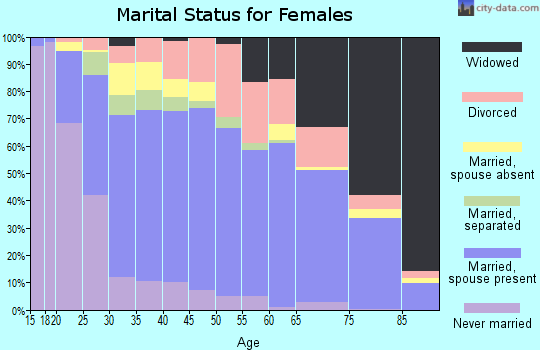
4,032 married couples with children.
1,837 single-parent households (314 men, 1,523 women).
81.0% of residents of 64836 zip code speak English at home.
17.9% of residents speak Spanish at home (49% very well, 21% well, 16% not well, 14% not at all).
0.1% of residents speak other Indo-European language at home (100% very well).
0.6% of residents speak Asian or Pacific Island language at home (71% very well, 20% well, 9% not well).
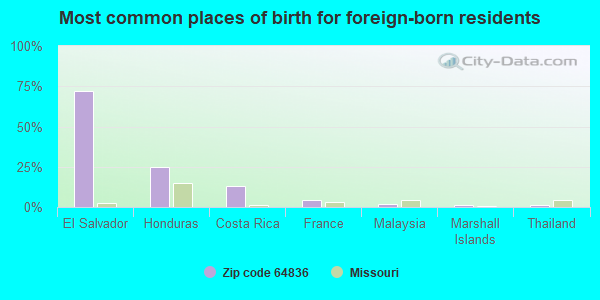
Foreign born population: 2,445 (9.6%) (28.4% of them are naturalized citizens)
This zip code:
9.6%
Whole state:
4.1%
72%El Salvador
25%Honduras
13%Costa Rica
4%France
2%Malaysia
1%Marshall Islands
1%Thailand
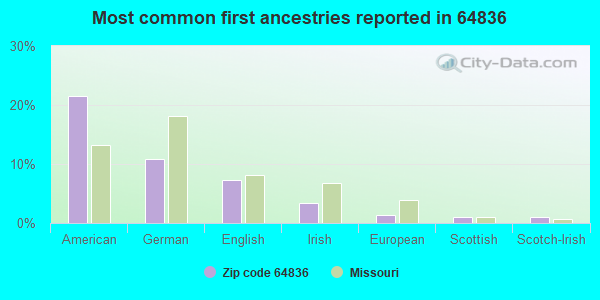
22%American
11%German
7%English
3%Irish
1%European
1%Scottish
1%Scotch-Irish
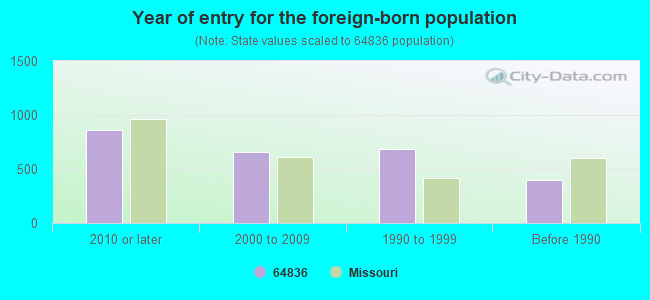
Year of entry for the foreign-born population
8642010 or later
6562000 to 2009
6811990 to 1999
395Before 1990
Major facilities with environmental interests located in this zip code:
AMERICOLD LOGISTICS (1331 CIVIL WAR AVENUE in CARTHAGE, MO)
(Integrated Compliance Information System) - ICIS-07-2000-0001, FORMAL ENFORCEMENT ACTION, ICIS-07-2006-0053, ENFORCEMENT/COMPLIANCE ACTIVITY STATE MASTER (Missouri monitoring and compilance) - ICIS-5588, ENFORCEMENT/COMPLIANCE ACTIVITY, RCRAINFO-MOD985806637, NOT IN A UNIVERSE, PCS-MOR103204, NPDES NON-MAJOR STATE MASTER (Missouri monitoring and compilance) - PCS-MO0002381, NPDES NON-MAJOR, PCS-MOG490244, National Pollutant Discharge Elimination System NON-MAJOR (Tracking pollutant discharge elimination systems) - permit (Resource Conservation and Recovery Act (tracking hazardous waste)) Business SIC classification: CRUSHED AND BROKEN LIMESTONE; HEAVY CONSTRUCTION Organizations: VC CARTHAGE LLC DBA AMERICOLD LOGISTICS (CONTACT/OWNER)
Alternative names: AMERICOLD LOGISTICS PLANT NUMBER 81302
BLEVINS ASPHALT CONSTRUCTION CO. INC. - CARTHAGE (HWY. 71 & N. CIVIL WAR RD. in CARTHAGE, MO)
AIR MINOR (AIRS/AFS) - ICIS-, ENFORCEMENT/COMPLIANCE ACTIVITY STATE MASTER (Missouri monitoring and compilance) - TRIS-64836BLVNSHWY71, TRI REPORTER, AIRS/AFS-MO1001672, AIR MINOR, PCS-MOG490765, NPDES NON-MAJOR National Pollutant Discharge Elimination System NON-MAJOR (Tracking pollutant discharge elimination systems) - permit TRI REPORTER (Tracking of toxic chemicals releasing facilities) Business SIC classification: ASPHALT PAVING MIXTURES AND BLOCKS; CONCRETE PRODUCTS, EXCEPT BLOCK AND BRICK Organizations: BLEVINS ASPHALT CONST CO (CONTACT/OWNER)
Alternative names: BLEVINS ASPHALT - CARTHAGE CIVIL WAR RD, BLEVINS ASPHALT CONSTR CO
H E WILLIAMS INCORPORATED (831 WEST FAIRVIEW AVENUE in CARTHAGE, MO)
AIR MINOR (AIRS/AFS) STATE MASTER (Missouri monitoring and compilance) - TRIS-64836HWLLM831WF, TRI REPORTER, AIRS/AFS-MO0061507, AIR MINOR, RCRAINFO-MOD007158363, CESQG, PCS-MOR203010, NPDES NON-MAJOR, NEI-NTI34390, AIR PROGRAM, NTI-NTI34390, CRITERIA AND HAZARDOUS AIR POLLUTANT INVENTORY (Inventory of air pollution sources) National Pollutant Discharge Elimination System NON-MAJOR (Tracking pollutant discharge elimination systems) - permit Conditionally Exempt Small Quantity Generators, less than 100 kg/month of hazardous waste (Resource Conservation and Recovery Act (tracking hazardous waste)) TRI REPORTER (Tracking of toxic chemicals releasing facilities) Business SIC classification: ELECTRIC LAMP BULBS AND TUBES; RESIDENTIAL ELECTRIC LIGHTING FIXTURES; COMMERCIAL, INDUSTRIAL, AND INSTITUTIONAL ELECTRIC LIGHTING FIXTURES Business NAICS classification: RESIDENTIAL ELECTRIC LIGHTING FIXTURE MANUFACTURING. Organizations: MARK WILLIAMS (CONTACT/OWNER)
BUTTERBALL TURKEY COMPANY (411 NORTH MAIN STREET in CARTHAGE, MO)
AIR MINOR (AIRS/AFS) ENFORCEMENT/COMPLIANCE ACTIVITY (Integrated Compliance Information System) STATE MASTER (Missouri monitoring and compilance) - TRIS-64836CNGRT411NO, TRI REPORTER, NCDB-I07#19880127R7005 2, COMPLIANCE ACTIVITY, PCS-MO0082767, NPDES NON-MAJOR, AIRS/AFS-MO0966932, AIR MINOR, RCRAINFO-MOD985798545, CESQG, TRANSPORTER, NTI-NTIT$FNP0754, AIR PROGRAM COMPLIANCE ACTIVITY (Tracking inspections of insecticide, fungicide, and rodenticide, and toxic substances) National Pollutant Discharge Elimination System NON-MAJOR (Tracking pollutant discharge elimination systems) - permit Conditionally Exempt Small Quantity Generators, less than 100 kg/month of hazardous waste (Resource Conservation and Recovery Act (tracking hazardous waste)) - notification TRANSPORTER (Resource Conservation and Recovery Act (tracking hazardous waste)) - notification TRI REPORTER (Tracking of toxic chemicals releasing facilities) Business SIC classification: POULTRY SLAUGHTERING AND PROCESSING Organizations: BUTTERBALL LLC (CONTACT/OWNER)
Alternative names: BUTTERBALL TURKEY CO QA LAB, COUNTRY PRIDE FOODS LIMITED, CON AGRA FOODS - CARTHAGE POULTRY PROC, CONAGRA TURKEY CO, SMITHFIELD FOODS-CARTHAGE POULTRY PRCSSG
ADM MILLING DBA CARTHAGE FLOUR MILL (323 MERIDIAN STREET in CARTHAGE, MO)
AIR SYNTHETIC MINOR (AIRS/AFS) STATE MASTER (Missouri monitoring and compilance) - NEI-290970011, AIR PROGRAM, NET-290970011, TRIS-64836DMMLL323ME, TRI REPORTER, RCRAINFO-MO0000119313, CESQG, AIRS/AFS-MO0061458, AIR SYNTHETIC MINOR, AIRS/AFS-MO0903979, AIR MINOR, PCS-MOR12A036, NPDES NON-MAJOR CRITERIA AND HAZARDOUS AIR POLLUTANT INVENTORY (Inventory of air pollution sources) National Pollutant Discharge Elimination System NON-MAJOR (Tracking pollutant discharge elimination systems) - permit Conditionally Exempt Small Quantity Generators, less than 100 kg/month of hazardous waste (Resource Conservation and Recovery Act (tracking hazardous waste)) TRI REPORTER (Tracking of toxic chemicals releasing facilities) Business SIC classification: NATURAL, PROCESSED, AND IMITATION CHEESE; ICE CREAM AND FROZEN DESSERTS; FLOUR AND OTHER GRAIN MILL PRODUCTS Business NAICS classification: FLOUR MILLING.; FLOUR MILLING. Organizations: ADM MILLING COMPANY (CONTACT/OWNER)
, ADM MILLING CO (CONTACT/OWNER)
Alternative names: A D M MILLING CO, ADM MILLING CO, ADM MILLING CO, CARTHAGE, ADM MILLING CO.,CARTHAGE FLOUR MILL, ARCHER DANIELS MIDLAND MILLING COMPANY CARTHAGE FLOUR MILL
FAST ONE HOUR CLEANERS (1101 GRAND AVE in CARTHAGE, MO)
AIR MINOR (AIRS/AFS) STATE MASTER (Missouri monitoring and compilance) - RCRAINFO-MO0000262014, CESQG, AIRS/AFS-MO0953995, AIR MINOR, NEI-NTI34389, AIR PROGRAM, NTI-NTI34389, CRITERIA AND HAZARDOUS AIR POLLUTANT INVENTORY (Inventory of air pollution sources) Conditionally Exempt Small Quantity Generators, less than 100 kg/month of hazardous waste (Resource Conservation and Recovery Act (tracking hazardous waste)) - notification Business SIC classification: DRYCLEANING PLANTS, EXCEPT RUG CLEANING Business NAICS classification: DRYCLEANING AND LAUNDRY SERVICES (EXCEPT COIN-OPERATED). Organizations: SAMMY FERSON TRUST (CONTACT/OWNER)
Alternative names: B & T'S ONE HOUR CLEANERS
FLEX O LATERS INC (131 LOCUST ST in CARTHAGE, MO)
STATE MASTER (Missouri monitoring and compilance) - NCDB-C07#07-89-215, COMPLIANCE ACTIVITY, NCDB-I07#19890131MO03T 1, RCRAINFO-MOD985792613, NOT IN A UNIVERSE COMPLIANCE ACTIVITY (Tracking inspections of insecticide, fungicide, and rodenticide, and toxic substances) (Resource Conservation and Recovery Act (tracking hazardous waste)) Business SIC classification: STEEL WIREDRAWING AND STEEL NAILS AND SPIKES Business NAICS classification: SPRING (LIGHT GAUGE) MANUFACTURING. Organizations: LEGGETT & PLATT INCORPORATED (CONTACT/OWNER)
Alternative names: FLEX-O-LATORS INC
BUTTERBALL TURKEY CON AGRA (510 N MAIN in CARTHAGE, MO)
ENFORCEMENT/COMPLIANCE ACTIVITY (Integrated Compliance Information System) STATE MASTER (Missouri monitoring and compilance) - RCRAINFO-MOP000019729, NOT IN A UNIVERSE (Resource Conservation and Recovery Act (tracking hazardous waste)) Business NAICS classification: POULTRY PROCESSING.
FLEISNER PROPERTY (I-44 & COUNTY RD 100 in CARTHAGE, MO)
STATE MASTER (Missouri monitoring and compilance) - RCRAINFO-MOP000044404, NOT IN A UNIVERSE (Resource Conservation and Recovery Act (tracking hazardous waste)) Organizations: JERRY FLEISNER (CONTACT/OPERATOR)
ALTRUK FREIGHT SYSTEM (HWY 571 N 1 MI in CARTHAGE, MO)
STATE MASTER (Missouri monitoring and compilance) - RCRAINFO-MOD076251271, SQG (Resource Conservation and Recovery Act (tracking hazardous waste)) Organizations: ROCOR INTERNATIONAL (CONTACT/OWNER)
FELIX WRIGHT (ROUTE 3, BOX 276F, in CARTHAGE, MO)
STATE MASTER (Missouri monitoring and compilance) - PCS-MOG010325, NPDES NON-MAJOR National Pollutant Discharge Elimination System NON-MAJOR (Tracking pollutant discharge elimination systems) - permit Business SIC classification: TURKEYS AND TURKEY EGGS Alternative names: WRIGHT, FELIX
GENERAL INDUSTRIES CO INC (2816 GRAND in CARTHAGE, MO)
STATE MASTER (Missouri monitoring and compilance) - RCRAINFO-MOD196880553, NOT IN A UNIVERSE (Resource Conservation and Recovery Act (tracking hazardous waste)) Organizations: DIGGS RICHARD (CONTACT/OWNER)
BENNETT WILSON (1130 GRAND AVENUE in CARTHAGE, MO)
STATE MASTER (Missouri monitoring and compilance) - PCS-MO0126039, NPDES NON-MAJOR National Pollutant Discharge Elimination System NON-MAJOR (Tracking pollutant discharge elimination systems) - permit Business SIC classification: OPERATORS OF RESIDENTIAL MOBILE HOME SITES Alternative names: WESTGATE MOBILE HOME PARK
Housing units lacking complete plumbing facilities: 0.9% Housing units lacking complete kitchen facilities: 0.8%
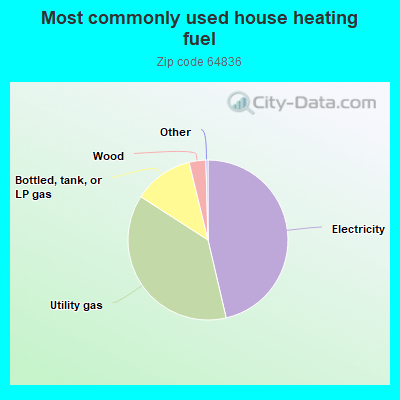
46.4%Electricity
37.8%Utility gas
12.1%Bottled, tank, or LP gas
3.4%Wood
Population in 1990: 19,516. Population change in the 1990s: +2,462 (+12.6%).
Place of birth for U.S.-born residents:
This state: 16,044
Northeast: 143
Midwest: 2,468
South: 2,491
West: 1,757
50% of the 64836 zip code residents lived in the same house 5 years ago. Out of people who lived in different houses, 62% lived in this county. Out of people who lived in different counties, 50% lived in Missouri.
88% of the 64836 zip code residents lived in the same house 1 year ago. Out of people who lived in different houses, 51% moved from this county. Out of people who lived in different houses, 11% moved from different county within same state. Out of people who lived in different houses, 34% moved from different state. Out of people who lived in different houses, 3% moved from abroad.
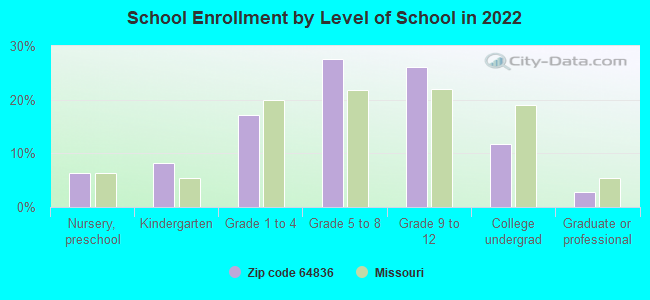
Private vs. public school enrollment:
Students in private schools in grades 1 to 8 (elementary and middle school): 306
Here:
10.3%
Missouri:
15.4%
Students in private schools in grades 9 to 12 (high school): 232
Here:
13.3%
Missouri:
13.9%
Students in private undergraduate colleges: 108
Here:
13.7%
Missouri:
22.6%
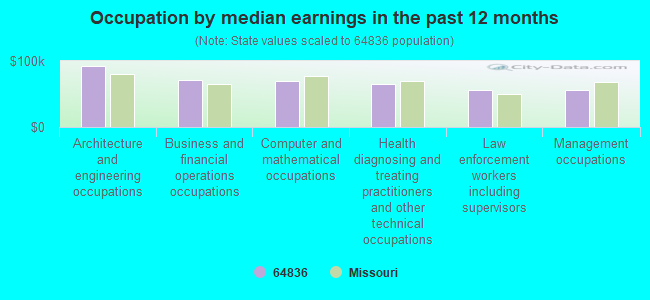
Occupation by median earnings in the past 12 months ($)
91,863Architecture and engineering occupations
70,687Business and financial operations occupations
70,051Computer and mathematical occupations
64,781Health diagnosing and treating practitioners and other technical occupations
56,353Law enforcement workers including supervisors
56,303Management occupations
Companies with federal contracts located in this zip code:
VSSI, INC (208 W CENTRAL AVE in CARTHAGE, MO; small business) : $31,799 in 6 contractsfrom 2004 to 2006
Contracts for Laboratory Equipment and Supplies, Medical and Surgical Instruments, Equipment, and Supplies by Geological Survey, Army, Defense Logistics Agency, Navy, and others Signed by year:2000: $0; 2001: $0; 2002: $0; 2003: $0; 2004: $18,385; 2005: $3,007; 2006: $10,407.
Biggest contracts:
$14,622 with Geological Survey for Laboratory Equipment and Supplies. Signed on 2004-06-14. Completion date: 2004-07-15.
$6,634 with Army for Medical and Surgical Instruments, Equipment, and Supplies. Signed on 2006-06-28. Completion date: 2006-08-18.
$3,763 with Army for Medical and Surgical Instruments, Equipment, and Supplies. Taking place in AL. Signed on 2004-09-11. Completion date: 2004-09-24.
$3,606 with Defense Logistics Agency for Medical and Surgical Instruments, Equipment, and Supplies. Signed on 2006-04-21. Completion date: 2006-05-20.
LABEL INDUSTRIES, INC (221 W 4TH STREET SUITE 1B in CARTHAGE, MO; small business) : $21,581 in 5 contractsfrom 2005 to 2006
Contracts for Hosiery, Handwear, and Clothing Accessories, Men's, Air Conditioning Equipment, Motor Vehicle Maintenance and Repair Shop Specialized Equipment, Hand Tools, Power Driven by Office of Policy, Management and Budget/Chief Financial Officer, Army, National Park Service Signed by year:2000: $0; 2001: $0; 2002: $0; 2003: $0; 2004: $0; 2005: $18,617; 2006: $2,964.
Biggest contracts:
$10,967 with Office of Policy, Management and Budget/Chief Financial Officer for Hosiery, Handwear, and Clothing Accessories, Men's. Signed on 2005-12-07. Completion date: 2006-01-01.
$7,067 with Army for Air Conditioning Equipment. Signed on 2005-09-28. Completion date: 2005-10-07.
$2,964 with Army for Motor Vehicle Maintenance and Repair Shop Specialized Equipment. Signed on 2006-02-28. Completion date: 2006-03-17.
$500 with National Park Service for Hand Tools, Power Driven. Taking place in MT. Signed on 2005-10-18. Completion date: 2005-11-18.
HAZLETT''S (1926 GARRISON AVENUE in CARTHAGE, MO; small business)
$3,451 with Army for Meat, Poultry, and Fish. Signed on 2003-03-12. Completion date: 2003-03-18.
Top industries in this zip code by the number of employees in 2005:
2003 - 2018 National Fire Incident Reporting System (NFIRS) incidents
According to the data from the years 2003 - 2018 the average number of fire incidents per year is 147. The highest number of reported fires - 238 took place in 2006, and the least - 8 in 2003. The data has an increasing trend.
When looking into fire subcategories, the most incidents belonged to: Outside Fires (51.4%), and Structure Fires (34.5%).
Fire incident types reported to NFIRS in Zip Code 64836
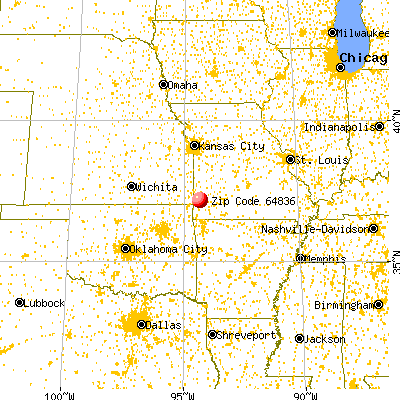


 Nearest zip codes: 64830, 64859, 64833, 64755, 64835, 64857.


 According to the data from the years 2003 - 2018 the average number of fire incidents per year is 147. The highest number of reported fires - 238 took place in 2006, and the least - 8 in 2003. The data has an increasing trend.
 When looking into fire subcategories, the most incidents belonged to: Outside Fires (51.4%), and Structure Fires (34.5%).