Estimated zip code population in 2022: 4,246 Zip code population in 2010: 4,680 Zip code population in 2000: 4,523
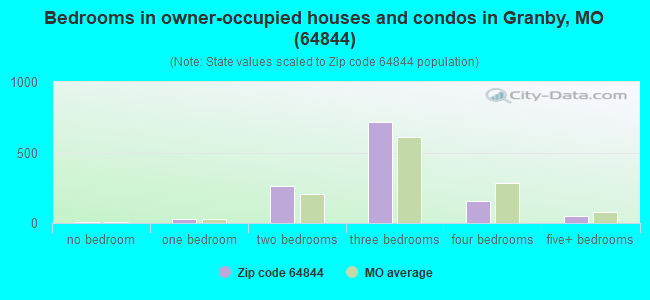
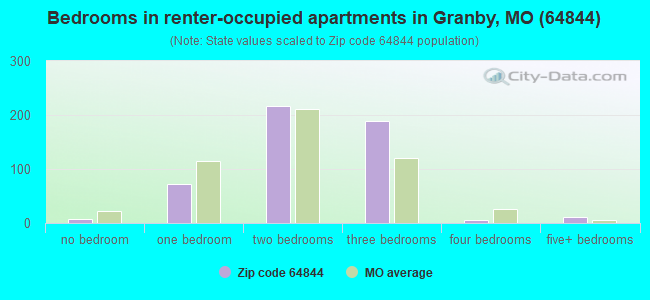
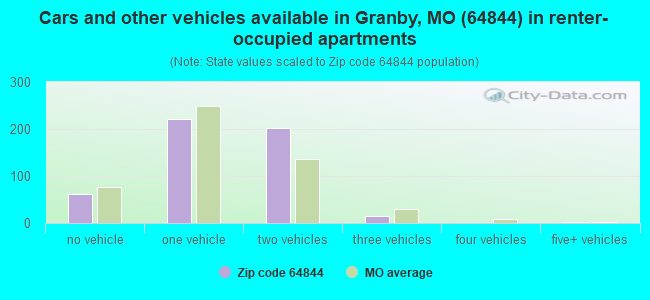
Houses and condos: 1,968 Renter-occupied apartments: 503
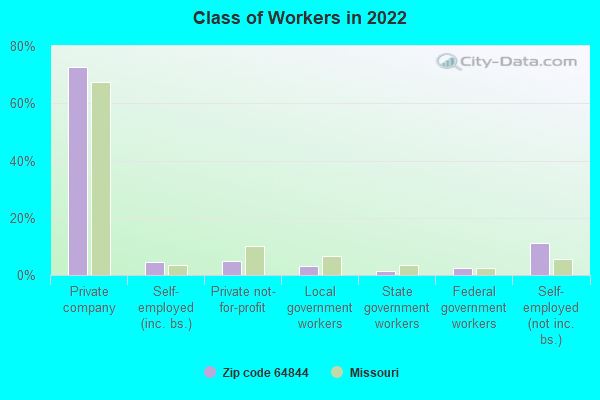
% of renters here:
29%
State:
32%
March 2022 cost of living index in zip code 64844: 76.3 (low, U.S. average is 100)
Land area: 65.2 sq. mi. Water area: 0.2 sq. mi.
Population density: 65 people per square mile
(very low).
OSM Map
General Map
Google Map
MSN Map
OSM Map
General Map
Google Map
MSN Map
OSM Map
General Map
Google Map
MSN Map
OSM Map
General Map
Google Map
MSN Map
Please wait while loading the map...
Real estate property taxes paid for housing units in 2022:
This zip code:
0.6% ($705)
Missouri:
0.8% ($1,810)
Median real estate property taxes paid for housing units with mortgages in 2022: $852 (0.6%) Median real estate property taxes paid for housing units with no mortgage in 2022: $493 (0.6%)
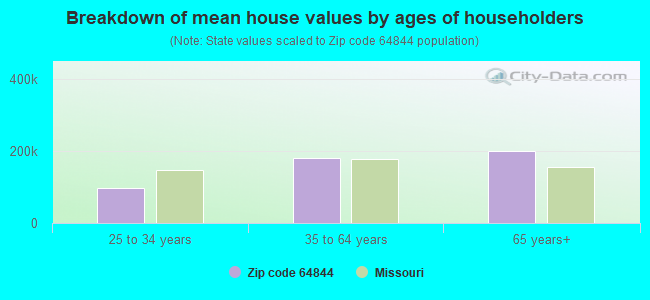
Estimated median house/condo value in 2022: $114,039
64844:
$114,039
Missouri:
$221,200
According to our research of Missouri and other state lists, there were 15 registered sex offenders living in 64844 zip code as of April 27, 2024. The ratio of all residents to sex offenders in zip code 64844 is 314 to 1. The ratio of registered sex offenders to all residents in this zip code is near the state average.
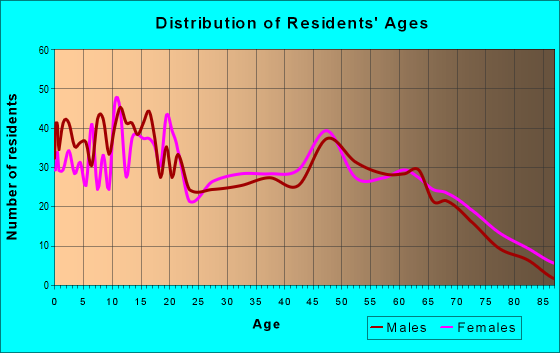
Median resident age:
This zip code:
36.7 years
Missouri median age:
39.1 years
Average household size:
This zip code:
2.4 people
Missouri:
2.4 people
Averages for the 2020 tax year for zip code 64844, filed in 2021:
Average Adjusted Gross Income (AGI) in 2020: $43,363 (Individual Income Tax Returns)
Here:
$43,363
State:
$68,151
Salary/wage: $39,679 (reported on 83.3% of returns)
Here:
$39,679
State:
$56,131
(% of AGI for various income ranges: 1199.8% for AGIs below $25k, 3687.0% for AGIs $25k-50k, 6643.3% for AGIs $50k-75k, 10039.1% for AGIs $75k-100k, 20103.3% for AGIs $100k-200k)
Taxable interest for individuals: $640 (reported on 16.7% of returns)
This zip code:
$640
Missouri:
$1,586
(% of AGI for various income ranges: 11.7% for AGIs below $25k, 12.0% for AGIs $25k-50k, 6.2% for AGIs $50k-75k, 7.3% for AGIs $75k-100k, 95.0% for AGIs $100k-200k)
Ordinary dividends: $1,456 (reported on 8.9% of returns)
Here:
$1,456
State:
$10,947
(% of AGI for various income ranges: 15.2% for AGIs below $25k, 19.8% for AGIs $25k-50k, 9.0% for AGIs $50k-75k, 22.7% for AGIs $75k-100k, 38.3% for AGIs $100k-200k)
Net capital gain/loss in AGI: +$6,462 (reported on 8.9% of returns)
Here:
+$6,462
State:
+$18,453
(% of AGI for various income ranges: 11.5% for AGIs below $25k, 24.5% for AGIs $25k-50k, 41.9% for AGIs $50k-75k, 179.1% for AGIs $75k-100k, 968.3% for AGIs $100k-200k)
Profit/loss from business: +$12,772 (reported on 13.9% of returns)
Here:
+$12,772
State:
+$12,260
(% of AGI for various income ranges: 156.9% for AGIs below $25k, 131.1% for AGIs $25k-50k, 391.0% for AGIs $50k-75k, 1631.7% for AGIs $100k-200k)
Taxable individual retirement arrangement distribution: $8,309 (reported on 6.1% of returns)
64844:
$8,309
Missouri:
$19,719
(% of AGI for various income ranges: 55.4% for AGIs below $25k, 87.3% for AGIs $25k-50k, 220.0% for AGIs $75k-100k)
Total itemized deductions: $34,350 (reported on 2.2% of returns)
Here:
$34,350
State:
$36,651
(% of AGI for various income ranges: 1249.1% for AGIs $75k-100k)
Charity contributions: $11,750 (reported on 1.1% of returns)
Here:
$11,750
State:
$15,671
(% of AGI for various income ranges: 213.6% for AGIs $75k-100k)
Taxes paid: $4,375 (reported on 2.2% of returns)
64844:
$4,375
State:
$7,608
(% of AGI for various income ranges: 291.7% for AGIs $100k-200k)
Earned income credit: $2,439 (reported on 24.4% of returns)
Here:
$2,439
State:
$2,315
(% of AGI for various income ranges: 121.0% for AGIs below $25k, 100.9% for AGIs $25k-50k)
Percentage of individuals using paid preparers for their 2020 taxes: 93.9%
Here:
94%
State:
93%
(% for various income ranges: 91.5% for AGIs below $25k, 94.3% for AGIs $25k-50k, 96.3% for AGIs $50k-75k, 93.8% for AGIs $75k-100k, 100.0% for AGIs $100k-200k)
Averages for the 2012 tax year for zip code 64844, filed in 2013:
Average Adjusted Gross Income (AGI) in 2012: $33,772 (Individual Income Tax Returns)
Here:
$33,772
State:
$55,896
Salary/wage: $31,619 (reported on 84.4% of returns)
Here:
$31,619
State:
$46,205
(% of AGI for various income ranges: 74.7% for AGIs below $25k, 84.7% for AGIs $25k-50k, 86.3% for AGIs $50k-75k, 78.2% for AGIs $75k-100k, 59.1% for AGIs $100k-200k)
Taxable interest for individuals: $1,059 (reported on 17.4% of returns)
This zip code:
$1,059
Missouri:
$1,559
(% of AGI for various income ranges: 0.8% for AGIs below $25k, 0.8% for AGIs $25k-50k, 0.2% for AGIs $50k-75k, 0.6% for AGIs $75k-100k, 0.1% for AGIs $100k-200k)
Ordinary dividends: $1,282 (reported on 10.2% of returns)
Here:
$1,282
State:
$7,410
(% of AGI for various income ranges: 0.8% for AGIs below $25k, 0.5% for AGIs $25k-50k, 0.1% for AGIs $50k-75k, 0.6% for AGIs $75k-100k)
Net capital gain/loss in AGI: +$2,713 (reported on 9.0% of returns)
Here:
+$2,713
State:
+$11,579
(% of AGI for various income ranges: 0.4% for AGIs below $25k, 0.7% for AGIs $25k-50k, 0.4% for AGIs $50k-75k, 2.7% for AGIs $75k-100k)
Profit/loss from business: +$7,696 (reported on 15.6% of returns)
Here:
+$7,696
State:
+$11,688
(% of AGI for various income ranges: 9.2% for AGIs below $25k, 3.8% for AGIs $25k-50k, 3.2% for AGIs $50k-75k)
Taxable individual retirement arrangement distribution: $9,950 (reported on 7.2% of returns)
64844:
$9,950
Missouri:
$14,773
(% of AGI for various income ranges: 3.0% for AGIs below $25k, 1.3% for AGIs $25k-50k, 1.6% for AGIs $50k-75k, 6.3% for AGIs $75k-100k)
Total itemized deductions: $18,804 (29% of AGI, reported on 14.4% of returns)
Here:
$18,804
State:
$22,730
Here:
29.0% of AGI
State:
19.2% of AGI
(% of AGI for various income ranges: 5.8% for AGIs below $25k, 6.2% for AGIs $25k-50k, 7.6% for AGIs $50k-75k, 10.4% for AGIs $75k-100k, 13.3% for AGIs $100k-200k)
Charity contributions: $4,760 (reported on 9.0% of returns)
Here:
$4,760
State:
$4,745
(% of AGI for various income ranges: 0.9% for AGIs below $25k, 1.0% for AGIs $25k-50k, 1.1% for AGIs $50k-75k, 2.0% for AGIs $75k-100k, 2.2% for AGIs $100k-200k)
Taxes paid: $3,658 (reported on 14.4% of returns)
64844:
$3,658
State:
$8,399
(% of AGI for various income ranges: 0.4% for AGIs below $25k, 0.9% for AGIs $25k-50k, 1.6% for AGIs $50k-75k, 2.4% for AGIs $75k-100k, 3.6% for AGIs $100k-200k)
Earned income credit: $2,337 (reported on 30.5% of returns)
Here:
$2,337
State:
$2,288
(% of AGI for various income ranges: 8.7% for AGIs below $25k, 2.0% for AGIs $25k-50k)
Percentage of individuals using paid preparers for their 2012 taxes: 56.3%
Here:
56%
State:
55%
(% for various income ranges: 52.6% for AGIs below $25k, 58.8% for AGIs $25k-50k, 56.5% for AGIs $50k-75k, 66.7% for AGIs $75k-100k, 66.7% for AGIs $100k-200k)
Averages for the 2004 tax year for zip code 64844, filed in 2005:
Average Adjusted Gross Income (AGI) in 2004: $28,934 (Individual Income Tax Returns)
Here:
$28,934
State:
$44,591
Salary/wage: $26,983 (reported on 86.5% of returns)
Here:
$26,983
State:
$38,941
(% of AGI for various income ranges: 88.8% for AGIs below $10k, 81.9% for AGIs $10k-25k, 86.2% for AGIs $25k-50k, 87.6% for AGIs $50k-75k, 77.5% for AGIs $75k-100k, 41.3% for AGIs over 100k)
Taxable interest for individuals: $1,004 (reported on 29.6% of returns)
This zip code:
$1,004
Missouri:
$1,801
(% of AGI for various income ranges: 4.9% for AGIs below $10k, 1.7% for AGIs $10k-25k, 1.1% for AGIs $25k-50k, 0.5% for AGIs $50k-75k, 0.2% for AGIs $75k-100k, 0.2% for AGIs over 100k)
Taxable dividends: $789 (reported on 13.6% of returns)
Here:
$789
State:
$3,677
(% of AGI for various income ranges: 1.6% for AGIs below $10k, 0.5% for AGIs $10k-25k, 0.4% for AGIs $25k-50k, 0.2% for AGIs $50k-75k, 0.2% for AGIs $75k-100k, 0.1% for AGIs over 100k)
Net capital gain/loss: +$3,062 (reported on 13.3% of returns)
Here:
+$3,062
State:
+$8,915
(% of AGI for various income ranges: 3.6% for AGIs below $10k, 1.4% for AGIs $10k-25k, 0.7% for AGIs $25k-50k, 0.7% for AGIs $50k-75k, 6.7% for AGIs $75k-100k)
Profit/loss from business: +$5,129 (reported on 15.7% of returns)
Here:
+$5,129
State:
+$9,793
(% of AGI for various income ranges: 13.8% for AGIs below $10k, 6.1% for AGIs $10k-25k, 2.9% for AGIs $25k-50k, 0.1% for AGIs $50k-75k, 1.2% for AGIs $75k-100k)
IRA payment deduction: $2,680 (reported on 1.5% of returns)
64844:
$2,680
Missouri:
$2,972
Total itemized deductions: $13,718 (24% of AGI, reported on 15.6% of returns)
Here:
$13,718
State:
$18,261
Here:
24.2% of AGI
State:
20.5% of AGI
(% of AGI for various income ranges: 6.3% for AGIs below $10k, 4.6% for AGIs $10k-25k, 6.3% for AGIs $25k-50k, 8.6% for AGIs $50k-75k, 10.4% for AGIs $75k-100k, 11.9% for AGIs over 100k)
Charity contributions deductions: $3,793 (7% of AGI, reported on 11.2% of returns)
Here:
$3,793
State:
$3,665
Here:
6.5% of AGI
State:
3.9% of AGI
(% of AGI for various income ranges: 0.7% for AGIs $10k-25k, 1.2% for AGIs $25k-50k, 1.9% for AGIs $50k-75k, 3.2% for AGIs $75k-100k, 1.9% for AGIs over 100k)
Total tax: $2,937 (reported on 65.7% of returns)
64844:
$2,937
State:
$6,999
(% of AGI for various income ranges: 3.7% for AGIs below $10k, 3.3% for AGIs $10k-25k, 5.5% for AGIs $25k-50k, 7.7% for AGIs $50k-75k, 10.3% for AGIs $75k-100k, 12.8% for AGIs over 100k)
Earned income credit: $1,799 (reported on 27.9% of returns)
Here:
$1,799
State:
$1,728
Percentage of individuals using paid preparers for their 2004 taxes: 69.5%
Here:
70%
State:
62%
(% for various income ranges: 62.2% for AGIs below $10k, 71.8% for AGIs $10k-25k, 71.5% for AGIs $25k-50k, 69.5% for AGIs $50k-75k, 72.7% for AGIs $75k-100k, 87.0% for AGIs over 100k)
Household received Food Stamps/SNAP in the past 12 months: 272 Household did not receive Food Stamps/SNAP in the past 12 months: 1,451
Women who had a birth in the past 12 months: 169 (145 now married, 19 unmarried) Women who did not have a birth in the past 12 months: 784 (402 now married, 380 unmarried)
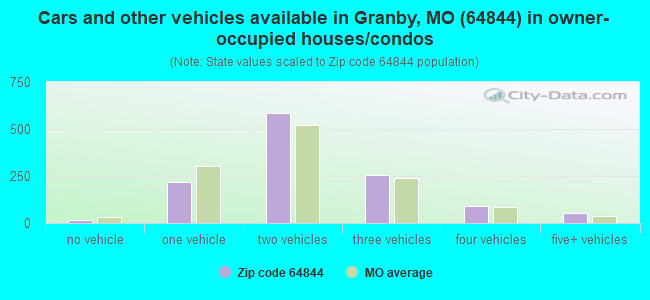
Housing units in zip code 64844 with a mortgage: 644 (15 second mortgage, 14 both second mortgage and home equity loan) Houses without a mortgage: 4
Median monthly owner costs for units with a mortgage: $1,039 Median monthly owner costs for units without a mortgage: $392
Residents with income below the poverty level in 2022:
This zip code:
18.8%
Whole state:
13.2%
Residents with income below 50% of the poverty level in 2022:
This zip code:
7.6%
Whole state:
6.8%
Median number of rooms in houses and condos:
Here:
6.0
State:
6.4
Median number of rooms in apartments:
Here:
4.9
State:
4.4
Notable locations in this zip code not listed on our city pages
Cemeteries: Greenwood Cemetery (1), Hazelgreen Cemetery (2), Mount Zion Cemetery (3), Powers Cemetery (4), Brown Cemetery (5), Ivie Cemetery (6), Granby Memorial Cemetery (7). Display/hide their locations on the map
In group quarters: 50 (-1 institutionalized population)
Size of family households: 562 2-persons, 385 3-persons, 172 4-persons, 75 5-persons, 47 6-persons, 17 7-or-more-persons
Size of nonfamily households: 412 1-person, 47 2-persons, 3 3-persons
642 married couples with children.
242 single-parent households (39 men, 203 women).
98.0% of residents of 64844 zip code speak English at home.
0.7% of residents speak Spanish at home (100% very well).
0.1% of residents speak other Indo-European language at home (100% very well).
0.7% of residents speak Asian or Pacific Island language at home (38% very well, 62% not well).
0.2% of residents speak other language at home (100% very well).
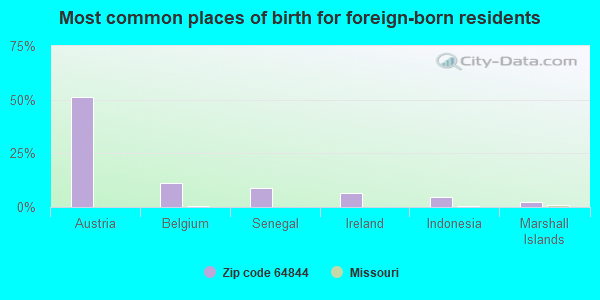
Foreign born population: 46 (1.1%) (70.4% of them are naturalized citizens)
This zip code:
1.1%
Whole state:
4.1%
51%Austria
11%Belgium
9%Senegal
7%Ireland
4%Indonesia
2%Marshall Islands
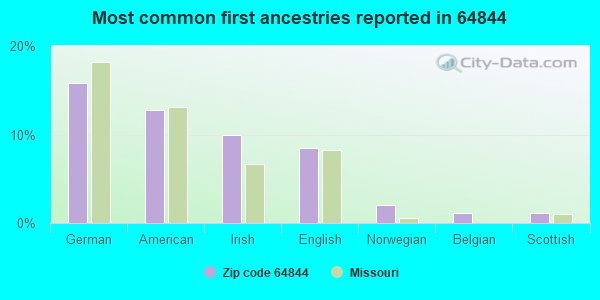
16%German
13%American
10%Irish
8%English
2%Norwegian
1%Belgian
1%Scottish
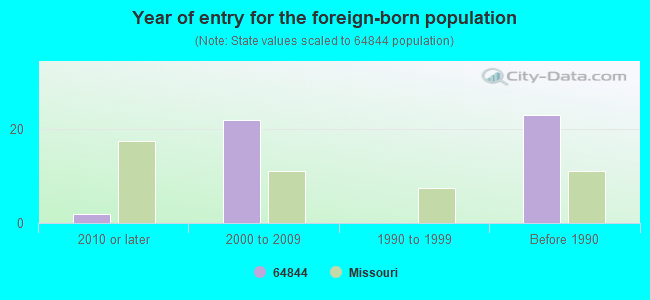
Year of entry for the foreign-born population
22010 or later
222000 to 2009
01990 to 1999
23Before 1990
Facilities with environmental interests located in this zip code:
NEWTON COUNTY MINE TAILINGS (ENTIRE TOWN OF in GRANBY, MO)
SUPERFUND NPL (Superfund database) - ICIS-HQ-2003-6003, FORMAL ENFORCEMENT ACTION (Integrated Compliance Information System) - ICIS-07-2002-0135, FORMAL ENFORCEMENT ACTION (Integrated Compliance Information System) - ICIS-07-1996-0158, FORMAL ENFORCEMENT ACTION STATE MASTER (Missouri monitoring and compilance) - ICIS-33385, ENFORCEMENT/COMPLIANCE ACTIVITY, ICIS-33386, CERCLIS-MOD981507585, SUPERFUND NPL Alternative names: TRI STATE MINING - GRANBY
FULLERTON STONE COMPANY (12445 UNICORN ROAD in GRANBY, MO)
AIR MINOR (AIRS/AFS) STATE MASTER (Missouri monitoring and compilance) - AIRS/AFS-MO0780288, AIR MINOR, PCS-MOG490024, NPDES NON-MAJOR, PCS-MOG490154, NEI-NTIMO29145P0, AIR PROGRAM CRITERIA AND HAZARDOUS AIR POLLUTANT INVENTORY (Inventory of air pollution sources) National Pollutant Discharge Elimination System NON-MAJOR (Tracking pollutant discharge elimination systems) - permit Business SIC classification: CRUSHED AND BROKEN LIMESTONE; CRUSHED AND BROKEN STONE Business NAICS classification: OTHER CRUSHED AND BROKEN STONE MINING AND QUARRYING. Organizations: DALE & CINDIA ORTLOFF (CONTACT/OWNER)
Alternative names: FULLERTON STONECOMPANY, WILLIAM H FULLERTON
R & O PROCESSORS INC (MAIN & CHURCH STS in GRANBY, MO)
SUPERFUND (Superfund database) STATE MASTER (Missouri monitoring and compilance) - CERCLIS-MOD073034324, SUPERFUND, RCRAINFO-MOD073034324, LQG (Resource Conservation and Recovery Act (tracking hazardous waste)) Business SIC classification: COATING, ENGRAVING, AND ALLIED SERVICES Organizations: NA (CONTACT/OWNER)
Alternative names: R & O PROCESSORS - GRANBY PLATING
GRANBY (NORTH HWY E in GRANBY, MO)
STATE MASTER (Missouri monitoring and compilance) - PCS-MO0107581, NPDES NON-MAJOR National Pollutant Discharge Elimination System NON-MAJOR (Tracking pollutant discharge elimination systems) - permit COMMUNITY WATER SYSTEM (SDWIS) Business SIC classification: SEWERAGE SYSTEMS Organizations: CITY OF GRANBY (CONTACT/OWNER)
Alternative names: GRANBY WWTP
BOULDER CITY SERVICE (19329 HWY H in GRANBY, MO)
STATE MASTER (Missouri monitoring and compilance) - RCRAINFO-MOP000039107, NOT IN A UNIVERSE (Resource Conservation and Recovery Act (tracking hazardous waste))
BRUCE & DEBORAH RUTHERFUR (WALLEYE RD in GRANBY, MO)
STATE MASTER (Missouri monitoring and compilance) - PCS-MOR60A189, NPDES NON-MAJOR National Pollutant Discharge Elimination System NON-MAJOR (Tracking pollutant discharge elimination systems) - permit Business SIC classification: MOTOR VEHICLE PARTS, USED Alternative names: RUTHERFURD MOTOR VEHICLE
R & O PROCESSORS INC (W HWY 60 in GRANBY, MO)
STATE MASTER (Missouri monitoring and compilance) - RCRAINFO-MOD980687073, LQG (Resource Conservation and Recovery Act (tracking hazardous waste)) Organizations: NONE (CONTACT/OWNER)
ROBERT & ANN CARTER (12025 SANDRA LANE in GRANBY, MO)
STATE MASTER (Missouri monitoring and compilance) - PCS-MOG010470, NPDES NON-MAJOR National Pollutant Discharge Elimination System NON-MAJOR (Tracking pollutant discharge elimination systems) - permit Business SIC classification: BROILER, FRYER, AND ROASTER CHICKENS Organizations: JEFF MONTGOMERY (CONTACT/OWNER)
Alternative names: HAYS HILLTOP DAIRY, JEFF MONTGOMERY, MARIPOSA DAIRY LLC
B & B MANUFACTURING INC (9940 RACCOON RD in GRANBY, MO)
STATE MASTER (Missouri monitoring and compilance) - RCRAINFO-MOR000040527, SQG Small Quantity Generators, between 100 kg and 1000 kg of hazardous waste/month (Resource Conservation and Recovery Act (tracking hazardous waste)) - notification Organizations: BRYAN ANDERSON/BARRY MCGILL (CONTACT/OWNER)
GRANBY ELEM. (237 S PENN in GRANBY, MO)
(National Center for Education Statistics) - STATE ID-4020073099 Organizations: EAST NEWTON CO. R-VI (SCHOOL DISTRICT)
Housing units lacking complete plumbing facilities: 5.1% Housing units lacking complete kitchen facilities: 4.3%
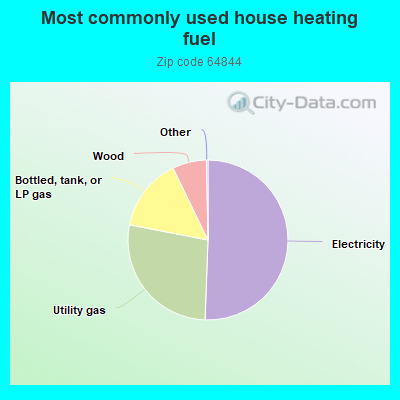
50.7%Electricity
27.5%Utility gas
14.8%Bottled, tank, or LP gas
6.9%Wood
Population in 1990: 3,571. Population change in the 1990s: +952 (+26.7%).
Place of birth for U.S.-born residents:
This state: 2,845
Northeast: 23
Midwest: 343
South: 594
West: 398
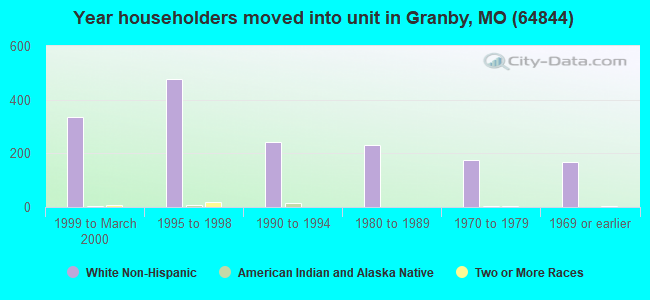
51% of the 64844 zip code residents lived in the same house 5 years ago. Out of people who lived in different houses, 55% lived in this county. Out of people who lived in different counties, 50% lived in Missouri.
94% of the 64844 zip code residents lived in the same house 1 year ago. Out of people who lived in different houses, 55% moved from this county. Out of people who lived in different houses, 34% moved from different county within same state. Out of people who lived in different houses, 12% moved from different state.
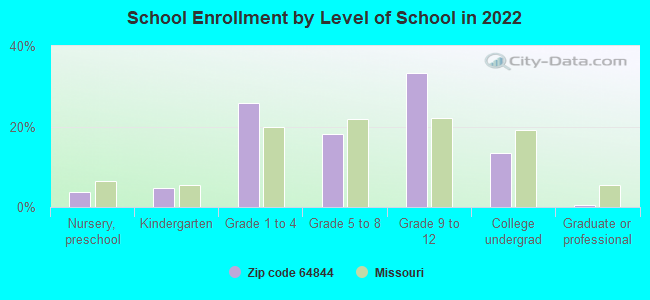
Private vs. public school enrollment:
Students in private schools in grades 1 to 8 (elementary and middle school): 78
Here:
21.8%
Missouri:
15.4%
Students in private schools in grades 9 to 12 (high school): 32
Here:
12.0%
Missouri:
13.9%
Students in private undergraduate colleges: 13
Here:
12.1%
Missouri:
22.6%
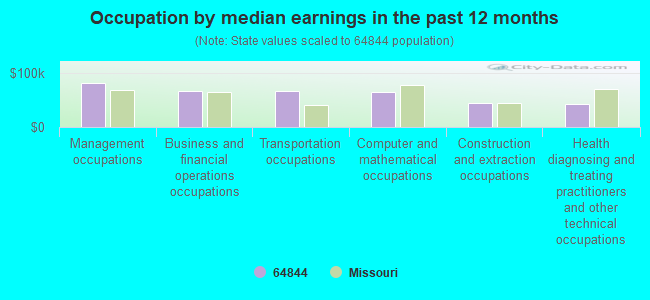
Occupation by median earnings in the past 12 months ($)
81,399Management occupations
67,083Business and financial operations occupations
66,651Transportation occupations
64,562Computer and mathematical occupations
44,360Construction and extraction occupations
41,962Health diagnosing and treating practitioners and other technical occupations
Companies with federal contracts located in this zip code:
ENVIRONMENTAL SYSTEMS (18767 HWY 8 in GRANBY, MO; small business) 2 employees, $98000 revenue.
$10,020 with Public Buildings Service for Maintenance, Repair or Alteration of Real Property -- Office Buildings. Signed on 2003-08-15. Completion date: 2003-09-15.
Top industries in this zip code by the number of employees in 2005:
Health Care and Social Assistance: Nursing Care Facilities (50-99 employees: 1 establishment)
Construction: Masonry Contractors (20-49: 1)
Construction: Site Preparation Contractors (10-19: 1, 1-4: 1)
Other Services (except Public Administration): Labor Unions and Similar Labor Organizations (10-19: 1)
Accommodation and Food Services: Full-Service Restaurants (10-19: 1)
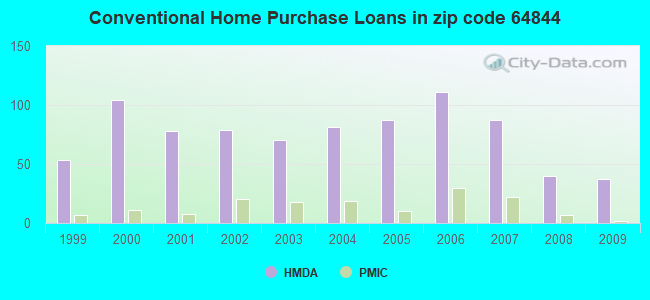
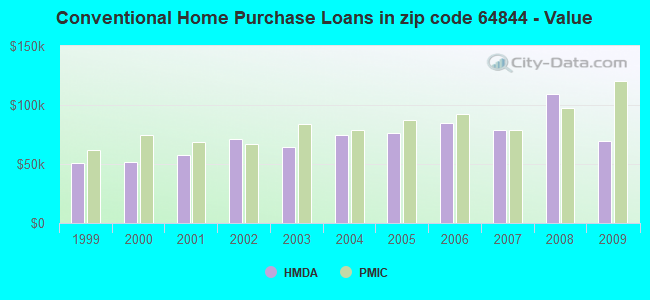
Detailed PMIC statistics for the following Tracts:0204.00
, 0209.00
2002 - 2018 National Fire Incident Reporting System (NFIRS) incidents
Based on the data from the years 2002 - 2018 the average number of fire incidents per year is 11. The highest number of fires - 45 took place in 2004, and the least - 0 in 2010. The data has a declining trend.
When looking into fire subcategories, the most reports belonged to: Outside Fires (53.6%), and Structure Fires (36.3%).
Fire incident types reported to NFIRS in Zip Code 64844
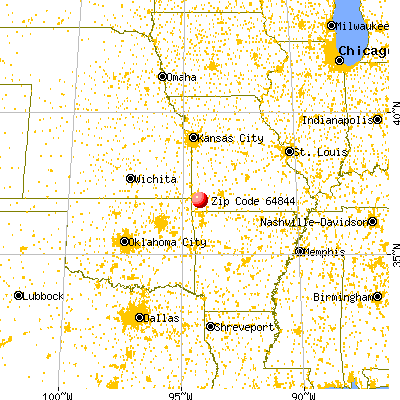


 Nearest zip codes: 64866, 64840, 64850, 64842, 64867, 65723.


 Based on the data from the years 2002 - 2018 the average number of fire incidents per year is 11. The highest number of fires - 45 took place in 2004, and the least - 0 in 2010. The data has a declining trend.
 When looking into fire subcategories, the most reports belonged to: Outside Fires (53.6%), and Structure Fires (36.3%).