Estimated zip code population in 2022: 34,813 Zip code population in 2010: 29,818 Zip code population in 2000: 21,010
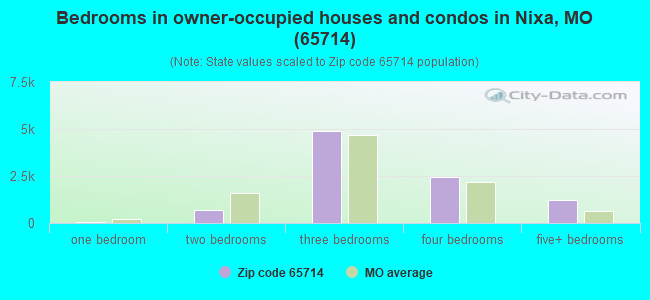
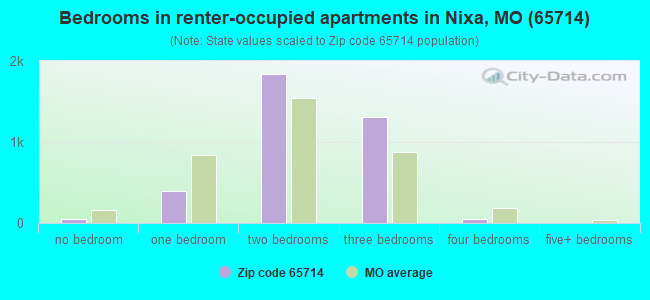
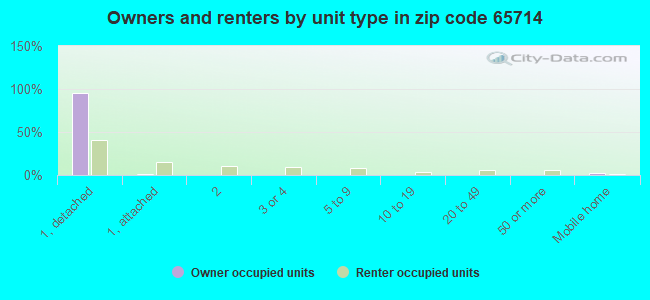
Houses and condos: 13,450 Renter-occupied apartments: 3,644
% of renters here:
28%
State:
32%
March 2022 cost of living index in zip code 65714: 83.2 (low, U.S. average is 100)
Land area: 51.9 sq. mi. Water area: 0.3 sq. mi.
Population density: 670 people per square mile
(low).
OSM Map
General Map
Google Map
MSN Map
OSM Map
General Map
Google Map
MSN Map
OSM Map
General Map
Google Map
MSN Map
OSM Map
General Map
Google Map
MSN Map
Please wait while loading the map...
Real estate property taxes paid for housing units in 2022:
This zip code:
0.7% ($1,897)
Missouri:
0.8% ($1,810)
Median real estate property taxes paid for housing units with mortgages in 2022: $1,897 (0.7%) Median real estate property taxes paid for housing units with no mortgage in 2022: $1,907 (0.7%)
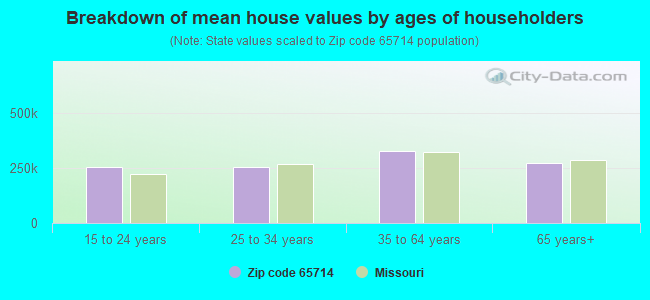
Estimated median house/condo value in 2022: $266,239
65714:
$266,239
Missouri:
$221,200
According to our research of Missouri and other state lists, there were 33 registered sex offenders living in 65714 zip code as of April 27, 2024. The ratio of all residents to sex offenders in zip code 65714 is 982 to 1. The ratio of registered sex offenders to all residents in this zip code is much lower than the state average.
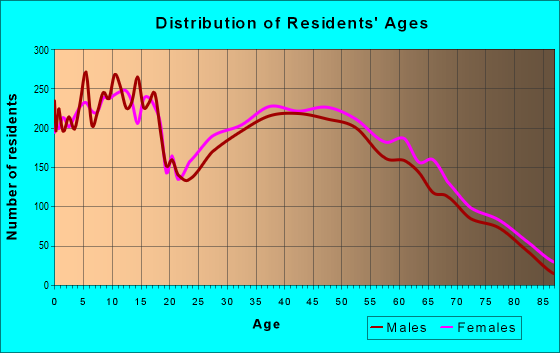
Median resident age:
This zip code:
39.3 years
Missouri median age:
39.1 years
Average household size:
This zip code:
2.7 people
Missouri:
2.4 people
Averages for the 2020 tax year for zip code 65714, filed in 2021:
Average Adjusted Gross Income (AGI) in 2020: $74,417 (Individual Income Tax Returns)
Here:
$74,417
State:
$68,151
Salary/wage: $62,180 (reported on 80.8% of returns)
Here:
$62,180
State:
$56,131
(% of AGI for various income ranges: 1162.4% for AGIs below $25k, 3472.7% for AGIs $25k-50k, 6468.3% for AGIs $50k-75k, 9308.5% for AGIs $75k-100k, 17746.2% for AGIs $100k-200k, 63230.3% for AGIs over 200k)
Taxable interest for individuals: $1,402 (reported on 34.5% of returns)
This zip code:
$1,402
Missouri:
$1,586
(% of AGI for various income ranges: 24.2% for AGIs below $25k, 33.2% for AGIs $25k-50k, 59.0% for AGIs $50k-75k, 56.7% for AGIs $75k-100k, 115.3% for AGIs $100k-200k, 899.7% for AGIs over 200k)
Ordinary dividends: $6,007 (reported on 19.6% of returns)
Here:
$6,007
State:
$10,947
(% of AGI for various income ranges: 26.2% for AGIs below $25k, 46.3% for AGIs $25k-50k, 78.1% for AGIs $50k-75k, 87.8% for AGIs $75k-100k, 262.5% for AGIs $100k-200k, 3577.7% for AGIs over 200k)
Net capital gain/loss in AGI: +$19,228 (reported on 18.9% of returns)
Here:
+$19,228
State:
+$18,453
(% of AGI for various income ranges: 11.5% for AGIs below $25k, 38.4% for AGIs $25k-50k, 69.4% for AGIs $50k-75k, 192.7% for AGIs $75k-100k, 692.2% for AGIs $100k-200k, 14736.3% for AGIs over 200k)
Profit/loss from business: +$12,755 (reported on 17.0% of returns)
Here:
+$12,755
State:
+$12,260
(% of AGI for various income ranges: 119.3% for AGIs below $25k, 219.2% for AGIs $25k-50k, 271.2% for AGIs $50k-75k, 350.2% for AGIs $75k-100k, 560.8% for AGIs $100k-200k, 2537.7% for AGIs over 200k)
Taxable individual retirement arrangement distribution: $20,114 (reported on 10.6% of returns)
65714:
$20,114
Missouri:
$19,719
(% of AGI for various income ranges: 77.1% for AGIs below $25k, 138.0% for AGIs $25k-50k, 265.9% for AGIs $50k-75k, 336.6% for AGIs $75k-100k, 711.1% for AGIs $100k-200k, 2987.0% for AGIs over 200k)
Self-employed (Keogh) retirement plans: $23,500 (reported on 0.4% of returns)
65714:
$23,500
Missouri:
$24,851
(% of AGI for various income ranges: 27.7% for AGIs $100k-200k, 408.7% for AGIs over 200k)
Total itemized deductions: $38,569 (reported on 7.9% of returns)
Here:
$38,569
State:
$36,651
(% of AGI for various income ranges: 42.3% for AGIs below $25k, 97.1% for AGIs $25k-50k, 193.4% for AGIs $50k-75k, 302.3% for AGIs $75k-100k, 1090.7% for AGIs $100k-200k, 7544.0% for AGIs over 200k)
Charity contributions: $18,818 (reported on 6.7% of returns)
Here:
$18,818
State:
$15,671
(% of AGI for various income ranges: 2.7% for AGIs below $25k, 15.2% for AGIs $25k-50k, 38.6% for AGIs $50k-75k, 87.9% for AGIs $75k-100k, 411.5% for AGIs $100k-200k, 4123.0% for AGIs over 200k)
Taxes paid: $7,602 (reported on 7.9% of returns)
65714:
$7,602
State:
$7,608
(% of AGI for various income ranges: 3.0% for AGIs below $25k, 12.7% for AGIs $25k-50k, 33.6% for AGIs $50k-75k, 68.6% for AGIs $75k-100k, 281.2% for AGIs $100k-200k, 1267.3% for AGIs over 200k)
Earned income credit: $2,288 (reported on 13.6% of returns)
Here:
$2,288
State:
$2,315
(% of AGI for various income ranges: 78.9% for AGIs below $25k, 79.5% for AGIs $25k-50k, 1.9% for AGIs $50k-75k)
Percentage of individuals using paid preparers for their 2020 taxes: 94.8%
Here:
95%
State:
93%
(% for various income ranges: 94.3% for AGIs below $25k, 95.0% for AGIs $25k-50k, 95.0% for AGIs $50k-75k, 95.1% for AGIs $75k-100k, 94.8% for AGIs $100k-200k, 95.3% for AGIs over 200k)
Averages for the 2012 tax year for zip code 65714, filed in 2013:
Average Adjusted Gross Income (AGI) in 2012: $56,698 (Individual Income Tax Returns)
Here:
$56,698
State:
$55,896
Salary/wage: $48,575 (reported on 83.8% of returns)
Here:
$48,575
State:
$46,205
(% of AGI for various income ranges: 74.7% for AGIs below $25k, 77.0% for AGIs $25k-50k, 77.1% for AGIs $50k-75k, 78.1% for AGIs $75k-100k, 75.8% for AGIs $100k-200k, 53.2% for AGIs over 200k)
Taxable interest for individuals: $1,209 (reported on 39.2% of returns)
This zip code:
$1,209
Missouri:
$1,559
(% of AGI for various income ranges: 1.7% for AGIs below $25k, 0.8% for AGIs $25k-50k, 0.7% for AGIs $50k-75k, 0.6% for AGIs $75k-100k, 0.8% for AGIs $100k-200k, 0.9% for AGIs over 200k)
Ordinary dividends: $3,407 (reported on 18.3% of returns)
Here:
$3,407
State:
$7,410
(% of AGI for various income ranges: 1.4% for AGIs below $25k, 0.7% for AGIs $25k-50k, 0.9% for AGIs $50k-75k, 0.7% for AGIs $75k-100k, 1.2% for AGIs $100k-200k, 1.5% for AGIs over 200k)
Net capital gain/loss in AGI: +$10,579 (reported on 15.2% of returns)
Here:
+$10,579
State:
+$11,579
(% of AGI for various income ranges: 0.4% for AGIs $25k-50k, 0.7% for AGIs $50k-75k, 0.6% for AGIs $75k-100k, 1.7% for AGIs $100k-200k, 10.4% for AGIs over 200k)
Profit/loss from business: +$11,723 (reported on 18.2% of returns)
Here:
+$11,723
State:
+$11,688
(% of AGI for various income ranges: 7.2% for AGIs below $25k, 4.0% for AGIs $25k-50k, 3.1% for AGIs $50k-75k, 3.3% for AGIs $75k-100k, 2.3% for AGIs $100k-200k, 5.0% for AGIs over 200k)
Taxable individual retirement arrangement distribution: $13,099 (reported on 10.6% of returns)
65714:
$13,099
Missouri:
$14,773
(% of AGI for various income ranges: 3.3% for AGIs below $25k, 3.0% for AGIs $25k-50k, 2.4% for AGIs $50k-75k, 2.5% for AGIs $75k-100k, 2.5% for AGIs $100k-200k, 1.8% for AGIs over 200k)
Self-employment retirement plans: $16,900 (reported on 0.4% of returns)
65714:
$16,900
Missouri:
$20,502
Total itemized deductions: $21,724 (20% of AGI, reported on 33.2% of returns)
Here:
$21,724
State:
$22,730
Here:
20.3% of AGI
State:
19.2% of AGI
(% of AGI for various income ranges: 8.6% for AGIs below $25k, 10.2% for AGIs $25k-50k, 12.4% for AGIs $50k-75k, 13.6% for AGIs $75k-100k, 15.1% for AGIs $100k-200k, 12.8% for AGIs over 200k)
Charity contributions: $5,148 (reported on 26.8% of returns)
Here:
$5,148
State:
$4,745
(% of AGI for various income ranges: 0.9% for AGIs below $25k, 1.5% for AGIs $25k-50k, 2.3% for AGIs $50k-75k, 2.4% for AGIs $75k-100k, 3.0% for AGIs $100k-200k, 3.1% for AGIs over 200k)
Taxes paid: $6,908 (reported on 33.1% of returns)
65714:
$6,908
State:
$8,399
(% of AGI for various income ranges: 1.4% for AGIs below $25k, 2.0% for AGIs $25k-50k, 3.1% for AGIs $50k-75k, 4.1% for AGIs $75k-100k, 5.4% for AGIs $100k-200k, 5.6% for AGIs over 200k)
Earned income credit: $2,227 (reported on 18.1% of returns)
Here:
$2,227
State:
$2,288
(% of AGI for various income ranges: 6.2% for AGIs below $25k, 1.4% for AGIs $25k-50k)
Percentage of individuals using paid preparers for their 2012 taxes: 56.2%
Here:
56%
State:
55%
(% for various income ranges: 50.5% for AGIs below $25k, 56.1% for AGIs $25k-50k, 59.0% for AGIs $50k-75k, 58.0% for AGIs $75k-100k, 63.2% for AGIs $100k-200k, 84.6% for AGIs over 200k)
Averages for the 2004 tax year for zip code 65714, filed in 2005:
Average Adjusted Gross Income (AGI) in 2004: $46,051 (Individual Income Tax Returns)
Here:
$46,051
State:
$44,591
Salary/wage: $40,119 (reported on 85.9% of returns)
Here:
$40,119
State:
$38,941
(% of AGI for various income ranges: 246.2% for AGIs below $10k, 76.9% for AGIs $10k-25k, 82.5% for AGIs $25k-50k, 82.2% for AGIs $50k-75k, 80.8% for AGIs $75k-100k, 58.6% for AGIs over 100k)
Taxable interest for individuals: $1,492 (reported on 44.9% of returns)
This zip code:
$1,492
Missouri:
$1,801
(% of AGI for various income ranges: 17.7% for AGIs below $10k, 2.7% for AGIs $10k-25k, 1.3% for AGIs $25k-50k, 1.0% for AGIs $50k-75k, 0.9% for AGIs $75k-100k, 1.5% for AGIs over 100k)
Taxable dividends: $2,082 (reported on 22.1% of returns)
Here:
$2,082
State:
$3,677
(% of AGI for various income ranges: 6.6% for AGIs below $10k, 1.0% for AGIs $10k-25k, 0.7% for AGIs $25k-50k, 0.5% for AGIs $50k-75k, 0.8% for AGIs $75k-100k, 1.5% for AGIs over 100k)
Net capital gain/loss: +$13,638 (reported on 18.6% of returns)
Here:
+$13,638
State:
+$8,915
(% of AGI for various income ranges: 8.3% for AGIs below $10k, 0.4% for AGIs $10k-25k, 0.7% for AGIs $25k-50k, 1.2% for AGIs $50k-75k, 2.5% for AGIs $75k-100k, 13.7% for AGIs over 100k)
Profit/loss from business: +$9,439 (reported on 20.0% of returns)
Here:
+$9,439
State:
+$9,793
(% of AGI for various income ranges: -0.1% for AGIs below $10k, 6.1% for AGIs $10k-25k, 3.6% for AGIs $25k-50k, 3.4% for AGIs $50k-75k, 3.5% for AGIs $75k-100k, 4.7% for AGIs over 100k)
IRA payment deduction: $3,249 (reported on 2.9% of returns)
65714:
$3,249
Missouri:
$2,972
(% of AGI for various income ranges: 0.2% for AGIs $10k-25k, 0.2% for AGIs $25k-50k, 0.2% for AGIs $50k-75k, 0.2% for AGIs $75k-100k, 0.2% for AGIs over 100k)
Self-employed pension: $10,226 (reported on 0.6% of returns)
Here:
$10,226
Missouri:
$14,365
(% of AGI for various income ranges: 0.1% for AGIs $50k-75k, 0.1% for AGIs $75k-100k, 0.3% for AGIs over 100k)
Total itemized deductions: $17,538 (22% of AGI, reported on 37.8% of returns)
Here:
$17,538
State:
$18,261
Here:
21.6% of AGI
State:
20.5% of AGI
(% of AGI for various income ranges: 32.8% for AGIs below $10k, 10.8% for AGIs $10k-25k, 13.5% for AGIs $25k-50k, 14.8% for AGIs $50k-75k, 16.9% for AGIs $75k-100k, 14.1% for AGIs over 100k)
Charity contributions deductions: $3,794 (4% of AGI, reported on 32.1% of returns)
Here:
$3,794
State:
$3,665
Here:
4.4% of AGI
State:
3.9% of AGI
(% of AGI for various income ranges: 2.3% for AGIs below $10k, 1.4% for AGIs $10k-25k, 2.0% for AGIs $25k-50k, 2.5% for AGIs $50k-75k, 2.9% for AGIs $75k-100k, 3.4% for AGIs over 100k)
Total tax: $6,526 (reported on 76.0% of returns)
65714:
$6,526
State:
$6,999
(% of AGI for various income ranges: 8.3% for AGIs below $10k, 4.1% for AGIs $10k-25k, 6.2% for AGIs $25k-50k, 7.7% for AGIs $50k-75k, 10.0% for AGIs $75k-100k, 17.6% for AGIs over 100k)
Earned income credit: $1,627 (reported on 14.7% of returns)
Here:
$1,627
State:
$1,728
Percentage of individuals using paid preparers for their 2004 taxes: 61.9%
Here:
62%
State:
62%
(% for various income ranges: 53.1% for AGIs below $10k, 62.7% for AGIs $10k-25k, 63.0% for AGIs $25k-50k, 62.1% for AGIs $50k-75k, 65.6% for AGIs $75k-100k, 72.5% for AGIs over 100k)
Likely homosexual households (counted as self-reported same-sex unmarried-partner households)
Lesbian couples: 0.0% of all households
Gay men: 0.2% of all households
Household received Food Stamps/SNAP in the past 12 months: 791 Household did not receive Food Stamps/SNAP in the past 12 months: 12,239
Women who had a birth in the past 12 months: 690 (524 now married, 157 unmarried) Women who did not have a birth in the past 12 months: 7,203 (4,060 now married, 3,115 unmarried)
Housing units in zip code 65714 with a mortgage: 6,366 (452 second mortgage, 9 home equity loan, 406 both second mortgage and home equity loan) Houses without a mortgage: 139
Median monthly owner costs for units with a mortgage: $1,425 Median monthly owner costs for units without a mortgage: $499
Residents with income below the poverty level in 2022:
This zip code:
6.2%
Whole state:
13.2%
Residents with income below 50% of the poverty level in 2022:
This zip code:
4.0%
Whole state:
6.8%
Median number of rooms in houses and condos:
Here:
6.3
State:
6.4
Median number of rooms in apartments:
Here:
4.3
State:
4.4
Notable locations in this zip code not listed on our city pages
Notable locations in zip code 65714: Nixa Fire Protection District Station 1 (A), Nixa Fire Protection District Station 4 Headquarters (B), Nixa Fire Protection District Station 2 (C), Nixa Fire Protection District Station 3 (D). Display/hide their locations on the map
Churches in zip code 65714 include: Riverdale Church (A), Union Chapel (B), Union Hill Church (C), Delaware Church (D). Display/hide their locations on the map
Cemeteries: McCauley Cemetery (1), McConnell Cemetery (2), Nokes Cemetery (3), Payne Cemetery (4), Bledsoe Memorial Cemetery (5), Gibson Cemetery (6), Glenn Cemetery (7). Display/hide their locations on the map
6,619 married couples with children.
1,775 single-parent households (774 men, 1,001 women).
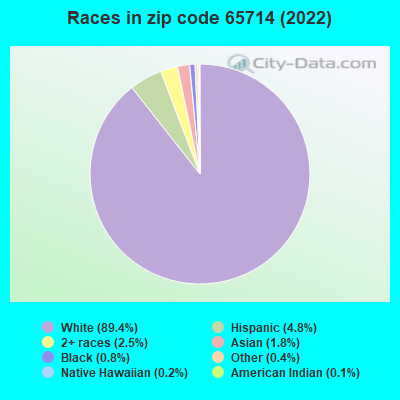
94.3% of residents of 65714 zip code speak English at home.
2.4% of residents speak Spanish at home (60% very well, 22% well, 18% not well).
1.9% of residents speak other Indo-European language at home (50% very well, 32% well, 18% not well).
1.4% of residents speak Asian or Pacific Island language at home (32% very well, 59% well, 8% not well).
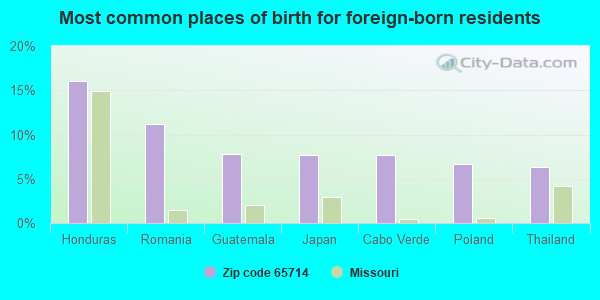
Foreign born population: 1,292 (3.7%) (36.8% of them are naturalized citizens)
This zip code:
3.7%
Whole state:
4.1%
16%Honduras
11%Romania
8%Guatemala
8%Japan
8%Cabo Verde
7%Poland
6%Thailand
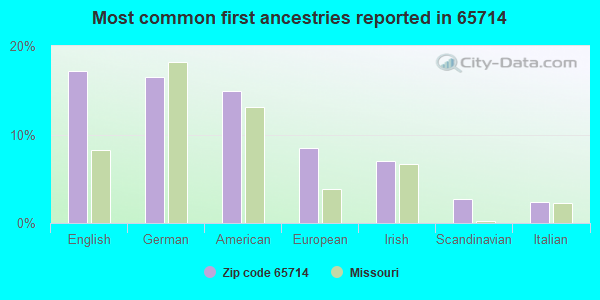
17%English
16%German
15%American
8%European
7%Irish
3%Scandinavian
2%Italian
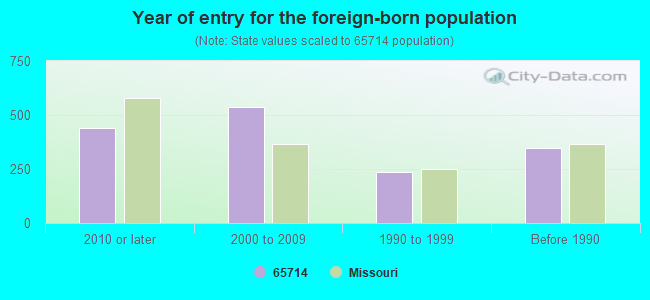
Year of entry for the foreign-born population
4402010 or later
5382000 to 2009
2341990 to 1999
348Before 1990
Major facilities with environmental interests located in this zip code:
ACCURATE PLASTICS CORPORATION (108 WEST MOUNT VERNON STREET in NIXA, MO)
AIR MINOR (AIRS/AFS) STATE MASTER (Missouri monitoring and compilance) - NET-290430019, AIR PROGRAM, AIRS/AFS-MO0781573, AIR MINOR, AIRS/AFS-MO0903922, RCRAINFO-MOD046736054, NOT IN A UNIVERSE, RCRAINFO-MOD990731283, PCS-MOR23D017, NPDES NON-MAJOR National Pollutant Discharge Elimination System NON-MAJOR (Tracking pollutant discharge elimination systems) - permit (Resource Conservation and Recovery Act (tracking hazardous waste)) Business SIC classification: PLASTICS MATERIALS, SYNTHETIC RESINS, AND NONVULCANIZABLE ELASTOMERS; PLASTICS PRODUCTS Organizations: DIVERSIFIED PLASTICS CORP (CONTACT/OWNER)
Alternative names: ACCURATE MOLD & PLASTICS CORP, DIVERSIFIED PLASTICS
NIXA (715 W MT VERNON in NIXA, MO)
STATE MASTER (Missouri monitoring and compilance) - PCS-MOR109571, NPDES NON-MAJOR COMPLIANCE ACTIVITY (Tracking inspections of insecticide, fungicide, and rodenticide, and toxic substances) National Pollutant Discharge Elimination System NON-MAJOR (Tracking pollutant discharge elimination systems) - permit COMMUNITY WATER SYSTEM (SDWIS) - SDWIS-MO5010576 71635, WATER TREATMENT PLANT, SDWIS-MO5010576 71636, SDWIS-MO5010576 71637, SDWIS-MO5010576 71638, SDWIS-MO5010576 74076, Business SIC classification: HEAVY CONSTRUCTION; ELECTRIC SERVICES Organizations: CITY OF NIXA (CONTACT/OWNER)
Alternative names: CITY OF NIXA, CITY OF NIXA-CITY HALL EX, NIXA WWTF
O & M DEVELOPERS, LLC (HWY CC & MAIN ST in NIXA, MO)
STATE MASTER (Missouri monitoring and compilance) - PCS-MOR109B09, NPDES NON-MAJOR National Pollutant Discharge Elimination System NON-MAJOR (Tracking pollutant discharge elimination systems) - permit - ICIS-, ENFORCEMENT/COMPLIANCE ACTIVITY Business SIC classification: HEAVY CONSTRUCTION Alternative names: VILLAGE AT WICKLOW
INTEGRATED INGREDIENTS (FLEISCHMANNS VINEGAR) (200 SOUTH MAIN STREET in NIXA, MO)
AIR MINOR (AIRS/AFS) STATE MASTER (Missouri monitoring and compilance) - PCS-MO0041483, NPDES NON-MAJOR, AIRS/AFS-MO0907818, AIR MINOR, NEI-NTIMO15030, AIR PROGRAM CRITERIA AND HAZARDOUS AIR POLLUTANT INVENTORY (Inventory of air pollution sources) National Pollutant Discharge Elimination System NON-MAJOR (Tracking pollutant discharge elimination systems) - permit Business SIC classification: FOOD PREPARATIONS; NONCLASSIFIABLE ESTABLISHMENTS Organizations: FLEISCHMANN'S VINEGAR CO (CONTACT/OWNER)
Alternative names: BURNS PHILIP, INC, BURNS PHILP FOOD INGR/FLE, INT/INGR/FLEISCHMN VNGR
GENE FLOOD (CHEYENNE DRIVE in NIXA, MO)
STATE MASTER (Missouri monitoring and compilance) - PCS-MOR103587, NPDES NON-MAJOR National Pollutant Discharge Elimination System NON-MAJOR (Tracking pollutant discharge elimination systems) - permit National Pollutant Discharge Elimination System NON-MAJOR (Tracking pollutant discharge elimination systems) - permit Business SIC classification: HEAVY CONSTRUCTION Alternative names: FAIR HAVEN ESTATES/IV, FAIR HAVEN ESTATES SUBDIV
NIXA (OLD RIVERDALE PUBLIC RD in NIXA, MO)
STATE MASTER (Missouri monitoring and compilance) - PCS-MO0028037, NPDES MAJOR National Pollutant Discharge Elimination System MAJOR (Tracking pollutant discharge elimination systems) - permit - ICIS-07-2006-0072, ENFORCEMENT/COMPLIANCE ACTIVITY, ICIS-, Business SIC classification: SEWERAGE SYSTEMS Organizations: CITY OF NIXA (CONTACT/OWNER)
Alternative names: NIXA WWTF
GALEWOOD DEVELOPMENT, INC (CHEYENNE RD in NIXA, MO)
STATE MASTER (Missouri monitoring and compilance) - PCS-MOR109B49, NPDES NON-MAJOR National Pollutant Discharge Elimination System NON-MAJOR (Tracking pollutant discharge elimination systems) - permit National Pollutant Discharge Elimination System NON-MAJOR (Tracking pollutant discharge elimination systems) - permit Business SIC classification: HEAVY CONSTRUCTION Organizations: COURTNEY BENAS (CONTACT/OWNER)
Alternative names: COURTNEY BENAS, DAISY FALLS, DAISY FALLS PHASE TWO
GIT N GO #128 (1110 MT VERNON in NIXA, MO)
STATE MASTER (Missouri monitoring and compilance) - RCRAINFO-MOP000501080, SQG (Resource Conservation and Recovery Act (tracking hazardous waste)) Organizations: GIT N GO INC (CONTACT/OPERATOR)
AQUA MIST CLEANING CONSTRUCTION (304 ENTERPRISE in NIXA, MO)
STATE MASTER (Missouri monitoring and compilance) - RCRAINFO-MOD985821412, NOT IN A UNIVERSE (Resource Conservation and Recovery Act (tracking hazardous waste)) Organizations: JANET RAINEY (CONTACT/OPERATOR)
CHRISTIAN COUNTY CONCRETE (432 W TRACKER RD in NIXA, MO)
ENFORCEMENT/COMPLIANCE ACTIVITY (Integrated Compliance Information System) STATE MASTER (Missouri monitoring and compilance) - RCRAINFO-MOP000032888, NOT IN A UNIVERSE (Resource Conservation and Recovery Act (tracking hazardous waste)) Organizations: CONCO QUARRIES (CONTACT/OWNER)
A & J PRINTING (1111 KENNETH ST in NIXA, MO)
STATE MASTER (Missouri monitoring and compilance) - RCRAINFO-MOP000041814, NOT IN A UNIVERSE (Resource Conservation and Recovery Act (tracking hazardous waste)) Organizations: JIM EAKINS (CONTACT/OWNER)
ROBERT GLEN (HWY 14 & HWY M in NIXA, MO)
STATE MASTER (Missouri monitoring and compilance) - PCS-MOR103189, NPDES NON-MAJOR National Pollutant Discharge Elimination System NON-MAJOR (Tracking pollutant discharge elimination systems) - permit Business SIC classification: GENERAL CONTRACTORS-SINGLE-FAMILY HOUSES Alternative names: GLEN OAKS ESTATES
ALBERTSONS FOOD & DRUG (400 MASSEY in NIXA, MO)
STATE MASTER (Missouri monitoring and compilance) - RCRAINFO-MOP000037291, NOT IN A UNIVERSE (Resource Conservation and Recovery Act (tracking hazardous waste)) Organizations: ALBERTSONS INC (CONTACT/OWNER)
Housing units lacking complete plumbing facilities: 0.5% Housing units lacking complete kitchen facilities: 1.5%
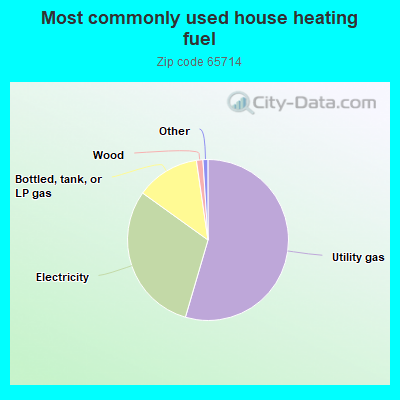
54.6%Utility gas
30.4%Electricity
12.8%Bottled, tank, or LP gas
1.3%Wood
Population in 1990: 11,346. Population change in the 1990s: +9,664 (+85.2%).
Place of birth for U.S.-born residents:
This state: 19,641
Northeast: 612
Midwest: 5,868
South: 3,421
West: 3,820
38% of the 65714 zip code residents lived in the same house 5 years ago. Out of people who lived in different houses, 27% lived in this county. Out of people who lived in different counties, 50% lived in Missouri.
90% of the 65714 zip code residents lived in the same house 1 year ago. Out of people who lived in different houses, 24% moved from this county. Out of people who lived in different houses, 52% moved from different county within same state. Out of people who lived in different houses, 26% moved from different state. Out of people who lived in different houses, 1% moved from abroad.
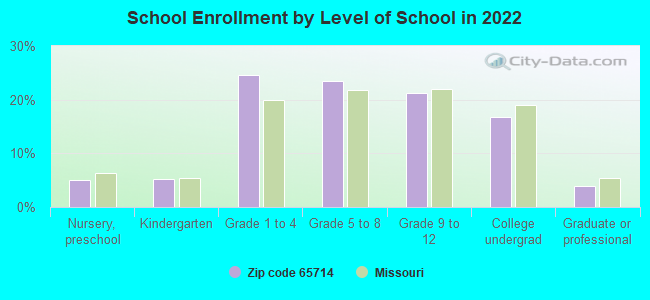
Private vs. public school enrollment:
Students in private schools in grades 1 to 8 (elementary and middle school): 379
Here:
9.2%
Missouri:
15.4%
Students in private schools in grades 9 to 12 (high school): 140
Here:
7.7%
Missouri:
13.9%
Students in private undergraduate colleges: 293
Here:
20.1%
Missouri:
22.6%
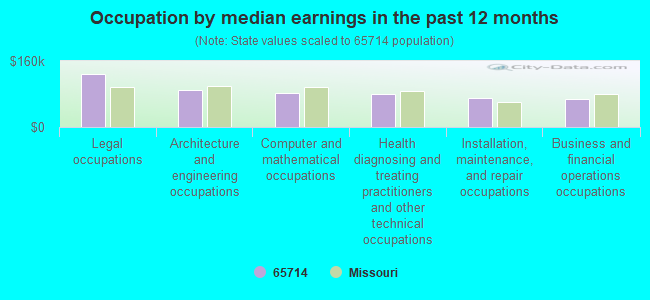
Occupation by median earnings in the past 12 months ($)
129,131Legal occupations
90,674Architecture and engineering occupations
82,377Computer and mathematical occupations
79,030Health diagnosing and treating practitioners and other technical occupations
71,408Installation, maintenance, and repair occupations
68,758Business and financial operations occupations
Companies with federal contracts located in this zip code:
JOHN JAMISON CONSTRUCTION (252 BRISTLECONE DR in NIXA, MO; small business) 10 employees, $900000 revenue.
$15,000 with Bureau of Prisoners/Federal Prison System for Maintenance, Repair or Alteration of Real Property -- Penal Facilities. Signed on 1999-11-15. Completion date: 1999-12-15.
Top industries in this zip code by the number of employees in 2005:
2002 - 2018 National Fire Incident Reporting System (NFIRS) incidents
Based on the data from the years 2002 - 2018 the average number of fire incidents per year is 96. The highest number of reported fire incidents - 165 took place in 2006, and the least - 30 in 2002. The data has an increasing trend.
When looking into fire subcategories, the most incidents belonged to: Structure Fires (46.8%), and Outside Fires (41.8%).
Fire incident types reported to NFIRS in Zip Code 65714
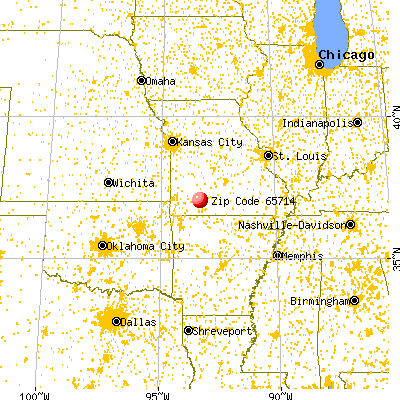


 Nearest zip codes: 65810, 65619, 65631, 65807, 65721, 65804.


 Based on the data from the years 2002 - 2018 the average number of fire incidents per year is 96. The highest number of reported fire incidents - 165 took place in 2006, and the least - 30 in 2002. The data has an increasing trend.
 When looking into fire subcategories, the most incidents belonged to: Structure Fires (46.8%), and Outside Fires (41.8%).