Estimated zip code population in 2022: 38,007 Zip code population in 2010: 34,664 Zip code population in 2000: 35,449
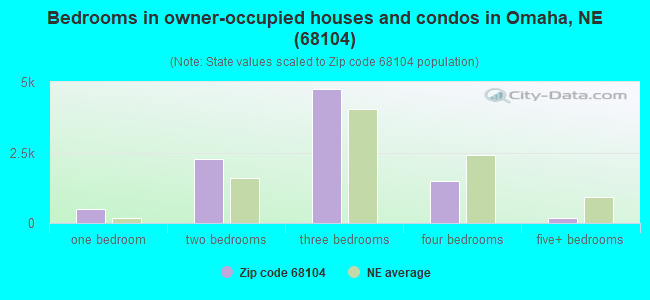
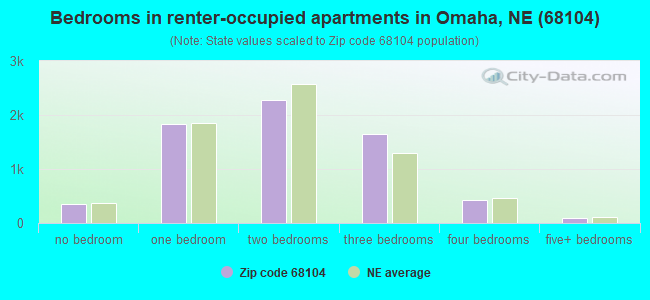
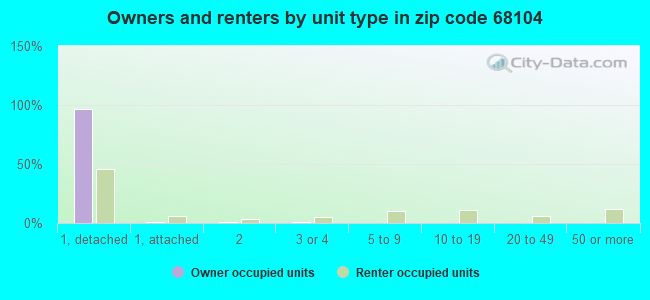
Houses and condos: 16,646 Renter-occupied apartments: 6,680
% of renters here:
42%
State:
34%
March 2022 cost of living index in zip code 68104: 88.9 (less than average, U.S. average is 100)
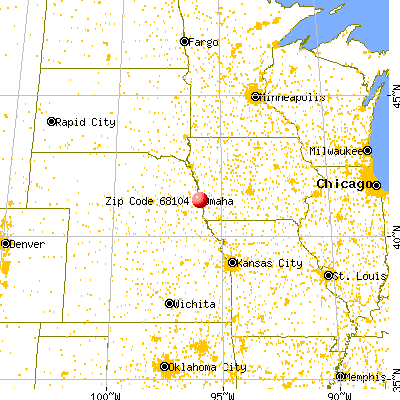
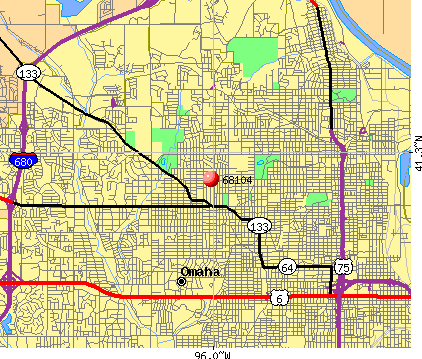
Land area: 6.6 sq. mi. Water area: 0.0 sq. mi.
Population density: 5,771 people per square mile
(average).
OSM Map
General Map
Google Map
MSN Map
OSM Map
General Map
Google Map
MSN Map
OSM Map
General Map
Google Map
MSN Map
OSM Map
General Map
Google Map
MSN Map
Please wait while loading the map...
Real estate property taxes paid for housing units in 2022:
This zip code:
1.6% ($2,465)
Nebraska:
1.4% ($3,313)
Median real estate property taxes paid for housing units with mortgages in 2022: $2,464 (1.5%) Median real estate property taxes paid for housing units with no mortgage in 2022: $2,410 (1.7%)
Averages for the 2020 tax year for zip code 68104, filed in 2021:
Average Adjusted Gross Income (AGI) in 2020: $45,099 (Individual Income Tax Returns)
Here:
$45,099
State:
$73,874
Salary/wage: $41,707 (reported on 89.6% of returns)
Here:
$41,707
State:
$58,268
(% of AGI for various income ranges: 1208.9% for AGIs below $25k, 3871.0% for AGIs $25k-50k, 6834.0% for AGIs $50k-75k, 10462.0% for AGIs $75k-100k, 18369.2% for AGIs $100k-200k, 56980.0% for AGIs over 200k)
Taxable interest for individuals: $608 (reported on 15.7% of returns)
This zip code:
$608
Nebraska:
$1,748
(% of AGI for various income ranges: 5.3% for AGIs below $25k, 5.1% for AGIs $25k-50k, 11.5% for AGIs $50k-75k, 28.1% for AGIs $75k-100k, 54.1% for AGIs $100k-200k, 373.8% for AGIs over 200k)
Ordinary dividends: $2,937 (reported on 9.9% of returns)
Here:
$2,937
State:
$7,841
(% of AGI for various income ranges: 7.8% for AGIs below $25k, 9.1% for AGIs $25k-50k, 34.2% for AGIs $50k-75k, 71.2% for AGIs $75k-100k, 206.2% for AGIs $100k-200k, 1862.5% for AGIs over 200k)
Net capital gain/loss in AGI: +$8,201 (reported on 9.1% of returns)
Here:
+$8,201
State:
+$21,703
(% of AGI for various income ranges: 5.6% for AGIs below $25k, 8.1% for AGIs $25k-50k, 54.7% for AGIs $50k-75k, 207.9% for AGIs $75k-100k, 471.1% for AGIs $100k-200k, 7645.0% for AGIs over 200k)
Profit/loss from business: +$9,363 (reported on 11.0% of returns)
Here:
+$9,363
State:
+$11,239
(% of AGI for various income ranges: 79.6% for AGIs below $25k, 79.8% for AGIs $25k-50k, 140.2% for AGIs $50k-75k, 160.6% for AGIs $75k-100k, 540.9% for AGIs $100k-200k, 2578.8% for AGIs over 200k)
Taxable individual retirement arrangement distribution: $13,819 (reported on 4.8% of returns)
68104:
$13,819
Nebraska:
$18,251
(% of AGI for various income ranges: 34.5% for AGIs below $25k, 30.6% for AGIs $25k-50k, 93.9% for AGIs $50k-75k, 199.5% for AGIs $75k-100k, 464.7% for AGIs $100k-200k, 1832.5% for AGIs over 200k)
Self-employed (Keogh) retirement plans: $24,867 (reported on 0.2% of returns)
68104:
$24,867
Nebraska:
$23,519
(% of AGI for various income ranges: 116.6% for AGIs $100k-200k)
Total itemized deductions: $24,676 (reported on 3.3% of returns)
Here:
$24,676
State:
$37,704
(% of AGI for various income ranges: 14.2% for AGIs below $25k, 31.4% for AGIs $25k-50k, 159.1% for AGIs $50k-75k, 266.3% for AGIs $75k-100k, 584.1% for AGIs $100k-200k, 2958.8% for AGIs over 200k)
Charity contributions: $8,214 (reported on 2.6% of returns)
Here:
$8,214
State:
$15,251
(% of AGI for various income ranges: 7.9% for AGIs $25k-50k, 27.8% for AGIs $50k-75k, 50.0% for AGIs $75k-100k, 173.9% for AGIs $100k-200k, 1362.5% for AGIs over 200k)
Taxes paid: $7,194 (reported on 3.2% of returns)
68104:
$7,194
State:
$8,015
(% of AGI for various income ranges: 1.5% for AGIs below $25k, 5.7% for AGIs $25k-50k, 42.3% for AGIs $50k-75k, 83.8% for AGIs $75k-100k, 220.5% for AGIs $100k-200k, 778.8% for AGIs over 200k)
Earned income credit: $2,492 (reported on 24.6% of returns)
Here:
$2,492
State:
$2,260
(% of AGI for various income ranges: 122.4% for AGIs below $25k, 87.6% for AGIs $25k-50k, 2.0% for AGIs $50k-75k)
Percentage of individuals using paid preparers for their 2020 taxes: 95.4%
Here:
95%
State:
95%
(% for various income ranges: 94.6% for AGIs below $25k, 96.4% for AGIs $25k-50k, 94.9% for AGIs $50k-75k, 95.8% for AGIs $75k-100k, 95.6% for AGIs $100k-200k, 95.5% for AGIs over 200k)
Averages for the 2012 tax year for zip code 68104, filed in 2013:
Average Adjusted Gross Income (AGI) in 2012: $36,988 (Individual Income Tax Returns)
Here:
$36,988
State:
$60,572
Salary/wage: $33,973 (reported on 89.5% of returns)
Here:
$33,973
State:
$47,046
(% of AGI for various income ranges: 81.3% for AGIs below $25k, 88.0% for AGIs $25k-50k, 84.8% for AGIs $50k-75k, 82.7% for AGIs $75k-100k, 78.1% for AGIs $100k-200k, 55.2% for AGIs over 200k)
Taxable interest for individuals: $648 (reported on 17.9% of returns)
This zip code:
$648
Nebraska:
$1,535
(% of AGI for various income ranges: 0.5% for AGIs below $25k, 0.2% for AGIs $25k-50k, 0.3% for AGIs $50k-75k, 0.3% for AGIs $75k-100k, 0.3% for AGIs $100k-200k, 0.5% for AGIs over 200k)
Ordinary dividends: $2,305 (reported on 10.4% of returns)
Here:
$2,305
State:
$5,776
(% of AGI for various income ranges: 0.6% for AGIs below $25k, 0.5% for AGIs $25k-50k, 0.5% for AGIs $50k-75k, 0.6% for AGIs $75k-100k, 1.0% for AGIs $100k-200k, 1.5% for AGIs over 200k)
Net capital gain/loss in AGI: +$8,714 (reported on 7.5% of returns)
Here:
+$8,714
State:
+$16,171
(% of AGI for various income ranges: 0.2% for AGIs $25k-50k, 0.2% for AGIs $50k-75k, 0.6% for AGIs $75k-100k, 1.2% for AGIs $100k-200k, 24.1% for AGIs over 200k)
Profit/loss from business: +$8,105 (reported on 12.2% of returns)
Here:
+$8,105
State:
+$9,897
(% of AGI for various income ranges: 6.9% for AGIs below $25k, 1.9% for AGIs $25k-50k, 1.4% for AGIs $50k-75k, 1.8% for AGIs $75k-100k, 2.7% for AGIs $100k-200k, 1.2% for AGIs over 200k)
Taxable individual retirement arrangement distribution: $9,591 (reported on 6.2% of returns)
68104:
$9,591
Nebraska:
$12,804
(% of AGI for various income ranges: 1.5% for AGIs below $25k, 1.1% for AGIs $25k-50k, 1.8% for AGIs $50k-75k, 1.6% for AGIs $75k-100k, 3.0% for AGIs $100k-200k)
Self-employment retirement plans: $12,075 (reported on 0.2% of returns)
68104:
$12,075
Nebraska:
$18,457
Total itemized deductions: $15,407 (22% of AGI, reported on 22.5% of returns)
Here:
$15,407
State:
$23,343
Here:
22.0% of AGI
State:
18.7% of AGI
(% of AGI for various income ranges: 4.6% for AGIs below $25k, 7.9% for AGIs $25k-50k, 10.6% for AGIs $50k-75k, 11.7% for AGIs $75k-100k, 13.6% for AGIs $100k-200k, 10.5% for AGIs over 200k)
Charity contributions: $2,910 (reported on 17.4% of returns)
Here:
$2,910
State:
$4,921
(% of AGI for various income ranges: 0.4% for AGIs below $25k, 1.0% for AGIs $25k-50k, 1.5% for AGIs $50k-75k, 1.8% for AGIs $75k-100k, 2.3% for AGIs $100k-200k, 2.2% for AGIs over 200k)
Taxes paid: $5,782 (reported on 22.5% of returns)
68104:
$5,782
State:
$9,758
(% of AGI for various income ranges: 1.0% for AGIs below $25k, 2.4% for AGIs $25k-50k, 3.8% for AGIs $50k-75k, 4.5% for AGIs $75k-100k, 6.2% for AGIs $100k-200k, 5.9% for AGIs over 200k)
Earned income credit: $2,545 (reported on 28.9% of returns)
Here:
$2,545
State:
$2,188
(% of AGI for various income ranges: 9.6% for AGIs below $25k, 1.4% for AGIs $25k-50k)
Percentage of individuals using paid preparers for their 2012 taxes: 43.8%
Here:
44%
State:
57%
(% for various income ranges: 42.4% for AGIs below $25k, 42.2% for AGIs $25k-50k, 46.8% for AGIs $50k-75k, 48.4% for AGIs $75k-100k, 53.0% for AGIs $100k-200k, 70.0% for AGIs over 200k)
Averages for the 2004 tax year for zip code 68104, filed in 2005:
Average Adjusted Gross Income (AGI) in 2004: $32,689 (Individual Income Tax Returns)
Here:
$32,689
State:
$44,271
Salary/wage: $31,463 (reported on 89.7% of returns)
Here:
$31,463
State:
$38,230
(% of AGI for various income ranges: 97.5% for AGIs below $10k, 83.6% for AGIs $10k-25k, 88.5% for AGIs $25k-50k, 87.7% for AGIs $50k-75k, 85.5% for AGIs $75k-100k, 79.8% for AGIs over 100k)
Taxable interest for individuals: $1,055 (reported on 29.6% of returns)
This zip code:
$1,055
Nebraska:
$1,759
(% of AGI for various income ranges: 2.8% for AGIs below $10k, 1.3% for AGIs $10k-25k, 0.9% for AGIs $25k-50k, 0.7% for AGIs $50k-75k, 0.8% for AGIs $75k-100k, 1.1% for AGIs over 100k)
Taxable dividends: $1,401 (reported on 15.2% of returns)
Here:
$1,401
State:
$2,804
(% of AGI for various income ranges: 1.5% for AGIs below $10k, 0.9% for AGIs $10k-25k, 0.5% for AGIs $25k-50k, 0.5% for AGIs $50k-75k, 0.6% for AGIs $75k-100k, 1.1% for AGIs over 100k)
Net capital gain/loss: +$1,584 (reported on 12.2% of returns)
Here:
+$1,584
State:
+$7,887
(% of AGI for various income ranges: -0.6% for AGIs below $10k, -0.0% for AGIs $10k-25k, 0.2% for AGIs $25k-50k, 0.7% for AGIs $50k-75k, 1.1% for AGIs $75k-100k, 2.1% for AGIs over 100k)
Profit/loss from business: +$5,893 (reported on 11.0% of returns)
Here:
+$5,893
State:
+$7,743
(% of AGI for various income ranges: 2.4% for AGIs below $10k, 2.9% for AGIs $10k-25k, 1.5% for AGIs $25k-50k, 1.5% for AGIs $50k-75k, 1.6% for AGIs $75k-100k, 3.5% for AGIs over 100k)
IRA payment deduction: $2,065 (reported on 2.3% of returns)
68104:
$2,065
Nebraska:
$2,902
(% of AGI for various income ranges: 0.2% for AGIs $10k-25k, 0.2% for AGIs $25k-50k, 0.2% for AGIs $50k-75k, 0.1% for AGIs $75k-100k, 0.1% for AGIs over 100k)
Self-employed pension: $10,143 (reported on 0.3% of returns)
Here:
$10,143
Nebraska:
$12,366
Total itemized deductions: $13,440 (24% of AGI, reported on 27.7% of returns)
Here:
$13,440
State:
$18,692
Here:
23.6% of AGI
State:
21.1% of AGI
(% of AGI for various income ranges: 5.5% for AGIs below $10k, 6.3% for AGIs $10k-25k, 10.9% for AGIs $25k-50k, 12.3% for AGIs $50k-75k, 14.6% for AGIs $75k-100k, 15.8% for AGIs over 100k)
Charity contributions deductions: $2,452 (4% of AGI, reported on 24.0% of returns)
Here:
$2,452
State:
$3,500
Here:
4.1% of AGI
State:
3.8% of AGI
(% of AGI for various income ranges: 0.5% for AGIs below $10k, 0.9% for AGIs $10k-25k, 1.4% for AGIs $25k-50k, 2.0% for AGIs $50k-75k, 2.8% for AGIs $75k-100k, 2.9% for AGIs over 100k)
Total tax: $3,749 (reported on 71.1% of returns)
68104:
$3,749
State:
$6,550
(% of AGI for various income ranges: 1.9% for AGIs below $10k, 3.8% for AGIs $10k-25k, 6.7% for AGIs $25k-50k, 8.6% for AGIs $50k-75k, 10.4% for AGIs $75k-100k, 16.1% for AGIs over 100k)
Earned income credit: $1,769 (reported on 22.5% of returns)
Here:
$1,769
State:
$1,643
Percentage of individuals using paid preparers for their 2004 taxes: 53.3%
Here:
53%
State:
62%
(% for various income ranges: 46.6% for AGIs below $10k, 55.2% for AGIs $10k-25k, 54.0% for AGIs $25k-50k, 54.1% for AGIs $50k-75k, 57.7% for AGIs $75k-100k, 60.3% for AGIs over 100k)
Likely homosexual households (counted as self-reported same-sex unmarried-partner households)
Lesbian couples: 0.1% of all households
Gay men: 0.2% of all households
Household received Food Stamps/SNAP in the past 12 months: 3,102 Household did not receive Food Stamps/SNAP in the past 12 months: 12,896
Women who had a birth in the past 12 months: 736 (442 now married, 265 unmarried) Women who did not have a birth in the past 12 months: 8,875 (3,471 now married, 5,406 unmarried)
Housing units in zip code 68104 with a mortgage: 6,602 (760 second mortgage, 23 home equity loan, 448 both second mortgage and home equity loan) Houses without a mortgage: 178
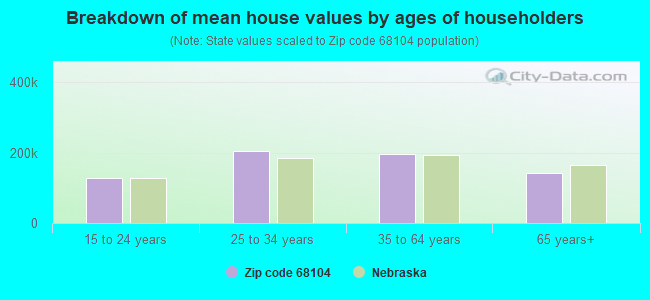
Median monthly owner costs for units with a mortgage: $1,254 Median monthly owner costs for units without a mortgage: $570
Residents with income below the poverty level in 2022:
This zip code:
17.4%
Whole state:
11.2%
Residents with income below 50% of the poverty level in 2022:
This zip code:
8.9%
Whole state:
6.1%
Median number of rooms in houses and condos:
Here:
6.3
State:
7.1
Median number of rooms in apartments:
Here:
4.6
State:
4.2
Notable locations in this zip code not listed on our city pages
Notable locations in zip code 68104: Saint James Orphanage (A), Benson Branch Library (B), Omaha Home for the Boys Visitors Center and History Museum (C), Omaha Fire and Rescue Station 41 (D), Omaha Fire and Rescue Station 24 (E), Benson Chiropractic Clinic (F), Benson Family Dentistry Center (G), Omaha Ambulance Service (H), American Ambulance Incorporated (I), Baker Place Medical Associates Center (J), Maple-Crest Care Center (K). Display/hide their locations on the map
Churches in zip code 68104 include: Pilgrim Christian Church (A), Omaha Gospel Hall (B), Saint Bernards Church (C), Shepherd of the Hills Lutheran Church (D), Lords House (E), Park Lane Baptist Church (F), Mount View Presbyterian Church (G), Church of Christ (H), Saint Paul Lutheran Church (I). Display/hide their locations on the map
Parks in zip code 68104 include: Fontenelle Park (1), Gallagher Park (2), Grace Young Park (3), Lake James Park (4), Metcalfe Park (5), Country Club Manor Park (6), Bowling Green Park (7), Orchard Park (8), Lions Park (9). Display/hide their locations on the map
5,622 married couples with children.
2,788 single-parent households (303 men, 2,485 women).
81.9% of residents of 68104 zip code speak English at home.
4.8% of residents speak Spanish at home (62% very well, 19% well, 13% not well, 7% not at all).
1.5% of residents speak other Indo-European language at home (41% very well, 31% well, 28% not well).
8.8% of residents speak Asian or Pacific Island language at home (31% very well, 26% well, 23% not well, 19% not at all).
1.2% of residents speak other language at home (58% very well, 40% well, 2% not well).
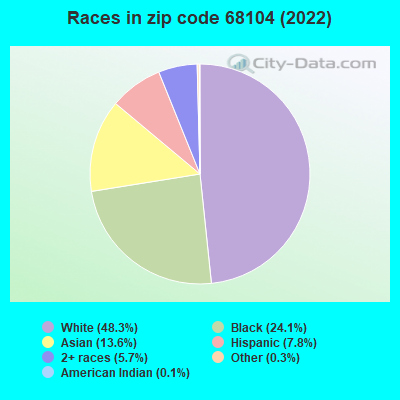
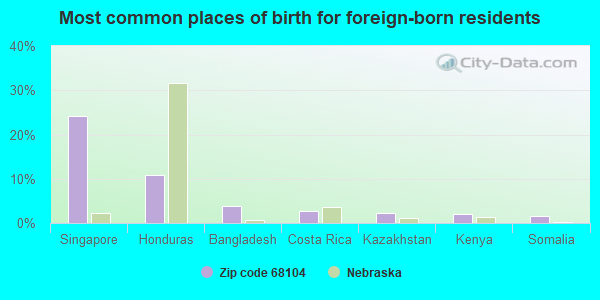
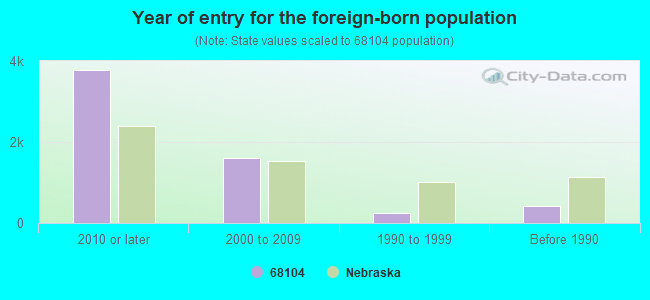
Foreign born population: 5,225 (13.7%) (33.5% of them are naturalized citizens)
Major facilities with environmental interests located in this zip code:
BENSON HIGH SCHOOL (5120 MAPLE ST in OMAHA, NE)
AIR MINOR (AIRS/AFS) (Geographic Names Information System) (National Center for Education Statistics) - STATE ID-280001001 STATE MASTER (Nebraska tracking) - AIR PROGRAM, -12069-DWT-0900, LEAKING STORAGE TANK Conditionally Exempt Small Quantity Generators, less than 100 kg/month of hazardous waste (Resource Conservation and Recovery Act (tracking hazardous waste)) Business SIC classification: ELEMENTARY AND SECONDARY SCHOOLS Organizations: OMAHA PUBLIC SCHOOLS (CONTACT/OPERATOR)
Alternative names: BENSON HIGH SCHOOL OMAHA PUBLIC SCHOOLS
WAKONDA ELEMENTARY SCHOOL (4845 CURTIS AVE in OMAHA, NE)
(National Center for Education Statistics) - STATE ID-280001185 STATE MASTER (Nebraska tracking) - -092989-99-0007, LEAKING STORAGE TANK, -APHO-0111, Organizations: OMAHA PUBLIC SCHOOLS (SCHOOL DISTRICT)
Alternative names: WAKONDA ELEM SCHOOL
COMMERCIAL FEDERAL BANK (5901 NORTHWEST RADIAL HWY in OMAHA, NE)
STATE MASTER (Nebraska tracking) - HAZARDOUS WASTE PROGRAM (Resource Conservation and Recovery Act (tracking hazardous waste))
GRISWOLD SERVICE (5504 NORTHWEST RADIAL HIGHWAY in OMAHA, NE)
AIR MINOR (AIRS/AFS) STATE MASTER (Nebraska tracking) - -020698-TH-0600, LEAKING STORAGE TANK, -0002800395, EPCRA Business SIC classification: GENERAL AUTOMOTIVE REPAIR SHOPS
BUDGET PAINTING INC (6129 MILITARY AVENUE in OMAHA, NE)
STATE MASTER (Nebraska tracking) - HAZARDOUS WASTE PROGRAM Conditionally Exempt Small Quantity Generators, less than 100 kg/month of hazardous waste (Resource Conservation and Recovery Act (tracking hazardous waste)) - notification Organizations: FRANK TIERNEY (CONTACT/OWNER)
MARK DAVID FLOORS (7052 MAPLE STREET in OMAHA, NE)
STATE MASTER (Nebraska tracking) - HAZARDOUS WASTE PROGRAM Conditionally Exempt Small Quantity Generators, less than 100 kg/month of hazardous waste (Resource Conservation and Recovery Act (tracking hazardous waste)) - notification
MAX I WALKER (5908 MAPLE in OMAHA, NE)
STATE MASTER (Nebraska tracking) - HAZARDOUS WASTE PROGRAM Small Quantity Generators, between 100 kg and 1000 kg of hazardous waste/month (Resource Conservation and Recovery Act (tracking hazardous waste)) - notification Organizations: WALKER ROBERT (CONTACT/OWNER)
Alternative names: MAX I WALKER CLEANERS
BENSON WEST ELEM SCHOOL ( in OMAHA, NE)
(National Center for Education Statistics) - STATE ID-280001065 Organizations: OMAHA PUBLIC SCHOOLS (SCHOOL DISTRICT)
FIRESTONE TIRE& SERVICE CTR (5914 AMES AVE in OMAHA, NE)
ENFORCEMENT/COMPLIANCE ACTIVITY (Integrated Compliance Information System) STATE MASTER (Nebraska tracking) - -021194-JF-1050, LEAKING STORAGE TANK, -AP7391,
FONTENELLE ELEM SCHOOL ( in OMAHA, NE)
(National Center for Education Statistics) - STATE ID-280001101 Organizations: OMAHA PUBLIC SCHOOLS (SCHOOL DISTRICT)
HARTMAN ELEM SCHOOL ( in OMAHA, NE)
(National Center for Education Statistics) - STATE ID-280001111 Organizations: OMAHA PUBLIC SCHOOLS (SCHOOL DISTRICT)
C C JOHNSON ACE HARDWARE (6068 MAPLE ST in OMAHA, NE)
COMPLIANCE ACTIVITY (Tracking inspections of insecticide, fungicide, and rodenticide, and toxic substances) Alternative names: ACE HARDWARE STORE
Housing units lacking complete plumbing facilities: 0.4% Housing units lacking complete kitchen facilities: 1.6%
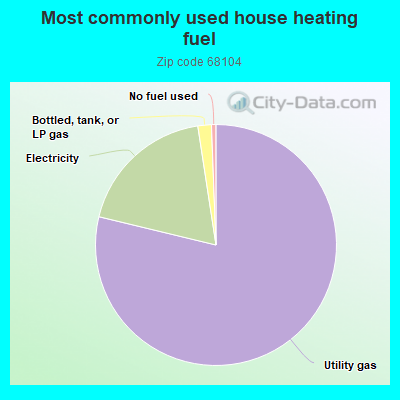
78.7%Utility gas
18.8%Electricity
1.8%Bottled, tank, or LP gas
0.6%No fuel used
Population in 1990: 35,325. Population change in the 1990s: +124 (+0.4%).
Place of birth for U.S.-born residents:
This state: 21,543
Northeast: 637
Midwest: 4,274
South: 3,179
West: 2,446
56% of the 68104 zip code residents lived in the same house 5 years ago. Out of people who lived in different houses, 72% lived in this county. Out of people who lived in different counties, 50% lived in Nebraska.
90% of the 68104 zip code residents lived in the same house 1 year ago. Out of people who lived in different houses, 70% moved from this county. Out of people who lived in different houses, 8% moved from different county within same state. Out of people who lived in different houses, 16% moved from different state. Out of people who lived in different houses, 6% moved from abroad.
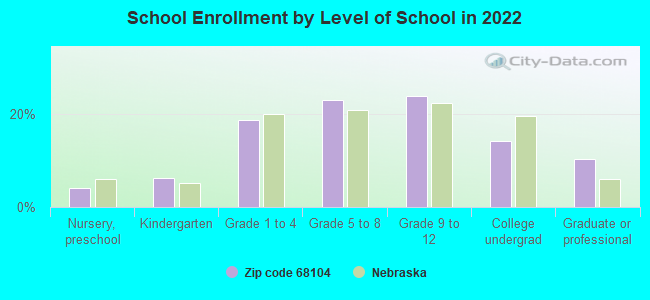
Private vs. public school enrollment:
Students in private schools in grades 1 to 8 (elementary and middle school): 447
Here:
11.6%
Nebraska:
14.1%
Students in private schools in grades 9 to 12 (high school): 309
Here:
14.0%
Nebraska:
12.5%
Students in private undergraduate colleges: 219
Here:
16.5%
Nebraska:
18.0%
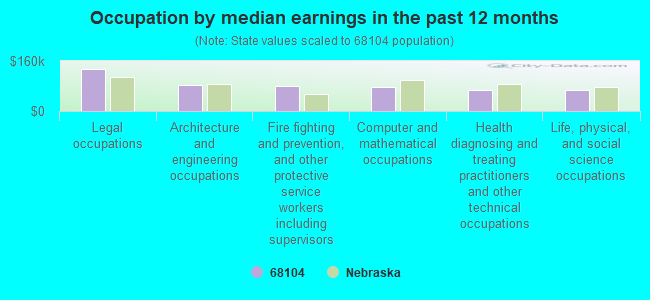
Occupation by median earnings in the past 12 months ($)
135,383Legal occupations
82,301Architecture and engineering occupations
79,893Fire fighting and prevention, and other protective service workers including supervisors
77,510Computer and mathematical occupations
68,193Health diagnosing and treating practitioners and other technical occupations
66,393Life, physical, and social science occupations
Companies with federal contracts located in this zip code:
MAGGETT INC (4653 CAMDEN AVE in OMAHA, NE; small business) : $89,562 in 3 contractsfrom 2001 to 2005
$44,669 with Air Force for Building Components, Prefabricated. Signed on 2005-09-17. Completion date: 2005-11-15.
$33,274 with Air Force for Maintenance, Repair or Alteration of Real Property -- Other Residential Buildings. Signed on 2005-09-30. Completion date: 2005-12-16.
$11,619 with Navy for Maintenance, Repair or Alteration of Real Property -- Miscellaneous Buildings. Signed on 2001-10-01. Completion date: 2001-07-06.
TERESA ARMAGAN (2005 N 50TH STREET in OMAHA, NE; small business) : $81,425 in 2 contractsin 2002
$45,323 with U.S. Army Corps of Engineers - civil program financing only for Digitizing Services. Includes cartographic and geographic information.. Signed on 2002-11-27. Completion date: 2003-09-30.
$36,102, same as above.Signed on 2002-02-08. Completion date: 2003-09-30.
HRONEK ASSOCIATES INC (5011 N 54TH ST in OMAHA, NE; small business)
$7,479 with Army for Engineering and Technical Services. Taking place in SD. Signed on 2003-06-30. Completion date: 2004-04-10.
Top industries in this zip code by the number of employees in 2005:
Health Care and Social Assistance: Nursing Care Facilities (100-249 employees: 2 establishments, 50-99 employees: 2 establishments)
Other Services (except Public Administration): Religious Organizations (100-249: 1, 20-49: 2, 10-19: 3, 5-9: 8, 1-4: 11)
2002 - 2018 National Fire Incident Reporting System (NFIRS) incidents
Based on the data from the years 2002 - 2018 the average number of fire incidents per year is 133. The highest number of fires - 179 took place in 2003, and the least - 100 in 2011. The data has a decreasing trend.
When looking into fire subcategories, the most reports belonged to: Structure Fires (42.7%), and Outside Fires (35.4%).
Fire incident types reported to NFIRS in Zip Code 68104


 Nearest zip codes: 68132, 68111, 68134, 68131, 68106, 68114.


 Based on the data from the years 2002 - 2018 the average number of fire incidents per year is 133. The highest number of fires - 179 took place in 2003, and the least - 100 in 2011. The data has a decreasing trend.
 When looking into fire subcategories, the most reports belonged to: Structure Fires (42.7%), and Outside Fires (35.4%).