Estimated zip code population in 2022: 18,288
Zip code population in 2010: 15,137
Zip code population in 2000: 13,580
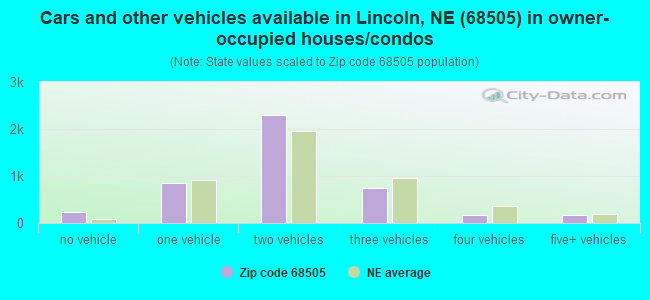
Houses and condos: 7,936
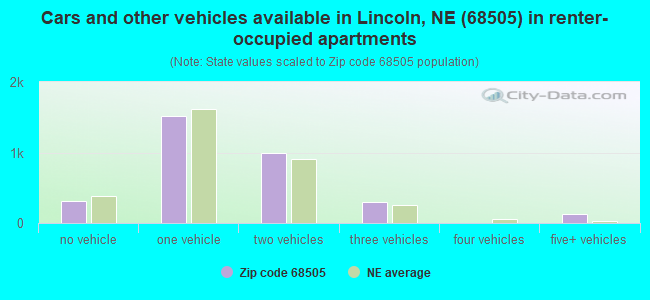
Renter-occupied apartments: 3,248
% of renters here:
42%State:
34%
March 2022 cost of living index in zip code 68505: 84.5
(less than average, U.S. average is 100)
Land area: 3.7
sq. mi.
Water area: 0.0
sq. mi.
Population density: 4,879 people per square mile (average).
OSM Map
General Map
Google Map
MSN Map
OSM Map
General Map
Google Map
MSN Map
OSM Map
General Map
Google Map
MSN Map
OSM Map
General Map
Google Map
MSN Map
Please wait while loading the map...
Real estate property taxes paid for housing units in 2022:
This zip code:
1.4% ($3,261)Nebraska:
1.4% ($3,313)
Median real estate property taxes paid for housing units with mortgages in 2022: $3,352 (1.4%)
Median real estate property taxes paid for housing units with no mortgage in 2022: $3,080 (1.5%)
Profiles of local businesses
Business Search - 14 Million verified businesses
Males: 9,568 Females: 8,720
For population 25 years and over in 68505:
High school or higher: 95.5%Bachelor's degree or higher: 35.0%Graduate or professional degree: 11.9%Unemployed: 2.1%Mean travel time to work (commute): 18.7 minutes
For population 15 years and over in 68505:
Never married: 37.8%Now married: 47.9%Separated: 0.6%Widowed: 4.0%Divorced: 9.7%
Zip code 68505 compared to state average:
Hispanic race population percentage below state average. Median age below state average. Length of stay since moving in significantly above state average. 15,143 82.8% White 988 5.4% Two or more races 796 4.4% Asian 794 4.3% Hispanic or Latino 556 3.0% Black 9 0.05% American Indian
Data:
Median household income ($)
Median household income (% change since 2000)
Household income diversity
Ratio of average income to average house value (%)
Ratio of average income to average rent
Median household income ($) - White
Median household income ($) - Black or African American
Median household income ($) - Asian
Median household income ($) - Hispanic or Latino
Median household income ($) - American Indian and Alaska Native
Median household income ($) - Multirace
Median household income ($) - Other Race
Median household income for houses/condos with a mortgage ($)
Median household income for apartments without a mortgage ($)
Races - White alone (%)
Races - White alone (% change since 2000)
Races - Black alone (%)
Races - Black alone (% change since 2000)
Races - American Indian alone (%)
Races - American Indian alone (% change since 2000)
Races - Asian alone (%)
Races - Asian alone (% change since 2000)
Races - Hispanic (%)
Races - Hispanic (% change since 2000)
Races - Native Hawaiian and Other Pacific Islander alone (%)
Races - Native Hawaiian and Other Pacific Islander alone (% change since 2000)
Races - Two or more races (%)
Races - Two or more races (% change since 2000)
Races - Other race alone (%)
Races - Other race alone (% change since 2000)
Racial diversity
Unemployment (%)
Unemployment (% change since 2000)
Unemployment (%) - White
Unemployment (%) - Black or African American
Unemployment (%) - Asian
Unemployment (%) - Hispanic or Latino
Unemployment (%) - American Indian and Alaska Native
Unemployment (%) - Multirace
Unemployment (%) - Other Race
Population density (people per square mile)
Population - Males (%)
Population - Females (%)
Population - Males (%) - White
Population - Males (%) - Black or African American
Population - Males (%) - Asian
Population - Males (%) - Hispanic or Latino
Population - Males (%) - American Indian and Alaska Native
Population - Males (%) - Multirace
Population - Males (%) - Other Race
Population - Females (%) - White
Population - Females (%) - Black or African American
Population - Females (%) - Asian
Population - Females (%) - Hispanic or Latino
Population - Females (%) - American Indian and Alaska Native
Population - Females (%) - Multirace
Population - Females (%) - Other Race
Coronavirus confirmed cases (Apr 27, 2024)
Deaths caused by coronavirus (Apr 27, 2024)
Coronavirus confirmed cases (per 100k population) (Apr 27, 2024)
Deaths caused by coronavirus (per 100k population) (Apr 27, 2024)
Daily increase in number of cases (Apr 27, 2024)
Weekly increase in number of cases (Apr 27, 2024)
Cases doubled (in days) (Apr 27, 2024)
Hospitalized patients (Apr 18, 2022)
Negative test results (Apr 18, 2022)
Total test results (Apr 18, 2022)
COVID Vaccine doses distributed (per 100k population) (Sep 19, 2023)
COVID Vaccine doses administered (per 100k population) (Sep 19, 2023)
COVID Vaccine doses distributed (Sep 19, 2023)
COVID Vaccine doses administered (Sep 19, 2023)
Likely homosexual households (%)
Likely homosexual households (% change since 2000)
Likely homosexual households - Lesbian couples (%)
Likely homosexual households - Lesbian couples (% change since 2000)
Likely homosexual households - Gay men (%)
Likely homosexual households - Gay men (% change since 2000)
Cost of living index
Median gross rent ($)
Median contract rent ($)
Median monthly housing costs ($)
Median house or condo value ($)
Median house or condo value ($ change since 2000)
Mean house or condo value by units in structure - 1, detached ($)
Mean house or condo value by units in structure - 1, attached ($)
Mean house or condo value by units in structure - 2 ($)
Mean house or condo value by units in structure by units in structure - 3 or 4 ($)
Mean house or condo value by units in structure - 5 or more ($)
Mean house or condo value by units in structure - Boat, RV, van, etc. ($)
Mean house or condo value by units in structure - Mobile home ($)
Median house or condo value ($) - White
Median house or condo value ($) - Black or African American
Median house or condo value ($) - Asian
Median house or condo value ($) - Hispanic or Latino
Median house or condo value ($) - American Indian and Alaska Native
Median house or condo value ($) - Multirace
Median house or condo value ($) - Other Race
Median resident age
Resident age diversity
Median resident age - Males
Median resident age - Females
Median resident age - White
Median resident age - Black or African American
Median resident age - Asian
Median resident age - Hispanic or Latino
Median resident age - American Indian and Alaska Native
Median resident age - Multirace
Median resident age - Other Race
Median resident age - Males - White
Median resident age - Males - Black or African American
Median resident age - Males - Asian
Median resident age - Males - Hispanic or Latino
Median resident age - Males - American Indian and Alaska Native
Median resident age - Males - Multirace
Median resident age - Males - Other Race
Median resident age - Females - White
Median resident age - Females - Black or African American
Median resident age - Females - Asian
Median resident age - Females - Hispanic or Latino
Median resident age - Females - American Indian and Alaska Native
Median resident age - Females - Multirace
Median resident age - Females - Other Race
Commute - mean travel time to work (minutes)
Travel time to work - Less than 5 minutes (%)
Travel time to work - Less than 5 minutes (% change since 2000)
Travel time to work - 5 to 9 minutes (%)
Travel time to work - 5 to 9 minutes (% change since 2000)
Travel time to work - 10 to 19 minutes (%)
Travel time to work - 10 to 19 minutes (% change since 2000)
Travel time to work - 20 to 29 minutes (%)
Travel time to work - 20 to 29 minutes (% change since 2000)
Travel time to work - 30 to 39 minutes (%)
Travel time to work - 30 to 39 minutes (% change since 2000)
Travel time to work - 40 to 59 minutes (%)
Travel time to work - 40 to 59 minutes (% change since 2000)
Travel time to work - 60 to 89 minutes (%)
Travel time to work - 60 to 89 minutes (% change since 2000)
Travel time to work - 90 or more minutes (%)
Travel time to work - 90 or more minutes (% change since 2000)
Marital status - Never married (%)
Marital status - Now married (%)
Marital status - Separated (%)
Marital status - Widowed (%)
Marital status - Divorced (%)
Median family income ($)
Median family income (% change since 2000)
Median non-family income ($)
Median non-family income (% change since 2000)
Median per capita income ($)
Median per capita income (% change since 2000)
Median family income ($) - White
Median family income ($) - Black or African American
Median family income ($) - Asian
Median family income ($) - Hispanic or Latino
Median family income ($) - American Indian and Alaska Native
Median family income ($) - Multirace
Median family income ($) - Other Race
Median year house/condo built
Median year apartment built
Year house built - Built 2005 or later (%)
Year house built - Built 2000 to 2004 (%)
Year house built - Built 1990 to 1999 (%)
Year house built - Built 1980 to 1989 (%)
Year house built - Built 1970 to 1979 (%)
Year house built - Built 1960 to 1969 (%)
Year house built - Built 1950 to 1959 (%)
Year house built - Built 1940 to 1949 (%)
Year house built - Built 1939 or earlier (%)
Average household size
Household density (households per square mile)
Average household size - White
Average household size - Black or African American
Average household size - Asian
Average household size - Hispanic or Latino
Average household size - American Indian and Alaska Native
Average household size - Multirace
Average household size - Other Race
Occupied housing units (%)
Vacant housing units (%)
Owner occupied housing units (%)
Renter occupied housing units (%)
Vacancy status - For rent (%)
Vacancy status - For sale only (%)
Vacancy status - Rented or sold, not occupied (%)
Vacancy status - For seasonal, recreational, or occasional use (%)
Vacancy status - For migrant workers (%)
Vacancy status - Other vacant (%)
Residents with income below the poverty level (%)
Residents with income below 50% of the poverty level (%)
Children below poverty level (%)
Poor families by family type - Married-couple family (%)
Poor families by family type - Male, no wife present (%)
Poor families by family type - Female, no husband present (%)
Poverty status for native-born residents (%)
Poverty status for foreign-born residents (%)
Poverty among high school graduates not in families (%)
Poverty among people who did not graduate high school not in families (%)
Residents with income below the poverty level (%) - White
Residents with income below the poverty level (%) - Black or African American
Residents with income below the poverty level (%) - Asian
Residents with income below the poverty level (%) - Hispanic or Latino
Residents with income below the poverty level (%) - American Indian and Alaska Native
Residents with income below the poverty level (%) - Multirace
Residents with income below the poverty level (%) - Other Race
Air pollution - Air Quality Index (AQI)
Air pollution - CO
Air pollution - NO2
Air pollution - SO2
Air pollution - Ozone
Air pollution - PM10
Air pollution - PM25
Air pollution - Pb
Crime - Murders per 100,000 population
Crime - Rapes per 100,000 population
Crime - Robberies per 100,000 population
Crime - Assaults per 100,000 population
Crime - Burglaries per 100,000 population
Crime - Thefts per 100,000 population
Crime - Auto thefts per 100,000 population
Crime - Arson per 100,000 population
Crime - City-data.com crime index
Crime - Violent crime index
Crime - Property crime index
Crime - Murders per 100,000 population (5 year average)
Crime - Rapes per 100,000 population (5 year average)
Crime - Robberies per 100,000 population (5 year average)
Crime - Assaults per 100,000 population (5 year average)
Crime - Burglaries per 100,000 population (5 year average)
Crime - Thefts per 100,000 population (5 year average)
Crime - Auto thefts per 100,000 population (5 year average)
Crime - Arson per 100,000 population (5 year average)
Crime - City-data.com crime index (5 year average)
Crime - Violent crime index (5 year average)
Crime - Property crime index (5 year average)
1996 Presidential Elections Results (%) - Democratic Party (Clinton)
1996 Presidential Elections Results (%) - Republican Party (Dole)
1996 Presidential Elections Results (%) - Other
2000 Presidential Elections Results (%) - Democratic Party (Gore)
2000 Presidential Elections Results (%) - Republican Party (Bush)
2000 Presidential Elections Results (%) - Other
2004 Presidential Elections Results (%) - Democratic Party (Kerry)
2004 Presidential Elections Results (%) - Republican Party (Bush)
2004 Presidential Elections Results (%) - Other
2008 Presidential Elections Results (%) - Democratic Party (Obama)
2008 Presidential Elections Results (%) - Republican Party (McCain)
2008 Presidential Elections Results (%) - Other
2012 Presidential Elections Results (%) - Democratic Party (Obama)
2012 Presidential Elections Results (%) - Republican Party (Romney)
2012 Presidential Elections Results (%) - Other
2016 Presidential Elections Results (%) - Democratic Party (Clinton)
2016 Presidential Elections Results (%) - Republican Party (Trump)
2016 Presidential Elections Results (%) - Other
2020 Presidential Elections Results (%) - Democratic Party (Biden)
2020 Presidential Elections Results (%) - Republican Party (Trump)
2020 Presidential Elections Results (%) - Other
Ancestries Reported - Arab (%)
Ancestries Reported - Czech (%)
Ancestries Reported - Danish (%)
Ancestries Reported - Dutch (%)
Ancestries Reported - English (%)
Ancestries Reported - French (%)
Ancestries Reported - French Canadian (%)
Ancestries Reported - German (%)
Ancestries Reported - Greek (%)
Ancestries Reported - Hungarian (%)
Ancestries Reported - Irish (%)
Ancestries Reported - Italian (%)
Ancestries Reported - Lithuanian (%)
Ancestries Reported - Norwegian (%)
Ancestries Reported - Polish (%)
Ancestries Reported - Portuguese (%)
Ancestries Reported - Russian (%)
Ancestries Reported - Scotch-Irish (%)
Ancestries Reported - Scottish (%)
Ancestries Reported - Slovak (%)
Ancestries Reported - Subsaharan African (%)
Ancestries Reported - Swedish (%)
Ancestries Reported - Swiss (%)
Ancestries Reported - Ukrainian (%)
Ancestries Reported - United States (%)
Ancestries Reported - Welsh (%)
Ancestries Reported - West Indian (%)
Ancestries Reported - Other (%)
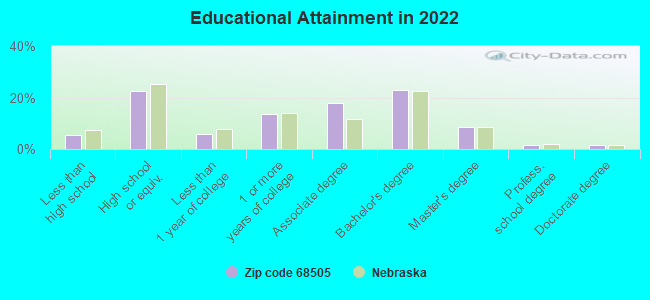
Educational Attainment - No schooling completed (%)
Educational Attainment - Less than high school (%)
Educational Attainment - High school or equivalent (%)
Educational Attainment - Less than 1 year of college (%)
Educational Attainment - 1 or more years of college (%)
Educational Attainment - Associate degree (%)
Educational Attainment - Bachelor's degree (%)
Educational Attainment - Master's degree (%)
Educational Attainment - Professional school degree (%)
Educational Attainment - Doctorate degree (%)
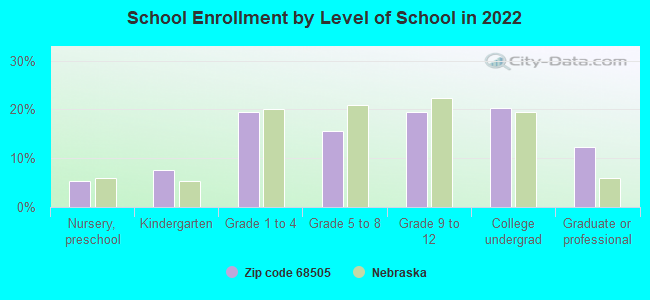
School Enrollment - Nursery, preschool (%)
School Enrollment - Kindergarten (%)
School Enrollment - Grade 1 to 4 (%)
School Enrollment - Grade 5 to 8 (%)
School Enrollment - Grade 9 to 12 (%)
School Enrollment - College undergrad (%)
School Enrollment - Graduate or professional (%)
School Enrollment - Not enrolled in school (%)
School enrollment - Public schools (%)
School enrollment - Private schools (%)
School enrollment - Not enrolled (%)
Median number of rooms in houses and condos
Median number of rooms in apartments
Housing units lacking complete plumbing facilities (%)
Housing units lacking complete kitchen facilities (%)
Density of houses
Urban houses (%)
Rural houses (%)
Households with people 60 years and over (%)
Households with people 65 years and over (%)
Households with people 75 years and over (%)
Households with one or more nonrelatives (%)
Households with no nonrelatives (%)
Population in households (%)
Family households (%)
Nonfamily households (%)
Population in families (%)
Family households with own children (%)
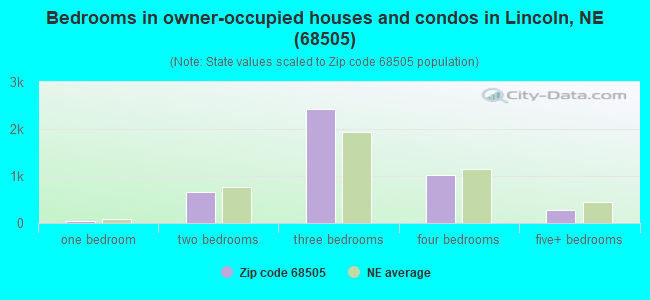
Median number of bedrooms in owner occupied houses
Mean number of bedrooms in owner occupied houses
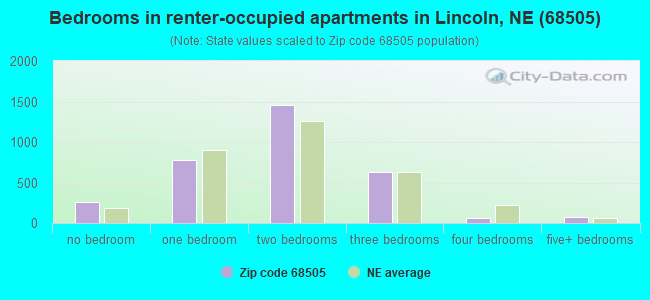
Median number of bedrooms in renter occupied houses
Mean number of bedrooms in renter occupied houses
Median number of vehichles in owner occupied houses
Mean number of vehichles in owner occupied houses
Median number of vehichles in renter occupied houses
Mean number of vehichles in renter occupied houses
Mortgage status - with mortgage (%)
Mortgage status - with second mortgage (%)
Mortgage status - with home equity loan (%)
Mortgage status - with both second mortgage and home equity loan (%)
Mortgage status - without a mortgage (%)
Average family size
Average family size - White
Average family size - Black or African American
Average family size - Asian
Average family size - Hispanic or Latino
Average family size - American Indian and Alaska Native
Average family size - Multirace
Average family size - Other Race
Geographical mobility - Same house 1 year ago (%)
Geographical mobility - Moved within same county (%)
Geographical mobility - Moved from different county within same state (%)
Geographical mobility - Moved from different state (%)
Geographical mobility - Moved from abroad (%)
Place of birth - Born in state of residence (%)
Place of birth - Born in other state (%)
Place of birth - Native, outside of US (%)
Place of birth - Foreign born (%)
Housing units in structures - 1, detached (%)
Housing units in structures - 1, attached (%)
Housing units in structures - 2 (%)
Housing units in structures - 3 or 4 (%)
Housing units in structures - 5 to 9 (%)
Housing units in structures - 10 to 19 (%)
Housing units in structures - 20 to 49 (%)
Housing units in structures - 50 or more (%)
Housing units in structures - Mobile home (%)
Housing units in structures - Boat, RV, van, etc. (%)
House/condo owner moved in on average (years ago)
Renter moved in on average (years ago)
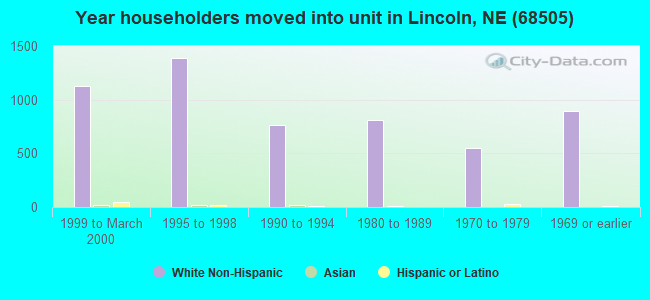
Year householder moved into unit - Moved in 1999 to March 2000 (%)
Year householder moved into unit - Moved in 1995 to 1998 (%)
Year householder moved into unit - Moved in 1990 to 1994 (%)
Year householder moved into unit - Moved in 1980 to 1989 (%)
Year householder moved into unit - Moved in 1970 to 1979 (%)
Year householder moved into unit - Moved in 1969 or earlier (%)
Means of transportation to work - Drove car alone (%)
Means of transportation to work - Carpooled (%)
Means of transportation to work - Public transportation (%)
Means of transportation to work - Bus or trolley bus (%)
Means of transportation to work - Streetcar or trolley car (%)
Means of transportation to work - Subway or elevated (%)
Means of transportation to work - Railroad (%)
Means of transportation to work - Ferryboat (%)
Means of transportation to work - Taxicab (%)
Means of transportation to work - Motorcycle (%)
Means of transportation to work - Bicycle (%)
Means of transportation to work - Walked (%)
Means of transportation to work - Other means (%)
Working at home (%)
Industry diversity
Most Common Industries - Agriculture, forestry, fishing and hunting, and mining (%)
Most Common Industries - Agriculture, forestry, fishing and hunting (%)
Most Common Industries - Mining, quarrying, and oil and gas extraction (%)
Most Common Industries - Construction (%)
Most Common Industries - Manufacturing (%)
Most Common Industries - Wholesale trade (%)
Most Common Industries - Retail trade (%)
Most Common Industries - Transportation and warehousing, and utilities (%)
Most Common Industries - Transportation and warehousing (%)
Most Common Industries - Utilities (%)
Most Common Industries - Information (%)
Most Common Industries - Finance and insurance, and real estate and rental and leasing (%)
Most Common Industries - Finance and insurance (%)
Most Common Industries - Real estate and rental and leasing (%)
Most Common Industries - Professional, scientific, and management, and administrative and waste management services (%)
Most Common Industries - Professional, scientific, and technical services (%)
Most Common Industries - Management of companies and enterprises (%)
Most Common Industries - Administrative and support and waste management services (%)
Most Common Industries - Educational services, and health care and social assistance (%)
Most Common Industries - Educational services (%)
Most Common Industries - Health care and social assistance (%)
Most Common Industries - Arts, entertainment, and recreation, and accommodation and food services (%)
Most Common Industries - Arts, entertainment, and recreation (%)
Most Common Industries - Accommodation and food services (%)
Most Common Industries - Other services, except public administration (%)
Most Common Industries - Public administration (%)
Occupation diversity
Most Common Occupations - Management, business, science, and arts occupations (%)
Most Common Occupations - Management, business, and financial occupations (%)
Most Common Occupations - Management occupations (%)
Most Common Occupations - Business and financial operations occupations (%)
Most Common Occupations - Computer, engineering, and science occupations (%)
Most Common Occupations - Computer and mathematical occupations (%)
Most Common Occupations - Architecture and engineering occupations (%)
Most Common Occupations - Life, physical, and social science occupations (%)
Most Common Occupations - Education, legal, community service, arts, and media occupations (%)
Most Common Occupations - Community and social service occupations (%)
Most Common Occupations - Legal occupations (%)
Most Common Occupations - Education, training, and library occupations (%)
Most Common Occupations - Arts, design, entertainment, sports, and media occupations (%)
Most Common Occupations - Healthcare practitioners and technical occupations (%)
Most Common Occupations - Health diagnosing and treating practitioners and other technical occupations (%)
Most Common Occupations - Health technologists and technicians (%)
Most Common Occupations - Service occupations (%)
Most Common Occupations - Healthcare support occupations (%)
Most Common Occupations - Protective service occupations (%)
Most Common Occupations - Fire fighting and prevention, and other protective service workers including supervisors (%)
Most Common Occupations - Law enforcement workers including supervisors (%)
Most Common Occupations - Food preparation and serving related occupations (%)
Most Common Occupations - Building and grounds cleaning and maintenance occupations (%)
Most Common Occupations - Personal care and service occupations (%)
Most Common Occupations - Sales and office occupations (%)
Most Common Occupations - Sales and related occupations (%)
Most Common Occupations - Office and administrative support occupations (%)
Most Common Occupations - Natural resources, construction, and maintenance occupations (%)
Most Common Occupations - Farming, fishing, and forestry occupations (%)
Most Common Occupations - Construction and extraction occupations (%)
Most Common Occupations - Installation, maintenance, and repair occupations (%)
Most Common Occupations - Production, transportation, and material moving occupations (%)
Most Common Occupations - Production occupations (%)
Most Common Occupations - Transportation occupations (%)
Most Common Occupations - Material moving occupations (%)
People in Group quarters - Institutionalized population (%)
People in Group quarters - Correctional institutions (%)
People in Group quarters - Federal prisons and detention centers (%)
People in Group quarters - Halfway houses (%)
People in Group quarters - Local jails and other confinement facilities (including police lockups) (%)
People in Group quarters - Military disciplinary barracks (%)
People in Group quarters - State prisons (%)
People in Group quarters - Other types of correctional institutions (%)
People in Group quarters - Nursing homes (%)
People in Group quarters - Hospitals/wards, hospices, and schools for the handicapped (%)
People in Group quarters - Hospitals/wards and hospices for chronically ill (%)
People in Group quarters - Hospices or homes for chronically ill (%)
People in Group quarters - Military hospitals or wards for chronically ill (%)
People in Group quarters - Other hospitals or wards for chronically ill (%)
People in Group quarters - Hospitals or wards for drug/alcohol abuse (%)
People in Group quarters - Mental (Psychiatric) hospitals or wards (%)
People in Group quarters - Schools, hospitals, or wards for the mentally retarded (%)
People in Group quarters - Schools, hospitals, or wards for the physically handicapped (%)
People in Group quarters - Institutions for the deaf (%)
People in Group quarters - Institutions for the blind (%)
People in Group quarters - Orthopedic wards and institutions for the physically handicapped (%)
People in Group quarters - Wards in general hospitals for patients who have no usual home elsewhere (%)
People in Group quarters - Wards in military hospitals for patients who have no usual home elsewhere (%)
People in Group quarters - Juvenile institutions (%)
People in Group quarters - Long-term care (%)
People in Group quarters - Homes for abused, dependent, and neglected children (%)
People in Group quarters - Residential treatment centers for emotionally disturbed children (%)
People in Group quarters - Training schools for juvenile delinquents (%)
People in Group quarters - Short-term care, detention or diagnostic centers for delinquent children (%)
People in Group quarters - Type of juvenile institution unknown (%)
People in Group quarters - Noninstitutionalized population (%)
People in Group quarters - College dormitories (includes college quarters off campus) (%)
People in Group quarters - Military quarters (%)
People in Group quarters - On base (%)
People in Group quarters - Barracks, unaccompanied personnel housing (UPH), (Enlisted/Officer), ;and similar group living quarters for military personnel (%)
People in Group quarters - Transient quarters for temporary residents (%)
People in Group quarters - Military ships (%)
People in Group quarters - Group homes (%)
People in Group quarters - Homes or halfway houses for drug/alcohol abuse (%)
People in Group quarters - Homes for the mentally ill (%)
People in Group quarters - Homes for the mentally retarded (%)
People in Group quarters - Homes for the physically handicapped (%)
People in Group quarters - Other group homes (%)
People in Group quarters - Religious group quarters (%)
People in Group quarters - Dormitories (%)
People in Group quarters - Agriculture workers' dormitories on farms (%)
People in Group quarters - Job Corps and vocational training facilities (%)
People in Group quarters - Other workers' dormitories (%)
People in Group quarters - Crews of maritime vessels (%)
People in Group quarters - Other nonhousehold living situations (%)
People in Group quarters - Other noninstitutional group quarters (%)
Residents speaking English at home (%)
Residents speaking English at home - Born in the United States (%)
Residents speaking English at home - Native, born elsewhere (%)
Residents speaking English at home - Foreign born (%)
Residents speaking Spanish at home (%)
Residents speaking Spanish at home - Born in the United States (%)
Residents speaking Spanish at home - Native, born elsewhere (%)
Residents speaking Spanish at home - Foreign born (%)
Residents speaking other language at home (%)
Residents speaking other language at home - Born in the United States (%)
Residents speaking other language at home - Native, born elsewhere (%)
Residents speaking other language at home - Foreign born (%)
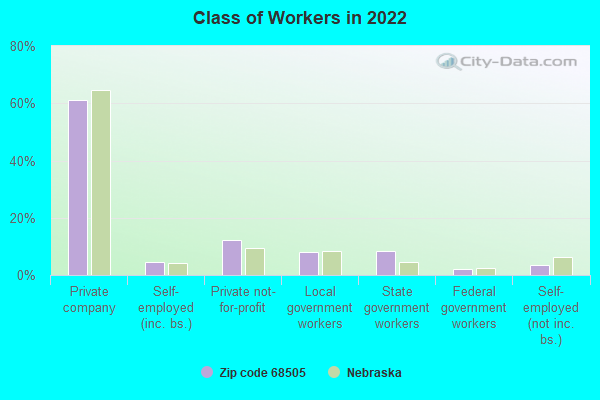
Class of Workers - Employee of private company (%)
Class of Workers - Self-employed in own incorporated business (%)
Class of Workers - Private not-for-profit wage and salary workers (%)
Class of Workers - Local government workers (%)
Class of Workers - State government workers (%)
Class of Workers - Federal government workers (%)
Class of Workers - Self-employed workers in own not incorporated business and Unpaid family workers (%)
House heating fuel used in houses and condos - Utility gas (%)
House heating fuel used in houses and condos - Bottled, tank, or LP gas (%)
House heating fuel used in houses and condos - Electricity (%)
House heating fuel used in houses and condos - Fuel oil, kerosene, etc. (%)
House heating fuel used in houses and condos - Coal or coke (%)
House heating fuel used in houses and condos - Wood (%)
House heating fuel used in houses and condos - Solar energy (%)
House heating fuel used in houses and condos - Other fuel (%)
House heating fuel used in houses and condos - No fuel used (%)
House heating fuel used in apartments - Utility gas (%)
House heating fuel used in apartments - Bottled, tank, or LP gas (%)
House heating fuel used in apartments - Electricity (%)
House heating fuel used in apartments - Fuel oil, kerosene, etc. (%)
House heating fuel used in apartments - Coal or coke (%)
House heating fuel used in apartments - Wood (%)
House heating fuel used in apartments - Solar energy (%)
House heating fuel used in apartments - Other fuel (%)
House heating fuel used in apartments - No fuel used (%)
Armed forces status - In Armed Forces (%)
Armed forces status - Civilian (%)
Armed forces status - Civilian - Veteran (%)
Armed forces status - Civilian - Nonveteran (%)
Fatal accidents locations in years 2005-2021
Fatal accidents locations in 2005
Fatal accidents locations in 2006
Fatal accidents locations in 2007
Fatal accidents locations in 2008
Fatal accidents locations in 2009
Fatal accidents locations in 2010
Fatal accidents locations in 2011
Fatal accidents locations in 2012
Fatal accidents locations in 2013
Fatal accidents locations in 2014
Fatal accidents locations in 2015
Fatal accidents locations in 2016
Fatal accidents locations in 2017
Fatal accidents locations in 2018
Fatal accidents locations in 2019
Fatal accidents locations in 2020
Fatal accidents locations in 2021
Alcohol use - People drinking some alcohol every month (%)
Alcohol use - People not drinking at all (%)
Alcohol use - Average days/month drinking alcohol
Alcohol use - Average drinks/week
Alcohol use - Average days/year people drink much
Audiometry - Average condition of hearing (%)
Audiometry - People that can hear a whisper from across a quiet room (%)
Audiometry - People that can hear normal voice from across a quiet room (%)
Audiometry - Ears ringing, roaring, buzzing (%)
Audiometry - Had a job exposure to loud noise (%)
Audiometry - Had off-work exposure to loud noise (%)
Blood Pressure & Cholesterol - Has high blood pressure (%)
Blood Pressure & Cholesterol - Checking blood pressure at home (%)
Blood Pressure & Cholesterol - Frequently checking blood cholesterol (%)
Blood Pressure & Cholesterol - Has high cholesterol level (%)
Consumer Behavior - Money monthly spent on food at supermarket/grocery store
Consumer Behavior - Money monthly spent on food at other stores
Consumer Behavior - Money monthly spent on eating out
Consumer Behavior - Money monthly spent on carryout/delivered foods
Consumer Behavior - Income spent on food at supermarket/grocery store (%)
Consumer Behavior - Income spent on food at other stores (%)
Consumer Behavior - Income spent on eating out (%)
Consumer Behavior - Income spent on carryout/delivered foods (%)
Current Health Status - General health condition (%)
Current Health Status - Blood donors (%)
Current Health Status - Has blood ever tested for HIV virus (%)
Current Health Status - Left-handed people (%)
Dermatology - People using sunscreen (%)
Diabetes - Diabetics (%)
Diabetes - Had a blood test for high blood sugar (%)
Diabetes - People taking insulin (%)
Diet Behavior & Nutrition - Diet health (%)
Diet Behavior & Nutrition - Milk product consumption (# of products/month)
Diet Behavior & Nutrition - Meals not home prepared (#/week)
Diet Behavior & Nutrition - Meals from fast food or pizza place (#/week)
Diet Behavior & Nutrition - Ready-to-eat foods (#/month)
Diet Behavior & Nutrition - Frozen meals/pizza (#/month)
Drug Use - People that ever used marijuana or hashish (%)
Drug Use - Ever used hard drugs (%)
Drug Use - Ever used any form of cocaine (%)
Drug Use - Ever used heroin (%)
Drug Use - Ever used methamphetamine (%)
Health Insurance - People covered by health insurance (%)
Kidney Conditions-Urology - Avg. # of times urinating at night
Medical Conditions - People with asthma (%)
Medical Conditions - People with anemia (%)
Medical Conditions - People with psoriasis (%)
Medical Conditions - People with overweight (%)
Medical Conditions - Elderly people having difficulties in thinking or remembering (%)
Medical Conditions - People who ever received blood transfusion (%)
Medical Conditions - People having trouble seeing even with glass/contacts (%)
Medical Conditions - People with arthritis (%)
Medical Conditions - People with gout (%)
Medical Conditions - People with congestive heart failure (%)
Medical Conditions - People with coronary heart disease (%)
Medical Conditions - People with angina pectoris (%)
Medical Conditions - People who ever had heart attack (%)
Medical Conditions - People who ever had stroke (%)
Medical Conditions - People with emphysema (%)
Medical Conditions - People with thyroid problem (%)
Medical Conditions - People with chronic bronchitis (%)
Medical Conditions - People with any liver condition (%)
Medical Conditions - People who ever had cancer or malignancy (%)
Mental Health - People who have little interest in doing things (%)
Mental Health - People feeling down, depressed, or hopeless (%)
Mental Health - People who have trouble sleeping or sleeping too much (%)
Mental Health - People feeling tired or having little energy (%)
Mental Health - People with poor appetite or overeating (%)
Mental Health - People feeling bad about themself (%)
Mental Health - People who have trouble concentrating on things (%)
Mental Health - People moving or speaking slowly or too fast (%)
Mental Health - People having thoughts they would be better off dead (%)
Oral Health - Average years since last visit a dentist
Oral Health - People embarrassed because of mouth (%)
Oral Health - People with gum disease (%)
Oral Health - General health of teeth and gums (%)
Oral Health - Average days a week using dental floss/device
Oral Health - Average days a week using mouthwash for dental problem
Oral Health - Average number of teeth
Pesticide Use - Households using pesticides to control insects (%)
Pesticide Use - Households using pesticides to kill weeds (%)
Physical Activity - People doing vigorous-intensity work activities (%)
Physical Activity - People doing moderate-intensity work activities (%)
Physical Activity - People walking or bicycling (%)
Physical Activity - People doing vigorous-intensity recreational activities (%)
Physical Activity - People doing moderate-intensity recreational activities (%)
Physical Activity - Average hours a day doing sedentary activities
Physical Activity - Average hours a day watching TV or videos
Physical Activity - Average hours a day using computer
Physical Functioning - People having limitations keeping them from working (%)
Physical Functioning - People limited in amount of work they can do (%)
Physical Functioning - People that need special equipment to walk (%)
Physical Functioning - People experiencing confusion/memory problems (%)
Physical Functioning - People requiring special healthcare equipment (%)
Prescription Medications - Average number of prescription medicines taking
Preventive Aspirin Use - Adults 40+ taking low-dose aspirin (%)
Reproductive Health - Vaginal deliveries (%)
Reproductive Health - Cesarean deliveries (%)
Reproductive Health - Deliveries resulted in a live birth (%)
Reproductive Health - Pregnancies resulted in a delivery (%)
Reproductive Health - Women breastfeeding newborns (%)
Reproductive Health - Women that had a hysterectomy (%)
Reproductive Health - Women that had both ovaries removed (%)
Reproductive Health - Women that have ever taken birth control pills (%)
Reproductive Health - Women taking birth control pills (%)
Reproductive Health - Women that have ever used Depo-Provera or injectables (%)
Reproductive Health - Women that have ever used female hormones (%)
Sexual Behavior - People 18+ that ever had sex (vaginal, anal, or oral) (%)
Sexual Behavior - Males 18+ that ever had vaginal sex with a woman (%)
Sexual Behavior - Males 18+ that ever performed oral sex on a woman (%)
Sexual Behavior - Males 18+ that ever had anal sex with a woman (%)
Sexual Behavior - Males 18+ that ever had any sex with a man (%)
Sexual Behavior - Females 18+ that ever had vaginal sex with a man (%)
Sexual Behavior - Females 18+ that ever performed oral sex on a man (%)
Sexual Behavior - Females 18+ that ever had anal sex with a man (%)
Sexual Behavior - Females 18+ that ever had any kind of sex with a woman (%)
Sexual Behavior - Average age people first had sex
Sexual Behavior - Average number of female sex partners in lifetime (males 18+)
Sexual Behavior - Average number of female vaginal sex partners in lifetime (males 18+)
Sexual Behavior - Average age people first performed oral sex on a woman (18+)
Sexual Behavior - Average number of woman performed oral sex on in lifetime (18+)
Sexual Behavior - Average number of male sex partners in lifetime (males 18+)
Sexual Behavior - Average number of male anal sex partners in lifetime (males 18+)
Sexual Behavior - Average age people first performed oral sex on a man (18+)
Sexual Behavior - Average number of male oral sex partners in lifetime (18+)
Sexual Behavior - People using protection when performing oral sex (%)
Sexual Behavior - Average number of times people have vaginal or anal sex a year
Sexual Behavior - People having sex without condom (%)
Sexual Behavior - Average number of male sex partners in lifetime (females 18+)
Sexual Behavior - Average number of male vaginal sex partners in lifetime (females 18+)
Sexual Behavior - Average number of female sex partners in lifetime (females 18+)
Sexual Behavior - Circumcised males 18+ (%)
Sleep Disorders - Average hours sleeping at night
Sleep Disorders - People that has trouble sleeping (%)
Smoking-Cigarette Use - People smoking cigarettes (%)
Taste & Smell - People 40+ having problems with smell (%)
Taste & Smell - People 40+ having problems with taste (%)
Taste & Smell - People 40+ that ever had wisdom teeth removed (%)
Taste & Smell - People 40+ that ever had tonsils teeth removed (%)
Taste & Smell - People 40+ that ever had a loss of consciousness because of a head injury (%)
Taste & Smell - People 40+ that ever had a broken nose or other serious injury to face or skull (%)
Taste & Smell - People 40+ that ever had two or more sinus infections (%)
Weight - Average height (inches)
Weight - Average weight (pounds)
Weight - Average BMI
Weight - People that are obese (%)
Weight - People that ever were obese (%)
Weight - People trying to lose weight (%)
Urban population: 18,151
Rural population: 136
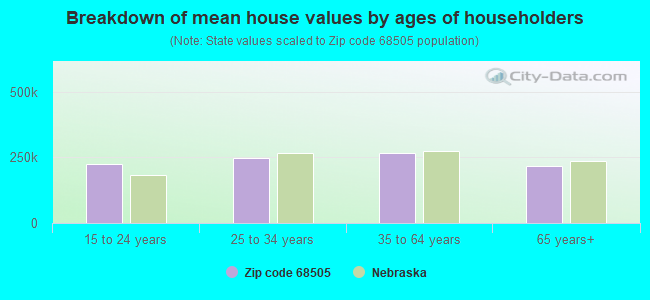
Estimated median house/condo value in 2022: $227,313
68505:
$227,313Nebraska:
$232,400
According to our research of Nebraska and other state lists, there were 40 registered sex offenders living in 68505 zip code as of April 27, 2024 . The ratio of all residents to sex offenders in zip code 68505 is 431 to 1.The ratio of registered sex offenders to all residents in this zip code is near the state average.
Median resident age: This zip code:
31.7 yearsNebraska median age:
37.4 years
Average household size: This zip code:
2.4 peopleNebraska:
2.4 people
Averages for the 2020 tax year for zip code 68505, filed in 2021:
Average Adjusted Gross Income (AGI) in 2020: $56,117 (Individual Income Tax Returns) Here:
$56,117State:
$73,874
Salary/wage: $50,290 (reported on 85.5% of returns )Here:
$50,290State:
$58,268
(% of AGI for various income ranges: 1193.5% for AGIs below $25k , 3658.5% for AGIs $25k-50k , 6375.7% for AGIs $50k-75k , 9538.0% for AGIs $75k-100k , 16714.1% for AGIs $100k-200k , 52792.5% for AGIs over 200k ) Taxable interest for individuals: $1,025 (reported on 30.7% of returns )This zip code:
$1,025Nebraska:
$1,748
(% of AGI for various income ranges: 17.9% for AGIs below $25k , 20.6% for AGIs $25k-50k , 44.6% for AGIs $50k-75k , 62.1% for AGIs $75k-100k , 106.1% for AGIs $100k-200k , 745.0% for AGIs over 200k ) Ordinary dividends: $2,955 (reported on 19.3% of returns )(% of AGI for various income ranges: 18.9% for AGIs below $25k , 34.4% for AGIs $25k-50k , 59.1% for AGIs $50k-75k , 84.6% for AGIs $75k-100k , 167.2% for AGIs $100k-200k , 3682.5% for AGIs over 200k ) Net capital gain/loss in AGI: +$5,545 (reported on 17.5% of returns )Here:
+$5,545State:
+$21,703
(% of AGI for various income ranges: 8.2% for AGIs below $25k , 33.1% for AGIs $25k-50k , 70.3% for AGIs $50k-75k , 114.8% for AGIs $75k-100k , 409.6% for AGIs $100k-200k , 7872.5% for AGIs over 200k ) Profit/loss from business: +$9,745 (reported on 12.5% of returns )Here:
+$9,745State:
+$11,239
(% of AGI for various income ranges: 77.6% for AGIs below $25k , 91.6% for AGIs $25k-50k , 136.9% for AGIs $50k-75k , 263.1% for AGIs $75k-100k , 349.7% for AGIs $100k-200k , 3620.0% for AGIs over 200k ) Taxable individual retirement arrangement distribution: $15,845 (reported on 10.0% of returns )68505:
$15,845Nebraska:
$18,251
(% of AGI for various income ranges: 74.2% for AGIs below $25k , 91.3% for AGIs $25k-50k , 211.8% for AGIs $50k-75k , 349.7% for AGIs $75k-100k , 703.5% for AGIs $100k-200k , 1925.0% for AGIs over 200k ) Total itemized deductions: $25,630 (reported on 4.2% of returns )Here:
$25,630State:
$37,704
(% of AGI for various income ranges: 76.3% for AGIs $25k-50k , 155.8% for AGIs $50k-75k , 248.7% for AGIs $75k-100k , 428.0% for AGIs $100k-200k , 3522.5% for AGIs over 200k ) Charity contributions: $9,321 (reported on 3.2% of returns )(% of AGI for various income ranges: 10.2% for AGIs $25k-50k , 21.7% for AGIs $50k-75k , 65.4% for AGIs $75k-100k , 137.8% for AGIs $100k-200k , 1840.0% for AGIs over 200k ) Taxes paid: $7,397 (reported on 4.2% of returns )(% of AGI for various income ranges: 13.1% for AGIs $25k-50k , 45.4% for AGIs $50k-75k , 87.7% for AGIs $75k-100k , 140.6% for AGIs $100k-200k , 885.0% for AGIs over 200k ) Earned income credit: $2,234 (reported on 11.7% of returns )(% of AGI for various income ranges: 66.4% for AGIs below $25k , 50.0% for AGIs $25k-50k , 1.3% for AGIs $50k-75k ) Percentage of individuals using paid preparers for their 2020 taxes: 95.3%(% for various income ranges: 93.9% for AGIs below $25k , 96.4% for AGIs $25k-50k , 96.0% for AGIs $50k-75k , 95.0% for AGIs $75k-100k , 95.6% for AGIs $100k-200k , 92.3% for AGIs over 200k )
Averages for the 2012 tax year for zip code 68505, filed in 2013:
Average Adjusted Gross Income (AGI) in 2012: $45,203 (Individual Income Tax Returns) Here:
$45,203State:
$60,572
Salary/wage: $41,413 (reported on 85.6% of returns )Here:
$41,413State:
$47,046
(% of AGI for various income ranges: 77.3% for AGIs below $25k , 81.1% for AGIs $25k-50k , 81.4% for AGIs $50k-75k , 81.9% for AGIs $75k-100k , 74.9% for AGIs $100k-200k , 48.8% for AGIs over 200k ) Taxable interest for individuals: $886 (reported on 35.0% of returns )This zip code:
$886Nebraska:
$1,535
(% of AGI for various income ranges: 1.2% for AGIs below $25k , 0.6% for AGIs $25k-50k , 0.5% for AGIs $50k-75k , 0.8% for AGIs $75k-100k , 0.6% for AGIs $100k-200k , 0.3% for AGIs over 200k ) Ordinary dividends: $1,764 (reported on 21.3% of returns )(% of AGI for various income ranges: 1.5% for AGIs below $25k , 0.8% for AGIs $25k-50k , 0.7% for AGIs $50k-75k , 0.6% for AGIs $75k-100k , 0.9% for AGIs $100k-200k , 0.9% for AGIs over 200k ) Net capital gain/loss in AGI: +$4,604 (reported on 15.3% of returns )Here:
+$4,604State:
+$16,171
(% of AGI for various income ranges: 0.2% for AGIs $25k-50k , 0.3% for AGIs $50k-75k , 0.4% for AGIs $75k-100k , 2.4% for AGIs $100k-200k , 22.9% for AGIs over 200k ) Profit/loss from business: +$7,628 (reported on 12.9% of returns )Here:
+$7,628State:
+$9,897
(% of AGI for various income ranges: 4.3% for AGIs below $25k , 2.1% for AGIs $25k-50k , 2.0% for AGIs $50k-75k , 1.6% for AGIs $75k-100k , 2.4% for AGIs $100k-200k ) Taxable individual retirement arrangement distribution: $10,300 (reported on 12.4% of returns )68505:
$10,300Nebraska:
$12,804
(% of AGI for various income ranges: 4.1% for AGIs below $25k , 3.1% for AGIs $25k-50k , 2.2% for AGIs $50k-75k , 2.6% for AGIs $75k-100k , 3.3% for AGIs $100k-200k ) Total itemized deductions: $16,506 (22% of AGI, reported on 29.7% of returns )Here:
$16,506State:
$23,343
Here:
22.2% of AGIState:
18.7% of AGI
(% of AGI for various income ranges: 9.3% for AGIs below $25k , 8.7% for AGIs $25k-50k , 10.0% for AGIs $50k-75k , 11.4% for AGIs $75k-100k , 14.4% for AGIs $100k-200k , 10.1% for AGIs over 200k ) Charity contributions: $2,960 (reported on 24.3% of returns )(% of AGI for various income ranges: 0.8% for AGIs below $25k , 1.0% for AGIs $25k-50k , 1.5% for AGIs $50k-75k , 1.7% for AGIs $75k-100k , 2.5% for AGIs $100k-200k , 2.3% for AGIs over 200k ) Taxes paid: $6,252 (reported on 29.5% of returns )(% of AGI for various income ranges: 1.8% for AGIs below $25k , 2.7% for AGIs $25k-50k , 3.6% for AGIs $50k-75k , 4.6% for AGIs $75k-100k , 6.6% for AGIs $100k-200k , 5.2% for AGIs over 200k ) Earned income credit: $1,946 (reported on 13.6% of returns )(% of AGI for various income ranges: 3.9% for AGIs below $25k , 0.8% for AGIs $25k-50k ) Percentage of individuals using paid preparers for their 2012 taxes: 50.3%(% for various income ranges: 43.8% for AGIs below $25k , 49.3% for AGIs $25k-50k , 55.8% for AGIs $50k-75k , 57.6% for AGIs $75k-100k , 61.0% for AGIs $100k-200k , 80.0% for AGIs over 200k )
Averages for the 2004 tax year for zip code 68505, filed in 2005:
Average Adjusted Gross Income (AGI) in 2004: $37,440 (Individual Income Tax Returns) Here:
$37,440State:
$44,271
Salary/wage: $35,030 (reported on 85.5% of returns )Here:
$35,030State:
$38,230
(% of AGI for various income ranges: 97.6% for AGIs below $10k , 76.3% for AGIs $10k-25k , 81.0% for AGIs $25k-50k , 81.1% for AGIs $50k-75k , 83.1% for AGIs $75k-100k , 71.6% for AGIs over 100k ) Taxable interest for individuals: $1,087 (reported on 50.6% of returns )This zip code:
$1,087Nebraska:
$1,759
(% of AGI for various income ranges: 4.2% for AGIs below $10k , 2.5% for AGIs $10k-25k , 1.4% for AGIs $25k-50k , 1.2% for AGIs $50k-75k , 0.8% for AGIs $75k-100k , 1.6% for AGIs over 100k ) Taxable dividends: $1,216 (reported on 26.6% of returns )(% of AGI for various income ranges: 2.1% for AGIs below $10k , 1.3% for AGIs $10k-25k , 0.8% for AGIs $25k-50k , 0.6% for AGIs $50k-75k , 0.6% for AGIs $75k-100k , 1.2% for AGIs over 100k ) Net capital gain/loss: +$2,682 (reported on 20.5% of returns )Here:
+$2,682State:
+$7,887
(% of AGI for various income ranges: -0.8% for AGIs below $10k , -0.0% for AGIs $10k-25k , 0.3% for AGIs $25k-50k , 1.1% for AGIs $50k-75k , 1.4% for AGIs $75k-100k , 6.8% for AGIs over 100k ) Profit/loss from business: +$5,470 (reported on 13.8% of returns )Here:
+$5,470State:
+$7,743
(% of AGI for various income ranges: 1.0% for AGIs below $10k , 2.5% for AGIs $10k-25k , 1.8% for AGIs $25k-50k , 2.0% for AGIs $50k-75k , 2.3% for AGIs $75k-100k , 1.8% for AGIs over 100k ) Profit/loss from farming: +$395 (reported on 0.5% of returns )
Here : State :
IRA payment deduction: $2,681 (reported on 3.0% of returns )68505:
$2,681Nebraska:
$2,902
(% of AGI for various income ranges: 0.2% for AGIs $10k-25k , 0.3% for AGIs $25k-50k , 0.2% for AGIs $50k-75k , 0.2% for AGIs $75k-100k ) Self-employed pension: $6,778 (reported on 0.3% of returns )Here:
$6,778Nebraska:
$12,366
Total itemized deductions: $14,773 (24% of AGI, reported on 33.2% of returns )Here:
$14,773State:
$18,692
Here:
24.3% of AGIState:
21.1% of AGI
(% of AGI for various income ranges: 13.9% for AGIs below $10k , 9.8% for AGIs $10k-25k , 10.5% for AGIs $25k-50k , 14.0% for AGIs $50k-75k , 16.1% for AGIs $75k-100k , 15.9% for AGIs over 100k ) Charity contributions deductions: $2,559 (4% of AGI, reported on 29.7% of returns )Here:
4.1% of AGIState:
3.8% of AGI
(% of AGI for various income ranges: 0.6% for AGIs below $10k , 1.1% for AGIs $10k-25k , 1.4% for AGIs $25k-50k , 2.1% for AGIs $50k-75k , 2.6% for AGIs $75k-100k , 3.6% for AGIs over 100k ) Total tax: $3,963 (reported on 80.6% of returns )(% of AGI for various income ranges: 2.3% for AGIs below $10k , 4.4% for AGIs $10k-25k , 7.3% for AGIs $25k-50k , 8.4% for AGIs $50k-75k , 9.9% for AGIs $75k-100k , 14.6% for AGIs over 100k ) Earned income credit: $1,365 (reported on 8.8% of returns )Percentage of individuals using paid preparers for their 2004 taxes: 54.1%(% for various income ranges: 44.0% for AGIs below $10k , 52.0% for AGIs $10k-25k , 55.2% for AGIs $25k-50k , 59.8% for AGIs $50k-75k , 60.9% for AGIs $75k-100k , 68.8% for AGIs over 100k )
Estimated median household income in 2022: This zip code:
$69,830Nebraska:
$69,597
Nearest zip codes: 68510 ,
68507 ,
68506 ,
68504 ,
68503 ,
68520 .
Lincoln Zip Code Map
Percentage of family households: This zip code:
45.2%Nebraska:
46.0%
Percentage of households with unmarried partners: This zip code:
7.8%Nebraska:
48.6%
Likely homosexual households (counted as self-reported same-sex unmarried-partner households)
Lesbian couples: 0.0% of all households Gay men: 0.2% of all households
Household received Food Stamps/SNAP in the past 12 months: 526Household did not receive Food Stamps/SNAP in the past 12 months: 7,146
Women who had a birth in the past 12 months: 279 (271 now married , 23 unmarried) Women who did not have a birth in the past 12 months: 4,262 (1,744 now married , 2,519 unmarried)
Housing units in zip code 68505 with a mortgage: 2,920 (278
second mortgage , 15
home equity loan , 177
both second mortgage and home equity loan )
Houses without a mortgage: 77
Median monthly owner costs for units with a mortgage: $1,439
Median monthly owner costs for units without a mortgage: $573
Residents with income below the poverty level in 2022:
This zip code:
9.6%Whole state:
11.2%
Residents with income below 50% of the poverty level in 2022:
This zip code:
4.7%Whole state:
6.1%
Median number of rooms in houses and condos: Median number of rooms in apartments: Notable locations in this zip code not listed on our city pages
Click to draw/clear zip code borders Notable locations in zip code 68505: (A) , East Park Plaza (B) , Dialysis Center of Lincoln (C) , Green Chiropractic Center (D) , Lincoln Chiropractic Center (E) , Bethany Branch Library (F) , Lincoln Fire and Rescue Station 9 (G) , Southeast Rural Fire District North Station (H) . Display/hide their locations on the map
Shopping Center: (1) . Display/hide its location on the map
Churches in zip code 68505 include: (A) , Calvary Baptist Church (B) , Northside Seventh Day Adventist Church (C) , Eastside Church of Christ (D) , Saint Marks United Methodist Church (E) , Greek Orthodox Church of the Annunciation (F) , The Church of Jesus Christ of Latter Day Saints (G) , First Assembly of God Church (H) , Lincoln Church of Christ (I) . Display/hide their locations on the map
Parks in zip code 68505 include: (1) , Herbert Park (2) . Display/hide their locations on the map
Tourist attractions (not listed on the city page) :
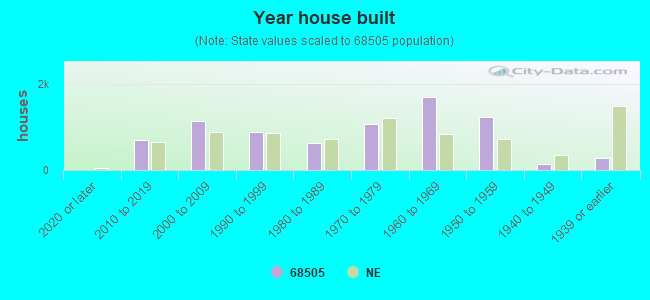
Year house built (houses)
5 2020 or later699 2010 to 20191,135 2000 to 2009895 1990 to 1999627 1980 to 19891,065 1970 to 19791,699 1960 to 19691,230 1950 to 1959142 1940 to 1949286 1939 or earlier
Zip code 68505 household income distribution in 2022 431 Less than $10,000128 $10,000 to $14,999174 $15,000 to $19,999294 $20,000 to $24,999224 $25,000 to $29,999331 $30,000 to $34,999317 $35,000 to $39,999245 $40,000 to $44,999333 $45,000 to $49,999497 $50,000 to $59,9991,094 $60,000 to $74,9991,311 $75,000 to $99,999990 $100,000 to $124,999588 $125,000 to $149,999356 $150,000 to $199,999340 $200,000 or moreEstimate of home value of owner-occupied houses/condos in 2022 in zip code 68505 32 Less than $10,00022 $15,000 to $19,99910 $20,000 to $24,9996 $50,000 to $59,99935 $60,000 to $69,99921 $70,000 to $79,99956 $80,000 to $89,99935 $90,000 to $99,999223 $100,000 to $124,999230 $125,000 to $149,999526 $150,000 to $174,999608 $175,000 to $199,999950 $200,000 to $249,999428 $250,000 to $299,999795 $300,000 to $399,999230 $400,000 to $499,999103 $500,000 to $749,99916 $2,000,000 or moreRent paid by renters in 2022 in zip code 68505 5 $100 to $14915 $350 to $39921 $450 to $49940 $500 to $54975 $550 to $599142 $600 to $64964 $700 to $749393 $750 to $799529 $800 to $899612 $900 to $999892 $1,000 to $1,249302 $1,250 to $1,499233 $1,500 to $1,9997 No cash rent
Median gross rent in 2022: $1,079.
Median price asked for vacant for-sale houses and condos in 2022: $191,458.
Estimated median house (or condo) value in 2022 for: White Non-Hispanic householders: $227,313Black or African American householders: $269,470Asian householders: $248,152Some other race householders: $176,293Two or more races householders: $209,109Hispanic or Latino householders: $206,953Estimated median house or condo value in 2022: $227,313
68505:
$227,313Nebraska:
$232,400
Lower value quartile - upper value quartile: $182,106 - $311,401
Mean price in 2022: Detached houses: $295,827Here:
$295,827State:
$274,677
Townhouses or other attached units: $310,948Here:
$310,948State:
$245,619
In 2-unit structures: $131,397Here:
$131,397State:
$168,724
In 3-to-4-unit structures: $546,823Here:
$546,823State:
$405,971
In 5-or-more-unit structures: $330,569Here:
$330,569State:
$476,911
Mobile homes: $62,067Here:
$62,067State:
$67,339
Housing units in structures:
One, detached: 5,117One, attached: 393Two: 413 or 4: 1115 to 9: 44010 to 19: 72620 to 49: 76850 or more: 409Mobile homes: 11Unemployment : 2.1%
Means of transportation to work in zip code 68505 78.0% 8,117 Drove a car alone9.5% 985 Carpooled0.6% 59 Bus or trolley bus0.2% 25 Bicycle2.1% 220 Walked0.7% 73 Other means8.3% 866 Worked at homeTravel time to work (commute) in zip code 68505 150 Less than 5 minutes1,161 5 to 9 minutes2,155 10 to 14 minutes2,105 15 to 19 minutes1,746 20 to 24 minutes675 25 to 29 minutes690 30 to 34 minutes92 35 to 39 minutes106 40 to 44 minutes309 45 to 59 minutes241 60 to 89 minutes53 90 or more minutes
Neighborhoods in zip code 68505: Percentage of zip code residents living and working in this county: 96.0%
Household type by relationship:
Households: 18,288
Male householders: 3,794 (952 living alone ), Female householders: 3,887 (1,164 living alone )3,263 spouses (3,248 opposite-sex spouses ), 759 unmarried partners , (747 opposite-sex unmarried partners ), 4,802 children (4,425 natural , 88 adopted , 296 stepchildren ), 335 grandchildren , 169 brothers or sisters , 268 parents , 50 foster children , 78 other relatives , 801 non-relatives In group quarters: 22 (-1 institutionalized population )
Size of family households: 1,981 2-persons , 1,125 3-persons , 746 4-persons , 307 5-persons , 223 6-persons , 144 7-or-more-persons
Size of nonfamily households: 2,119 1-person , 924 2-persons , 112 3-persons , 5 5-persons
2,885 married couples with children. single-parent households (172 men , 952 women ).
90.1% of residents of 68505 zip code speak English at home. of residents speak Spanish at home (63% very well, 21% well, 4% not well, 12% not at all ).of residents speak other Indo-European language at home (97% very well, 3% well ).of residents speak Asian or Pacific Island language at home (51% very well, 37% well, 10% not well, 2% not at all ).of residents speak other language at home (90% very well, 3% well, 7% not well ).
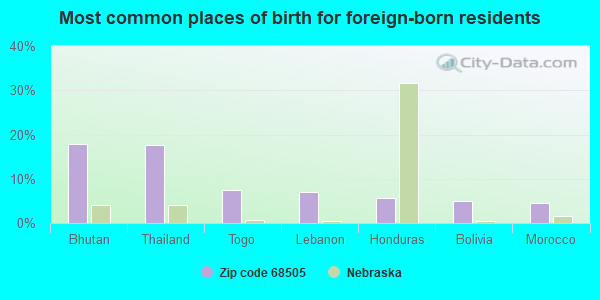
Foreign born population: 1,073 (5.9%)
(39.9%
of them are naturalized citizens )
This zip code:
5.9%Whole state:
7.2%
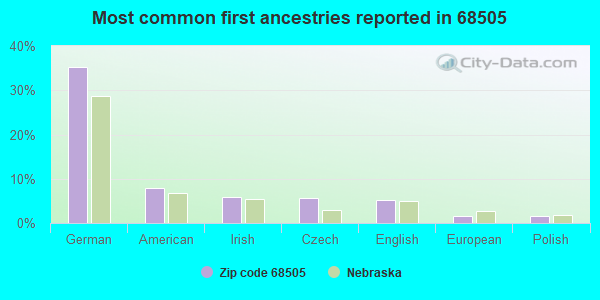
18% Bhutan 18% Thailand 7% Togo 7% Lebanon 6% Honduras 5% Bolivia 4% Morocco 35% German 8% American 6% Irish 6% Czech 5% English 2% European 2% Polish
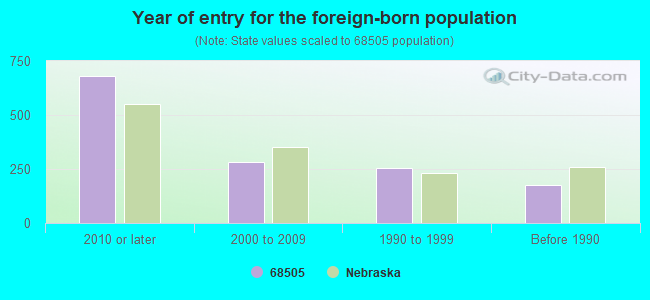
Year of entry for the foreign-born population
680 2010 or later 283 2000 to 2009 255 1990 to 1999 176 Before 1990
There are
154 Medical Specialists in Zip Code 68505 .
Facilities with environmental interests located in this zip code:
GATEWAY SHOPPING CTR (6100 O ST in LINCOLN, NE)
AIR MINOR (AIRS/AFS) STATE MASTER (Nebraska tracking) - AIR PROGRAM, LEAKING STORAGE TANK Business SIC classification: DEPARTMENT STORES
MID AM ENVIR CONSULT/ENG (4000 SOUTH 56TH ST #380B in LINCOLN, NE)
STATE MASTER (Nebraska tracking) - HAZARDOUS WASTE PROGRAM (Resource Conservation and Recovery Act (tracking hazardous waste)) Organizations: WADDELL MCGEE (CONTACT/OWNER)
MEGINNIS FORD CO (6400 Q ST in LINCOLN, NE)
STATE MASTER (Nebraska tracking) - -111297-99-0000, LEAKING STORAGE TANK, -AP2823, -NED051258531, HAZARDOUS WASTE PROGRAM Small Quantity Generators, between 100 kg and 1000 kg of hazardous waste/month (Resource Conservation and Recovery Act (tracking hazardous waste)) - notification Alternative names: MEGINNIS FORD JEEP SAAB ISUZU
BROWNELL ELEMENTARY SCHOOL ( in LINCOLN, NE)
(National Center for Education Statistics) - STATE ID-550001011 Organizations: LINCOLN PUBLIC SCHOOLS (SCHOOL DISTRICT)
MEADOW LANE ELEMENTARY SCHOOL ( in LINCOLN, NE)
(National Center for Education Statistics) - STATE ID-550001031 Organizations: LINCOLN PUBLIC SCHOOLS (SCHOOL DISTRICT)
ADVANCED PEST MGMT INC (1543 N COTNER BLVD in LINCOLN, NE)
COMPLIANCE ACTIVITY (Tracking inspections of insecticide, fungicide, and rodenticide, and toxic substances)
BAKERS TRUE VALUE HARDWARE (220 GATEWAY N in LINCOLN, NE)
COMPLIANCE ACTIVITY (Tracking inspections of insecticide, fungicide, and rodenticide, and toxic substances)
CRONK, MARY (1741 N 63 in LINCOLN, NE)
COMPLIANCE ACTIVITY (Tracking inspections of insecticide, fungicide, and rodenticide, and toxic substances)
FISCHBACH, JOHN (ARBOCARE TREE LAWN SVC) (520 ELDORA LN in LINCOLN, NE)
COMPLIANCE ACTIVITY (Tracking inspections of insecticide, fungicide, and rodenticide, and toxic substances)
FIX, SIDNEY (517 JEFFERY DR in LINCOLN, NE)
COMPLIANCE ACTIVITY (Tracking inspections of insecticide, fungicide, and rodenticide, and toxic substances)
Housing units lacking complete plumbing facilities: 0.3%
Housing units lacking complete kitchen facilities: 0.6%
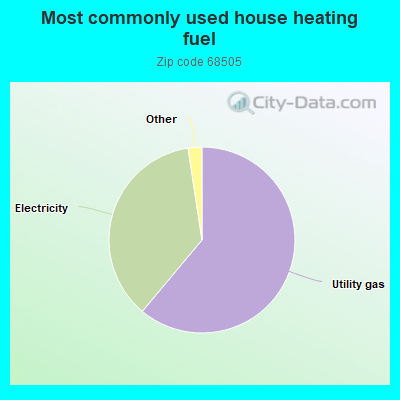
61.1% Utility gas 36.5% Electricity 0.8% Fuel oil, kerosene, etc. 0.7% Bottled, tank, or LP gas
Population in 1990: 13,461. Population change in the 1990s: +119 (+0.9%).
Place of birth for U.S.-born residents:
This state: 12,455Northeast: 256Midwest: 2,331South: 517West: 1,318
57% of the 68505 zip code residents lived in the same house 5 years ago.
Out of people who lived in different houses, 62% lived in this county.
Out of people who lived in different counties, 50% lived in Nebraska.
91% of the 68505 zip code residents lived in the same house 1 year ago.
Out of people who lived in different houses, 73% moved from this county.
Out of people who lived in different houses, 8% moved from different county within same state.
Out of people who lived in different houses, 12% moved from different state.
Out of people who lived in different houses, 7% moved from abroad.
Private vs. public school enrollment:
Students in private schools in grades 1 to 8 (elementary and middle school): 376
Students in private schools in grades 9 to 12 (high school): 129
Students in private undergraduate colleges: 90
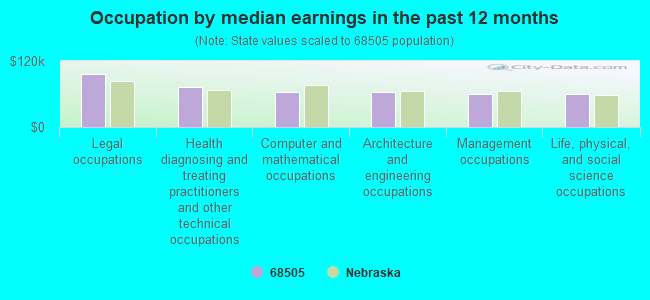
Occupation by median earnings in the past 12 months ($)
96,787 Legal occupations 72,448 Health diagnosing and treating practitioners and other technical occupations 64,518 Computer and mathematical occupations 64,055 Architecture and engineering occupations 60,163 Management occupations 59,220 Life, physical, and social science occupations
Companies with federal contracts located in this zip code:
JUDDS BROS CONSTRUCTION CO (3835 NO 68TH STREET in LINCOLN, NE; small business) in 2 contracts from 2000 to 2001
$482,500 with Air Force for Maintenance, Repair or Alteration of Real Property -- Miscellaneous Buildings. Taking place in MO. Signed on 2000-08-02. Completion date: 2001-02-12.
, same as above. Signed on 2001-05-18. Completion date: 2001-08-17.
Top industries in this zip code by the number of employees in 2005:
Accommodation and Food Services: Full-Service Restaurants (100-249 employees: 2 establishments, 50-99 employees: 1 establishment, 20-49 employees: 2 establishments, 10-19 employees: 2 establishments, 1-4 employees: 4 establishments)Administrative and Support and Waste Management and Remediation Services: Temporary Help Services (100-249: 2, 20-49: 1, 5-9: 1, 1-4: 4)Accommodation and Food Services: Limited-Service Restaurants (20-49: 5, 10-19: 1, 5-9: 4, 1-4: 6)Finance and Insurance: Direct Property and Casualty Insurance Carriers (100-249: 1, 1-4: 3)Health Care and Social Assistance: Vocational Rehabilitation Services (100-249: 1)Health Care and Social Assistance: Offices of Physicians (except Mental Health Specialists) (20-49: 3, 10-19: 2, 5-9: 3, 1-4: 1)
People in group quarters in 2010:
7 people in residential treatment centers for adults
2 people in other noninstitutional facilities
People in group quarters in 2000:
22 people in other group homes
7 people in homes or halfway houses for drug/alcohol abuse
3 people in religious group quarters
Fatal accident statistics in 2013:
Fatal accident count: 1Vehicles involved in fatal accidents: 1Fatal accidents caused by drunken drivers: 0Fatalities: 1Persons involved in fatal accidents: 1Pedestrians involved in fatal accidents: 1
Fatal accident statistics in 2011:
Fatal accident count: 2Vehicles involved in fatal accidents: 2Fatal accidents caused by drunken drivers: 0Fatalities: 2Persons involved in fatal accidents: 3Pedestrians involved in fatal accidents: 0
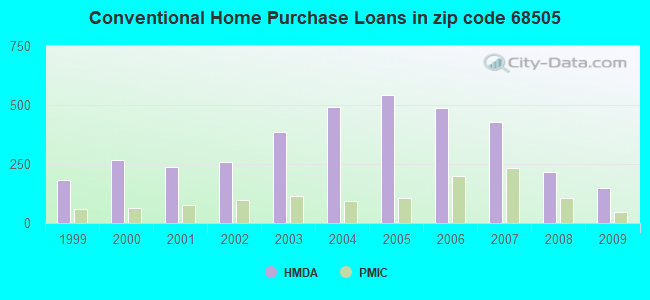
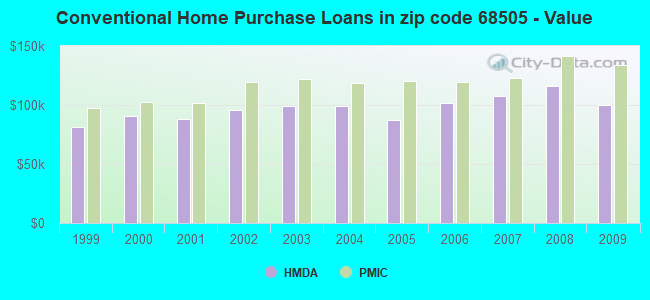
Home Mortgage Disclosure Act Aggregated Statistics For Year 2009(Based on 2 full and 6 partial tracts) A) FHA, FSA/RHS & VA B) Conventional C) Refinancings D) Home Improvement Loans E) Loans on Dwellings For 5+ Families F) Non-occupant Loans on G) Loans On Manufactured Number Average Value Number Average Value Number Average Value Number Average Value Number Average Value Number Average Value Number Average Value
LOANS ORIGINATED 253 $119,241 149 $99,659 742 $113,660 59 $15,512 1 $20,400,000 62 $61,629 1 $194,650 APPLICATIONS APPROVED, NOT ACCEPTED 10 $137,834 6 $101,995 50 $119,788 10 $24,619 1 $21,420,000 0 $0 0 $0 APPLICATIONS DENIED 25 $123,302 12 $81,365 147 $113,371 46 $22,252 0 $0 8 $47,951 2 $156,985 APPLICATIONS WITHDRAWN 13 $110,691 15 $89,817 125 $121,495 12 $37,434 0 $0 11 $90,772 0 $0 FILES CLOSED FOR INCOMPLETENESS 1 $66,350 0 $0 33 $129,251 1 $17,070 0 $0 0 $0 0 $0
Aggregated Statistics For Year 2008(Based on 2 full and 6 partial tracts) A) FHA, FSA/RHS & VA B) Conventional C) Refinancings D) Home Improvement Loans E) Loans on Dwellings For 5+ Families F) Non-occupant Loans on G) Loans On Manufactured Number Average Value Number Average Value Number Average Value Number Average Value Number Average Value Number Average Value Number Average Value
LOANS ORIGINATED 121 $121,316 214 $116,273 396 $102,360 70 $24,663 2 $204,510 75 $86,454 6 $92,843 APPLICATIONS APPROVED, NOT ACCEPTED 1 $99,960 21 $108,875 44 $104,785 8 $29,599 0 $0 2 $140,700 0 $0 APPLICATIONS DENIED 4 $129,982 14 $138,400 179 $102,944 35 $19,412 0 $0 4 $63,580 1 $89,690 APPLICATIONS WITHDRAWN 5 $104,154 9 $121,299 94 $129,920 11 $78,115 0 $0 3 $83,417 0 $0 FILES CLOSED FOR INCOMPLETENESS 0 $0 1 $177,340 17 $149,708 4 $96,485 0 $0 1 $10,200 0 $0
Aggregated Statistics For Year 2007(Based on 2 full and 6 partial tracts) A) FHA, FSA/RHS & VA B) Conventional C) Refinancings D) Home Improvement Loans E) Loans on Dwellings For 5+ Families F) Non-occupant Loans on G) Loans On Manufactured Number Average Value Number Average Value Number Average Value Number Average Value Number Average Value Number Average Value Number Average Value
LOANS ORIGINATED 44 $127,879 429 $108,016 380 $88,787 126 $25,820 1 $205,020 78 $72,130 1 $10,950 APPLICATIONS APPROVED, NOT ACCEPTED 1 $180,990 16 $88,657 98 $92,798 22 $32,979 0 $0 10 $81,460 1 $37,150 APPLICATIONS DENIED 2 $93,990 21 $93,490 278 $108,388 56 $27,447 0 $0 12 $106,842 2 $93,990 APPLICATIONS WITHDRAWN 7 $104,946 19 $100,685 133 $98,631 8 $50,745 0 $0 4 $62,162 0 $0 FILES CLOSED FOR INCOMPLETENESS 0 $0 7 $145,599 21 $91,615 1 $32,640 0 $0 0 $0 0 $0
Aggregated Statistics For Year 2006(Based on 2 full and 6 partial tracts) A) FHA, FSA/RHS & VA B) Conventional C) Refinancings D) Home Improvement Loans E) Loans on Dwellings For 5+ Families F) Non-occupant Loans on G) Loans On Manufactured Number Average Value Number Average Value Number Average Value Number Average Value Number Average Value Number Average Value Number Average Value
LOANS ORIGINATED 43 $130,613 487 $101,350 451 $83,854 85 $24,783 2 $895,815 90 $90,591 0 $0 APPLICATIONS APPROVED, NOT ACCEPTED 1 $124,680 18 $96,087 80 $90,998 24 $16,413 0 $0 4 $75,530 0 $0 APPLICATIONS DENIED 2 $130,985 39 $95,005 258 $95,125 69 $31,531 0 $0 8 $80,186 2 $118,550 APPLICATIONS WITHDRAWN 0 $0 40 $109,069 158 $98,415 12 $52,957 0 $0 2 $117,780 0 $0 FILES CLOSED FOR INCOMPLETENESS 1 $82,640 6 $96,703 34 $108,942 0 $0 0 $0 4 $130,077 0 $0
Aggregated Statistics For Year 2005(Based on 2 full and 6 partial tracts) A) FHA, FSA/RHS & VA B) Conventional C) Refinancings D) Home Improvement Loans E) Loans on Dwellings For 5+ Families F) Non-occupant Loans on G) Loans On Manufactured Number Average Value Number Average Value Number Average Value Number Average Value Number Average Value Number Average Value Number Average Value
LOANS ORIGINATED 119 $117,007 541 $86,982 601 $86,002 78 $21,997 3 $3,866,327 135 $82,960 1 $5,100 APPLICATIONS APPROVED, NOT ACCEPTED 3 $112,543 28 $82,051 109 $90,405 11 $61,656 0 $0 1 $84,760 0 $0 APPLICATIONS DENIED 4 $103,862 45 $97,168 242 $89,302 77 $25,539 0 $0 16 $106,524 3 $100,387 APPLICATIONS WITHDRAWN 1 $117,390 48 $87,895 207 $95,507 19 $96,638 0 $0 10 $88,502 0 $0 FILES CLOSED FOR INCOMPLETENESS 0 $0 7 $59,143 76 $105,905 3 $86,093 0 $0 4 $106,792 2 $94,990
Aggregated Statistics For Year 2004(Based on 2 full and 6 partial tracts) A) FHA, FSA/RHS & VA B) Conventional C) Refinancings D) Home Improvement Loans E) Loans on Dwellings For 5+ Families F) Non-occupant Loans on G) Loans On Manufactured Number Average Value Number Average Value Number Average Value Number Average Value Number Average Value Number Average Value Number Average Value
LOANS ORIGINATED 89 $107,938 490 $99,488 723 $89,427 98 $30,389 3 $627,917 145 $89,505 0 $0 APPLICATIONS APPROVED, NOT ACCEPTED 6 $91,512 36 $80,001 94 $92,689 9 $27,220 0 $0 1 $40,840 0 $0 APPLICATIONS DENIED 2 $105,440 55 $84,407 344 $97,017 63 $33,810 0 $0 24 $85,963 2 $72,995 APPLICATIONS WITHDRAWN 6 $117,002 37 $87,733 190 $101,547 11 $30,764 0 $0 7 $79,069 0 $0 FILES CLOSED FOR INCOMPLETENESS 0 $0 9 $83,581 89 $98,385 7 $82,541 1 $423,300 1 $193,110 0 $0
Aggregated Statistics For Year 2003(Based on 2 full and 6 partial tracts) A) FHA, FSA/RHS & VA B) Conventional C) Refinancings D) Home Improvement Loans E) Loans on Dwellings For 5+ Families F) Non-occupant Loans on Number Average Value Number Average Value Number Average Value Number Average Value Number Average Value Number Average Value
LOANS ORIGINATED 126 $110,523 387 $98,919 1,587 $91,096 111 $16,445 2 $224,590 140 $89,982 APPLICATIONS APPROVED, NOT ACCEPTED 3 $88,500 29 $118,607 106 $98,079 19 $13,119 0 $0 10 $110,082 APPLICATIONS DENIED 3 $91,013 37 $86,731 336 $91,510 43 $19,257 0 $0 14 $58,831 APPLICATIONS WITHDRAWN 2 $124,285 19 $92,296 236 $87,852 8 $21,179 0 $0 15 $70,349 FILES CLOSED FOR INCOMPLETENESS 2 $72,930 4 $94,250 29 $96,356 2 $23,820 0 $0 2 $89,990
Aggregated Statistics For Year 2002(Based on 2 full and 4 partial tracts) A) FHA, FSA/RHS & VA B) Conventional C) Refinancings D) Home Improvement Loans E) Loans on Dwellings For 5+ Families F) Non-occupant Loans on Number Average Value Number Average Value Number Average Value Number Average Value Number Average Value Number Average Value
LOANS ORIGINATED 158 $99,132 259 $95,623 1,027 $87,058 100 $12,654 1 $222,660 93 $69,235 APPLICATIONS APPROVED, NOT ACCEPTED 0 $0 10 $134,059 92 $82,759 19 $20,395 0 $0 1 $58,740 APPLICATIONS DENIED 3 $111,340 34 $76,247 220 $78,880 47 $14,970 0 $0 10 $45,653 APPLICATIONS WITHDRAWN 6 $112,087 16 $114,704 227 $92,904 15 $33,739 0 $0 6 $69,932 FILES CLOSED FOR INCOMPLETENESS 1 $68,340 5 $76,716 53 $85,288 1 $15,300 0 $0 2 $112,990
Aggregated Statistics For Year 2001(Based on 2 full and 4 partial tracts) A) FHA, FSA/RHS & VA B) Conventional C) Refinancings D) Home Improvement Loans F) Non-occupant Loans on Number Average Value Number Average Value Number Average Value Number Average Value Number Average Value
LOANS ORIGINATED 134 $92,217 236 $88,070 821 $82,744 122 $10,611 85 $78,507 APPLICATIONS APPROVED, NOT ACCEPTED 0 $0 13 $99,606 98 $66,737 17 $23,505 4 $39,995 APPLICATIONS DENIED 5 $89,370 29 $77,599 243 $71,780 39 $16,051 4 $48,995 APPLICATIONS WITHDRAWN 2 $92,990 5 $79,372 146 $75,648 17 $16,666 2 $85,680 FILES CLOSED FOR INCOMPLETENESS 0 $0 4 $34,828 47 $83,827 0 $0 0 $0
Aggregated Statistics For Year 2000(Based on 2 full and 4 partial tracts) A) FHA, FSA/RHS & VA B) Conventional C) Refinancings D) Home Improvement Loans E) Loans on Dwellings For 5+ Families F) Non-occupant Loans on Number Average Value Number Average Value Number Average Value Number Average Value Number Average Value Number Average Value
LOANS ORIGINATED 140 $89,487 266 $90,311 264 $63,863 114 $13,086 1 $123,420 64 $72,137 APPLICATIONS APPROVED, NOT ACCEPTED 1 $95,880 6 $97,567 36 $71,971 18 $9,742 0 $0 0 $0 APPLICATIONS DENIED 4 $102,630 24 $47,855 170 $62,350 43 $19,167 0 $0 3 $20,750 APPLICATIONS WITHDRAWN 2 $101,270 16 $93,610 54 $68,279 9 $28,601 0 $0 1 $73,760 FILES CLOSED FOR INCOMPLETENESS 2 $42,995 6 $78,642 35 $70,896 0 $0 0 $0 3 $69,993
Aggregated Statistics For Year 1999(Based on 1 full and 3 partial tracts) A) FHA, FSA/RHS & VA B) Conventional C) Refinancings D) Home Improvement Loans E) Loans on Dwellings For 5+ Families F) Non-occupant Loans on Number Average Value Number Average Value Number Average Value Number Average Value Number Average Value Number Average Value
LOANS ORIGINATED 78 $84,638 181 $81,471 225 $61,385 69 $12,478 4 $1,010,512 46 $63,546 APPLICATIONS APPROVED, NOT ACCEPTED 0 $0 4 $65,662 19 $55,346 12 $11,044 0 $0 0 $0 APPLICATIONS DENIED 0 $0 22 $50,615 62 $63,340 15 $11,435 0 $0 2 $37,020 APPLICATIONS WITHDRAWN 4 $106,630 10 $74,469 31 $60,442 7 $32,659 1 $1,012,000 6 $48,568 FILES CLOSED FOR INCOMPLETENESS 0 $0 0 $0 12 $70,129 0 $0 0 $0 0 $0
Detailed HMDA statistics for the following Tracts:
0010.00
,
0011.00 ,
0012.00 ,
0037.12
Private Mortgage Insurance Companies Aggregated Statistics For Year 2009(Based on 2 full and 6 partial tracts) A) Conventional B) Refinancings C) Non-occupant Loans on Number Average Value Number Average Value Number Average Value
LOANS ORIGINATED 45 $133,869 63 $148,706 1 $83,330 APPLICATIONS APPROVED, NOT ACCEPTED 3 $95,930 11 $153,065 0 $0 APPLICATIONS DENIED 3 $183,253 7 $107,559 0 $0 APPLICATIONS WITHDRAWN 0 $0 4 $130,230 0 $0 FILES CLOSED FOR INCOMPLETENESS 1 $155,720 0 $0 0 $0
Aggregated Statistics For Year 2008(Based on 2 full and 6 partial tracts) A) Conventional B) Refinancings C) Non-occupant Loans on Number Average Value Number Average Value Number Average Value
LOANS ORIGINATED 107 $141,198 43 $137,599 1 $113,220 APPLICATIONS APPROVED, NOT ACCEPTED 33 $147,510 16 $148,689 0 $0 APPLICATIONS DENIED 3 $138,910 1 $179,700 0 $0 APPLICATIONS WITHDRAWN 5 $137,788 0 $0 1 $82,620 FILES CLOSED FOR INCOMPLETENESS 1 $259,540 2 $106,080 2 $106,080
Aggregated Statistics For Year 2007(Based on 2 full and 6 partial tracts) A) Conventional B) Refinancings C) Non-occupant Loans on Number Average Value Number Average Value Number Average Value
LOANS ORIGINATED 232 $122,774 58 $135,124 7 $94,807 APPLICATIONS APPROVED, NOT ACCEPTED 24 $119,909 9 $146,402 0 $0 APPLICATIONS DENIED 0 $0 0 $0 0 $0 APPLICATIONS WITHDRAWN 3 $209,650 3 $172,373 0 $0 FILES CLOSED FOR INCOMPLETENESS 0 $0 0 $0 0 $0
Aggregated Statistics For Year 2006(Based on 2 full and 6 partial tracts) A) Conventional B) Refinancings C) Non-occupant Loans on Number Average Value Number Average Value Number Average Value
LOANS ORIGINATED 199 $119,701 40 $121,270 6 $142,888 APPLICATIONS APPROVED, NOT ACCEPTED 8 $107,024 16 $111,498 0 $0 APPLICATIONS DENIED 0 $0 1 $116,870 1 $116,870 APPLICATIONS WITHDRAWN 6 $94,045 1 $218,740 0 $0 FILES CLOSED FOR INCOMPLETENESS 0 $0 0 $0 0 $0
Aggregated Statistics For Year 2005(Based on 2 full and 6 partial tracts) A) Conventional B) Refinancings C) Non-occupant Loans on Number Average Value Number Average Value Number Average Value
LOANS ORIGINATED 104 $120,028 64 $114,827 8 $91,672 APPLICATIONS APPROVED, NOT ACCEPTED 12 $120,388 12 $135,020 0 $0 APPLICATIONS DENIED 1 $129,820 0 $0 0 $0 APPLICATIONS WITHDRAWN 5 $108,456 2 $122,175 0 $0 FILES CLOSED FOR INCOMPLETENESS 6 $134,987 0 $0 0 $0
Aggregated Statistics For Year 2004(Based on 2 full and 6 partial tracts) A) Conventional B) Refinancings C) Non-occupant Loans on D) Loans On Manufactured Number Average Value Number Average Value Number Average Value Number Average Value
LOANS ORIGINATED 93 $118,632 81 $114,841 12 $90,742 2 $91,990 APPLICATIONS APPROVED, NOT ACCEPTED 15 $124,687 20 $126,969 2 $200,980 0 $0 APPLICATIONS DENIED 1 $117,300 0 $0 0 $0 0 $0 APPLICATIONS WITHDRAWN 5 $128,224 3 $177,937 1 $104,500 0 $0 FILES CLOSED FOR INCOMPLETENESS 0 $0 0 $0 0 $0 0 $0
Aggregated Statistics For Year 2003(Based on 2 full and 6 partial tracts) A) Conventional B) Refinancings C) Non-occupant Loans on Number Average Value Number Average Value Number Average Value
LOANS ORIGINATED 114 $122,039 241 $112,543 17 $104,855 APPLICATIONS APPROVED, NOT ACCEPTED 6 $77,997 26 $104,069 4 $52,495 APPLICATIONS DENIED 0 $0 2 $102,570 0 $0 APPLICATIONS WITHDRAWN 1 $88,790 11 $111,873 1 $49,180 FILES CLOSED FOR INCOMPLETENESS 0 $0 4 $107,528 0 $0
Aggregated Statistics For Year 2002(Based on 2 full and 4 partial tracts) A) Conventional B) Refinancings C) Non-occupant Loans on Number Average Value Number Average Value Number Average Value
LOANS ORIGINATED 96 $119,319 174 $109,945 11 $124,118 APPLICATIONS APPROVED, NOT ACCEPTED 9 $106,517 27 $105,057 2 $81,990 APPLICATIONS DENIED 0 $0 0 $0 0 $0 APPLICATIONS WITHDRAWN 2 $94,990 4 $73,822 0 $0 FILES CLOSED FOR INCOMPLETENESS 0 $0 0 $0 0 $0
Aggregated Statistics For Year 2001(Based on 2 full and 4 partial tracts) A) Conventional B) Refinancings C) Non-occupant Loans on Number Average Value Number Average Value Number Average Value
LOANS ORIGINATED 75 $102,097 133 $109,687 17 $76,463 APPLICATIONS APPROVED, NOT ACCEPTED 5 $99,570 11 $104,963 1 $45,900 APPLICATIONS DENIED 2 $98,990 3 $123,267 2 $98,990 APPLICATIONS WITHDRAWN 1 $43,710 3 $128,353 0 $0 FILES CLOSED FOR INCOMPLETENESS 0 $0 0 $0 0 $0
Aggregated Statistics For Year 2000(Based on 2 full and 4 partial tracts) A) Conventional B) Refinancings C) Non-occupant Loans on Number Average Value Number Average Value Number Average Value
LOANS ORIGINATED 65 $102,416 31 $98,330 3 $81,397 APPLICATIONS APPROVED, NOT ACCEPTED 1 $64,880 4 $69,268 0 $0 APPLICATIONS DENIED 0 $0 0 $0 0 $0 APPLICATIONS WITHDRAWN 1 $60,790 0 $0 0 $0 FILES CLOSED FOR INCOMPLETENESS 0 $0 0 $0 0 $0
Aggregated Statistics For Year 1999(Based on 1 full and 3 partial tracts) A) Conventional B) Refinancings C) Non-occupant Loans on Number Average Value Number Average Value Number Average Value
LOANS ORIGINATED 60 $97,347 22 $90,344 2 $60,240 APPLICATIONS APPROVED, NOT ACCEPTED 3 $103,190 0 $0 0 $0 APPLICATIONS DENIED 1 $67,000 0 $0 0 $0 APPLICATIONS WITHDRAWN 0 $0 0 $0 0 $0 FILES CLOSED FOR INCOMPLETENESS 0 $0 1 $91,000 0 $0
Detailed PMIC statistics for the following Tracts:
0010.00
,
0011.00 ,
0012.00 ,
0037.12
Most common first names in zip code 68505 among deceased individuals Name Count Lived (average)
John 60 75.3 years Robert 56 70.1 years William 47 75.0 years Helen 41 83.4 years James 38 67.4 years Ruth 30 82.6 years Mary 30 81.6 years Harold 28 76.2 years Charles 27 74.9 years Marie 26 80.1 years
Most common last names in zip code 68505 among deceased individuals Last name Count Lived (average)
Miller 25 77.6 years Johnson 24 77.7 years Smith 21 81.5 years Anderson 16 79.6 years Peterson 15 76.4 years Brown 12 75.1 years Williams 12 82.7 years Cook 10 82.0 years Nelson 10 81.3 years Jensen 10 80.0 years
Businesses in zip code 68505
Name Count Name Count
ALDO 1 KFC 1 AT&T 1 Kohl's 1 Ace Hardware 1 Kroger 2 Aeropostale 1 Lane Bryant 1 American Eagle Outfitters 1 LensCrafters 1 Avenue 1 Long John Silver's 1 Bath & Body Works 1 Maurices 1 CVS 1 Motherhood Maternity 1 Caribou Coffee 1 New Balance 5 Carson Pirie Scott 1 New York & Co 1 Catherines 1 Nike 2 Charlotte Russe 1 Olive Garden 1 Chuck E. Cheese's 1 Pac Sun 1 Comfort Suites 1 Panda Express 1 Curves 1 Panera Bread 1 Deb 1 Qdoba Mexican Grill 1 DressBarn 1 RadioShack 1 Dressbarn 1 SONIC Drive-In 1 Eddie Bauer 1 Sears 1 Express 1 Sephora 1 Famous Footwear 1 Spencer Gifts 1 Finish Line 1 Sprint Nextel 1 Firestone Complete Auto Care 1 Subway 1 Foot Locker 1 Toys"R"Us 1 GNC 1 UPS 1 GameStop 1 Vans 1 H&R Block 1 Verizon Wireless 2 Hot Topic 1 Victoria's Secret 1 JCPenney 1 Walgreens 1 Jones New York 1 Wendy's 1 Journeys 1 Wet Seal 1 Justice 1
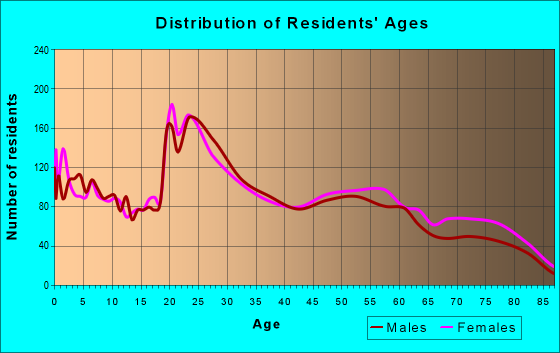


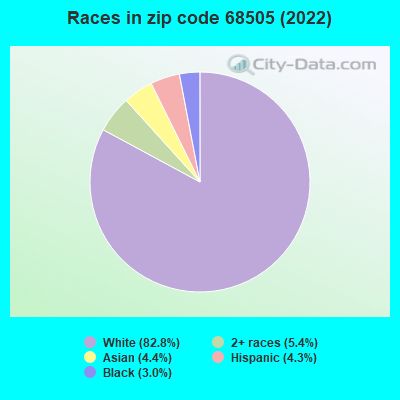


+$395
-$1,077
 Nearest zip codes: 68510, 68507, 68506, 68504, 68503, 68520.