Estimated zip code population in 2022: 28,450 Zip code population in 2010: 27,952 Zip code population in 2000: 27,268
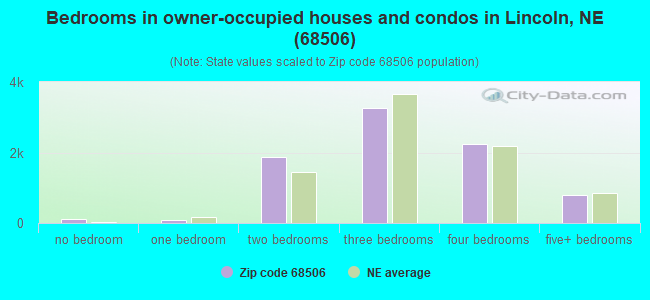
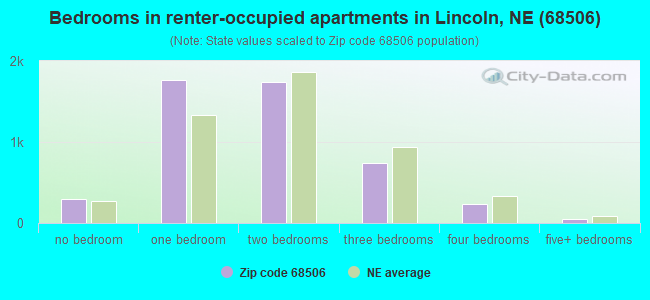
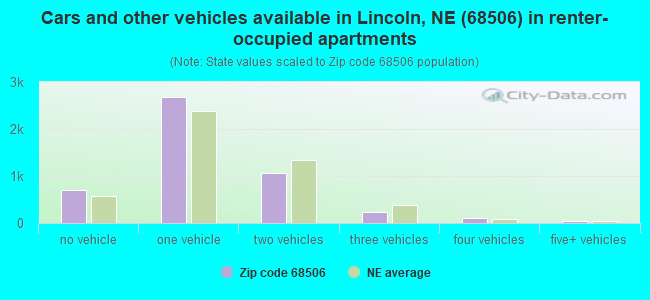
Houses and condos: 13,539 Renter-occupied apartments: 4,794
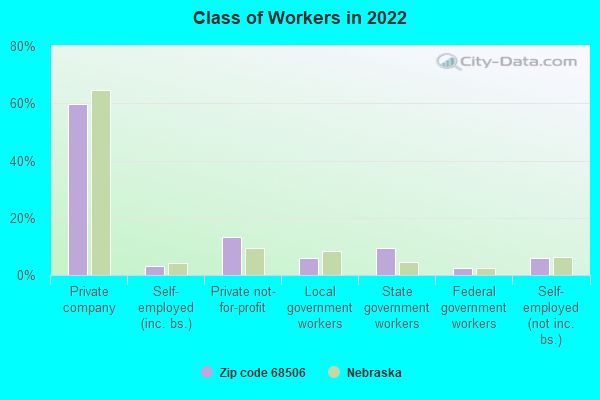
% of renters here:
37%
State:
34%
March 2022 cost of living index in zip code 68506: 85.1 (less than average, U.S. average is 100)
Land area: 7.2 sq. mi. Water area: 0.2 sq. mi.
Population density: 3,956 people per square mile
(average).
OSM Map
General Map
Google Map
MSN Map
OSM Map
General Map
Google Map
MSN Map
OSM Map
General Map
Google Map
MSN Map
OSM Map
General Map
Google Map
MSN Map
Please wait while loading the map...
Real estate property taxes paid for housing units in 2022:
This zip code:
1.5% ($3,871)
Nebraska:
1.4% ($3,313)
Median real estate property taxes paid for housing units with mortgages in 2022: $3,558 (1.4%) Median real estate property taxes paid for housing units with no mortgage in 2022: $4,236 (1.5%)
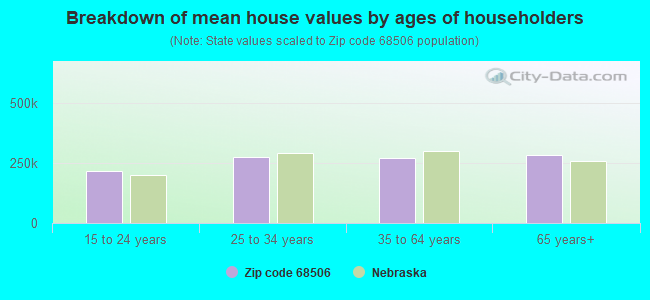
Estimated median house/condo value in 2022: $257,833
68506:
$257,833
Nebraska:
$232,400
According to our research of Nebraska and other state lists, there were 51 registered sex offenders living in 68506 zip code as of April 27, 2024. The ratio of all residents to sex offenders in zip code 68506 is 572 to 1. The ratio of registered sex offenders to all residents in this zip code is lower than the state average.
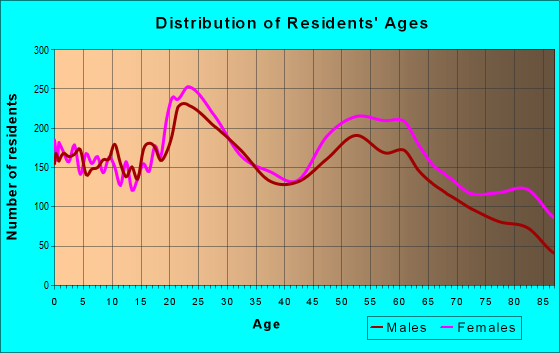
Median resident age:
This zip code:
40.5 years
Nebraska median age:
37.4 years
Average household size:
This zip code:
2.1 people
Nebraska:
2.4 people
Averages for the 2020 tax year for zip code 68506, filed in 2021:
Average Adjusted Gross Income (AGI) in 2020: $68,134 (Individual Income Tax Returns)
Here:
$68,134
State:
$73,874
Salary/wage: $54,754 (reported on 78.7% of returns)
Here:
$54,754
State:
$58,268
(% of AGI for various income ranges: 1138.8% for AGIs below $25k, 3640.2% for AGIs $25k-50k, 6222.4% for AGIs $50k-75k, 9095.7% for AGIs $75k-100k, 16522.7% for AGIs $100k-200k, 57670.0% for AGIs over 200k)
Taxable interest for individuals: $1,776 (reported on 39.3% of returns)
This zip code:
$1,776
Nebraska:
$1,748
(% of AGI for various income ranges: 30.7% for AGIs below $25k, 34.3% for AGIs $25k-50k, 67.4% for AGIs $50k-75k, 105.9% for AGIs $75k-100k, 258.2% for AGIs $100k-200k, 1926.7% for AGIs over 200k)
Ordinary dividends: $5,299 (reported on 28.4% of returns)
Here:
$5,299
State:
$7,841
(% of AGI for various income ranges: 50.0% for AGIs below $25k, 69.5% for AGIs $25k-50k, 155.4% for AGIs $50k-75k, 204.1% for AGIs $75k-100k, 553.0% for AGIs $100k-200k, 4620.0% for AGIs over 200k)
Net capital gain/loss in AGI: +$13,631 (reported on 26.0% of returns)
Here:
+$13,631
State:
+$21,703
(% of AGI for various income ranges: 31.6% for AGIs below $25k, 46.0% for AGIs $25k-50k, 131.1% for AGIs $50k-75k, 217.6% for AGIs $75k-100k, 962.3% for AGIs $100k-200k, 21942.7% for AGIs over 200k)
Profit/loss from business: +$10,505 (reported on 13.5% of returns)
Here:
+$10,505
State:
+$11,239
(% of AGI for various income ranges: 88.9% for AGIs below $25k, 100.5% for AGIs $25k-50k, 151.2% for AGIs $50k-75k, 229.8% for AGIs $75k-100k, 423.1% for AGIs $100k-200k, 3359.3% for AGIs over 200k)
Taxable individual retirement arrangement distribution: $18,113 (reported on 15.4% of returns)
68506:
$18,113
Nebraska:
$18,251
(% of AGI for various income ranges: 112.8% for AGIs below $25k, 166.7% for AGIs $25k-50k, 351.2% for AGIs $50k-75k, 574.0% for AGIs $75k-100k, 1109.7% for AGIs $100k-200k, 4760.0% for AGIs over 200k)
Self-employed (Keogh) retirement plans: $19,883 (reported on 0.4% of returns)
68506:
$19,883
Nebraska:
$23,519
(% of AGI for various income ranges: 42.4% for AGIs $100k-200k, 459.3% for AGIs over 200k)
Total itemized deductions: $31,792 (reported on 7.9% of returns)
Here:
$31,792
State:
$37,704
(% of AGI for various income ranges: 87.1% for AGIs below $25k, 133.3% for AGIs $25k-50k, 272.5% for AGIs $50k-75k, 537.6% for AGIs $75k-100k, 816.9% for AGIs $100k-200k, 6585.3% for AGIs over 200k)
Charity contributions: $13,536 (reported on 6.6% of returns)
Here:
$13,536
State:
$15,251
(% of AGI for various income ranges: 8.4% for AGIs below $25k, 18.1% for AGIs $25k-50k, 59.8% for AGIs $50k-75k, 139.3% for AGIs $75k-100k, 294.4% for AGIs $100k-200k, 4065.3% for AGIs over 200k)
Taxes paid: $7,381 (reported on 7.9% of returns)
68506:
$7,381
State:
$8,015
(% of AGI for various income ranges: 10.4% for AGIs below $25k, 23.4% for AGIs $25k-50k, 72.7% for AGIs $50k-75k, 160.0% for AGIs $75k-100k, 234.0% for AGIs $100k-200k, 1150.7% for AGIs over 200k)
Earned income credit: $2,003 (reported on 9.6% of returns)
Here:
$2,003
State:
$2,260
(% of AGI for various income ranges: 57.6% for AGIs below $25k, 38.9% for AGIs $25k-50k, 1.1% for AGIs $50k-75k)
Percentage of individuals using paid preparers for their 2020 taxes: 94.6%
Here:
95%
State:
95%
(% for various income ranges: 92.8% for AGIs below $25k, 95.7% for AGIs $25k-50k, 95.4% for AGIs $50k-75k, 95.7% for AGIs $75k-100k, 94.6% for AGIs $100k-200k, 94.1% for AGIs over 200k)
Averages for the 2012 tax year for zip code 68506, filed in 2013:
Average Adjusted Gross Income (AGI) in 2012: $59,969 (Individual Income Tax Returns)
Here:
$59,969
State:
$60,572
Salary/wage: $47,398 (reported on 81.0% of returns)
Here:
$47,398
State:
$47,046
(% of AGI for various income ranges: 72.3% for AGIs below $25k, 76.8% for AGIs $25k-50k, 72.2% for AGIs $50k-75k, 69.4% for AGIs $75k-100k, 66.7% for AGIs $100k-200k, 38.3% for AGIs over 200k)
Taxable interest for individuals: $1,702 (reported on 44.2% of returns)
This zip code:
$1,702
Nebraska:
$1,535
(% of AGI for various income ranges: 2.1% for AGIs below $25k, 0.9% for AGIs $25k-50k, 0.8% for AGIs $50k-75k, 1.3% for AGIs $75k-100k, 1.1% for AGIs $100k-200k, 1.7% for AGIs over 200k)
Ordinary dividends: $4,968 (reported on 30.3% of returns)
Here:
$4,968
State:
$5,776
(% of AGI for various income ranges: 3.0% for AGIs below $25k, 1.5% for AGIs $25k-50k, 1.7% for AGIs $50k-75k, 1.8% for AGIs $75k-100k, 2.6% for AGIs $100k-200k, 4.1% for AGIs over 200k)
Net capital gain/loss in AGI: +$11,971 (reported on 22.8% of returns)
Here:
+$11,971
State:
+$16,171
(% of AGI for various income ranges: 0.3% for AGIs $25k-50k, 0.6% for AGIs $50k-75k, 1.4% for AGIs $75k-100k, 2.1% for AGIs $100k-200k, 17.6% for AGIs over 200k)
Profit/loss from business: +$12,051 (reported on 15.2% of returns)
Here:
+$12,051
State:
+$9,897
(% of AGI for various income ranges: 5.3% for AGIs below $25k, 2.9% for AGIs $25k-50k, 2.3% for AGIs $50k-75k, 2.1% for AGIs $75k-100k, 2.9% for AGIs $100k-200k, 4.0% for AGIs over 200k)
Taxable individual retirement arrangement distribution: $15,593 (reported on 16.9% of returns)
68506:
$15,593
Nebraska:
$12,804
(% of AGI for various income ranges: 5.8% for AGIs below $25k, 3.7% for AGIs $25k-50k, 3.9% for AGIs $50k-75k, 4.5% for AGIs $75k-100k, 4.9% for AGIs $100k-200k, 4.1% for AGIs over 200k)
Self-employment retirement plans: $18,010 (reported on 0.7% of returns)
68506:
$18,010
Nebraska:
$18,457
(% of AGI for various income ranges: 0.3% for AGIs $100k-200k, 0.6% for AGIs over 200k)
Total itemized deductions: $21,034 (21% of AGI, reported on 37.9% of returns)
Here:
$21,034
State:
$23,343
Here:
20.6% of AGI
State:
18.7% of AGI
(% of AGI for various income ranges: 14.1% for AGIs below $25k, 10.8% for AGIs $25k-50k, 12.4% for AGIs $50k-75k, 14.6% for AGIs $75k-100k, 14.7% for AGIs $100k-200k, 13.0% for AGIs over 200k)
Charity contributions: $5,433 (reported on 33.1% of returns)
Here:
$5,433
State:
$4,921
(% of AGI for various income ranges: 1.4% for AGIs below $25k, 1.5% for AGIs $25k-50k, 2.1% for AGIs $50k-75k, 2.8% for AGIs $75k-100k, 3.2% for AGIs $100k-200k, 5.3% for AGIs over 200k)
Taxes paid: $8,337 (reported on 37.8% of returns)
68506:
$8,337
State:
$9,758
(% of AGI for various income ranges: 2.5% for AGIs below $25k, 3.2% for AGIs $25k-50k, 4.3% for AGIs $50k-75k, 5.7% for AGIs $75k-100k, 7.0% for AGIs $100k-200k, 6.0% for AGIs over 200k)
Earned income credit: $1,899 (reported on 11.3% of returns)
Here:
$1,899
State:
$2,188
(% of AGI for various income ranges: 3.7% for AGIs below $25k, 0.6% for AGIs $25k-50k)
Percentage of individuals using paid preparers for their 2012 taxes: 54.1%
Here:
54%
State:
57%
(% for various income ranges: 47.0% for AGIs below $25k, 50.8% for AGIs $25k-50k, 58.4% for AGIs $50k-75k, 60.7% for AGIs $75k-100k, 63.9% for AGIs $100k-200k, 83.8% for AGIs over 200k)
Averages for the 2004 tax year for zip code 68506, filed in 2005:
Average Adjusted Gross Income (AGI) in 2004: $50,211 (Individual Income Tax Returns)
Here:
$50,211
State:
$44,271
Salary/wage: $41,798 (reported on 81.5% of returns)
Here:
$41,798
State:
$38,230
(% of AGI for various income ranges: 120.3% for AGIs below $10k, 72.3% for AGIs $10k-25k, 76.4% for AGIs $25k-50k, 72.8% for AGIs $50k-75k, 76.6% for AGIs $75k-100k, 55.2% for AGIs over 100k)
Taxable interest for individuals: $2,232 (reported on 56.5% of returns)
This zip code:
$2,232
Nebraska:
$1,759
(% of AGI for various income ranges: 10.4% for AGIs below $10k, 3.9% for AGIs $10k-25k, 2.6% for AGIs $25k-50k, 2.1% for AGIs $50k-75k, 1.7% for AGIs $75k-100k, 2.5% for AGIs over 100k)
Taxable dividends: $4,007 (reported on 36.9% of returns)
Here:
$4,007
State:
$2,804
(% of AGI for various income ranges: 7.2% for AGIs below $10k, 2.7% for AGIs $10k-25k, 1.8% for AGIs $25k-50k, 2.2% for AGIs $50k-75k, 1.7% for AGIs $75k-100k, 4.3% for AGIs over 100k)
Net capital gain/loss: +$6,863 (reported on 30.2% of returns)
Here:
+$6,863
State:
+$7,887
(% of AGI for various income ranges: -0.9% for AGIs below $10k, -0.2% for AGIs $10k-25k, 0.8% for AGIs $25k-50k, 1.1% for AGIs $50k-75k, 1.2% for AGIs $75k-100k, 9.5% for AGIs over 100k)
Profit/loss from business: +$9,955 (reported on 15.8% of returns)
Here:
+$9,955
State:
+$7,743
(% of AGI for various income ranges: 1.8% for AGIs below $10k, 3.9% for AGIs $10k-25k, 2.5% for AGIs $25k-50k, 2.6% for AGIs $50k-75k, 2.2% for AGIs $75k-100k, 4.0% for AGIs over 100k)
IRA payment deduction: $2,867 (reported on 3.1% of returns)
68506:
$2,867
Nebraska:
$2,902
(% of AGI for various income ranges: 0.3% for AGIs below $10k, 0.2% for AGIs $10k-25k, 0.3% for AGIs $25k-50k, 0.2% for AGIs $50k-75k, 0.2% for AGIs $75k-100k, 0.1% for AGIs over 100k)
Self-employed pension: $12,088 (reported on 1.1% of returns)
Here:
$12,088
Nebraska:
$12,366
(% of AGI for various income ranges: 0.0% for AGIs $25k-50k, 0.1% for AGIs $50k-75k, 0.2% for AGIs $75k-100k, 0.5% for AGIs over 100k)
Total itemized deductions: $18,362 (22% of AGI, reported on 43.2% of returns)
Here:
$18,362
State:
$18,692
Here:
21.9% of AGI
State:
21.1% of AGI
(% of AGI for various income ranges: 21.4% for AGIs below $10k, 14.6% for AGIs $10k-25k, 14.6% for AGIs $25k-50k, 17.5% for AGIs $50k-75k, 17.5% for AGIs $75k-100k, 15.0% for AGIs over 100k)
Charity contributions deductions: $4,255 (5% of AGI, reported on 39.8% of returns)
Here:
$4,255
State:
$3,500
Here:
4.9% of AGI
State:
3.8% of AGI
(% of AGI for various income ranges: 1.8% for AGIs below $10k, 2.0% for AGIs $10k-25k, 2.1% for AGIs $25k-50k, 2.9% for AGIs $50k-75k, 3.2% for AGIs $75k-100k, 4.6% for AGIs over 100k)
Total tax: $7,431 (reported on 80.5% of returns)
68506:
$7,431
State:
$6,550
(% of AGI for various income ranges: 3.4% for AGIs below $10k, 4.6% for AGIs $10k-25k, 7.4% for AGIs $25k-50k, 8.6% for AGIs $50k-75k, 10.1% for AGIs $75k-100k, 18.2% for AGIs over 100k)
Earned income credit: $1,405 (reported on 7.8% of returns)
Here:
$1,405
State:
$1,643
Percentage of individuals using paid preparers for their 2004 taxes: 57.0%
Here:
57%
State:
62%
(% for various income ranges: 47.4% for AGIs below $10k, 53.4% for AGIs $10k-25k, 57.5% for AGIs $25k-50k, 62.1% for AGIs $50k-75k, 59.8% for AGIs $75k-100k, 71.1% for AGIs over 100k)
Likely homosexual households (counted as self-reported same-sex unmarried-partner households)
Lesbian couples: 0.1% of all households
Gay men: 0.1% of all households
Household received Food Stamps/SNAP in the past 12 months: 572 Household did not receive Food Stamps/SNAP in the past 12 months: 12,490
Women who had a birth in the past 12 months: 288 (237 now married, 55 unmarried) Women who did not have a birth in the past 12 months: 6,081 (2,700 now married, 3,380 unmarried)
Housing units in zip code 68506 with a mortgage: 4,989 (557 second mortgage, 417 both second mortgage and home equity loan) Houses without a mortgage: 181
Median monthly owner costs for units with a mortgage: $1,464 Median monthly owner costs for units without a mortgage: $668
Residents with income below the poverty level in 2022:
This zip code:
9.1%
Whole state:
11.2%
Residents with income below 50% of the poverty level in 2022:
This zip code:
4.5%
Whole state:
6.1%
Median number of rooms in houses and condos:
Here:
7.4
State:
7.1
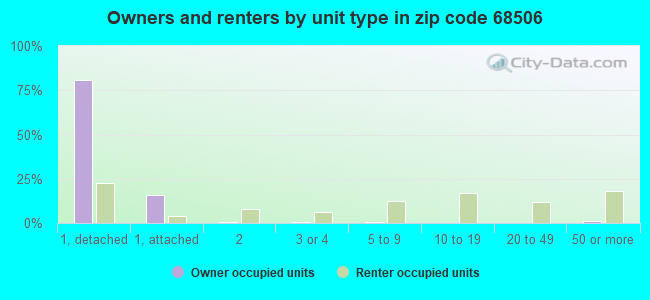
Median number of rooms in apartments:
Here:
3.8
State:
4.2
Notable locations in this zip code not listed on our city pages
Notable locations in zip code 68506: Van Dorn Plaza (A), Holmes Park Golf Course (B), Madonna Rehabilitation Hospital (C), Calvert Recreation Center (D), Rees Hall (E), Prescott Hall (F), Plant Services Building (G), Larson Lifestyle Center (H), Jorgensen Hall (I), Prairie View Hematology Clinic (J), Sports Medicine Institute of Nebraska (K), National Museum of Roller Skating (L), Lincoln Orthopedic and Sports Medicine Clinic (M), Mosier-Timperley Chiropractic Clinic (N), Housecalls Phlebotomy Center (O), Family Dentistry Center (P), Beverly Health and Rehabilitation Center (Q), Arthritis Center of Nebraska (R), Osteoporosis Center of Nebraska (S), Nebraska Heart Institute (T). Display/hide their locations on the map
Churches in zip code 68506 include: First Evangelical Free Church (A), Bethel Baptist Church (B), First Church of the Nazarene (C), First Lutheran Church (D), New Life Bible Church (E), Second Baptist Church (F), Holmes Park Bible Church (G), College View Seventh Day Adventist Church (H), Lincoln Friends Church (I). Display/hide their locations on the map
Parks in zip code 68506 include: College View Park (1), Eden Park (2), Holmes Park (3), Memorial Park (4), Normal Park (5), Sunburst Park (6), Roose Park (7), Pansing Park (8), Colonial Hills Park (9). Display/hide their locations on the map
Tourist attractions (not listed on the city page) : USAC RS (Museums; 4730 South Street), United States Amateur Confederation of Rollr Sktng (Museums; 4730 South Street), Bryanlgh Medical Center - Childbirth Education Services- Bryanlgh East- Bryan Medical P (Cultural Attractions- Events- & Facilities; 1600 South 48th Street), Libraries Lincoln City - Branch Libraries- Charles H GERE (Cultural Attractions- Events- & Facilities; 2400 South 56th Street), Nebraska Discount Travel (Tours & Charters; 3815 South Street).
3,914 married couples with children.
1,169 single-parent households (331 men, 838 women).
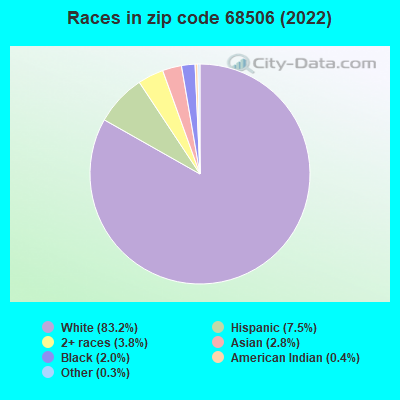
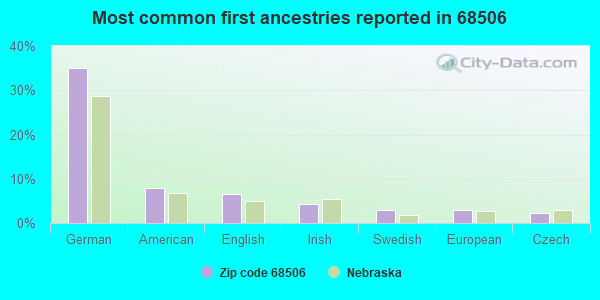
91.5% of residents of 68506 zip code speak English at home.
3.2% of residents speak Spanish at home (76% very well, 15% well, 7% not well, 1% not at all).
2.7% of residents speak other Indo-European language at home (65% very well, 16% well, 9% not well, 10% not at all).
2.6% of residents speak Asian or Pacific Island language at home (50% very well, 26% well, 12% not well, 12% not at all).
0.5% of residents speak other language at home (62% very well, 23% well, 15% not well).
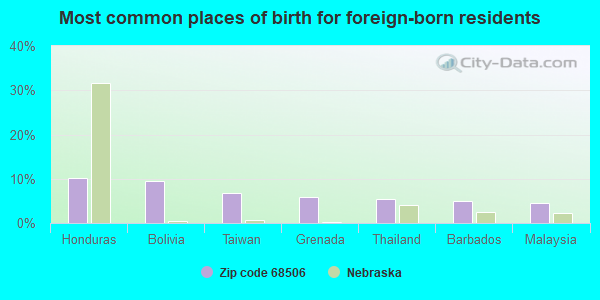
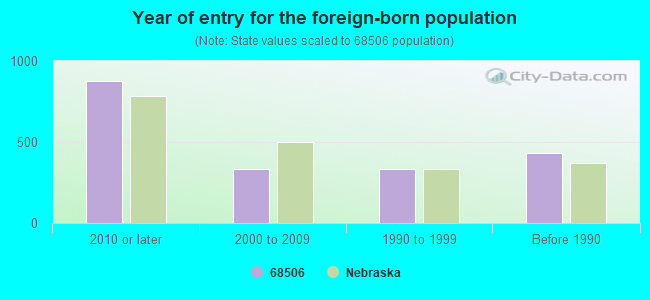
Foreign born population: 1,830 (6.4%) (63.8% of them are naturalized citizens)
Major facilities with environmental interests located in this zip code:
FABRIC CARE CENTER (4831 NORMAL BLVD in LINCOLN, NE)
AIR MINOR (AIRS/AFS) STATE MASTER (Nebraska tracking) - AIR PROGRAM, HAZARDOUS WASTE PROGRAM CRITERIA AND HAZARDOUS AIR POLLUTANT INVENTORY (Inventory of air pollution sources) Conditionally Exempt Small Quantity Generators, less than 100 kg/month of hazardous waste (Resource Conservation and Recovery Act (tracking hazardous waste)) Business SIC classification: DRYCLEANING PLANTS, EXCEPT RUG CLEANING Organizations: BURR ENTERPRISES (CONTACT/OWNER)
, BURR ENTERPRISES INC (CONTACT/OWNER)
Alternative names: FABRIC CARE CENTER BURR ENT INC, IVAN BURR
WAYNE'S BODY SHOP (4721 COOPER AVE in LINCOLN, NE)
STATE MASTER (Nebraska tracking) - HAZARDOUS WASTE PROGRAM (Resource Conservation and Recovery Act (tracking hazardous waste)) Organizations: WAYNE KENNEDY (CONTACT/OWNER)
, CRAIG JOHNSON (CONTACT/OWNER)
MADONNA REHABILITATION HOSP (5401 SOUTH ST in LINCOLN, NE)
AIR MINOR (AIRS/AFS) STATE MASTER (Nebraska tracking) - LEAKING STORAGE TANK Business SIC classification: NURSING AND PERSONAL CARE FACILITIES Alternative names: MADONNA_REHAB HOSPITAL
COLLEGE VIEW ACADEMY (5240 CALVERT ST in LINCOLN, NE)
(Integrated Compliance Information System) - ICIS-07-1999-0095, FORMAL ENFORCEMENT ACTION COMPLIANCE ACTIVITY (Tracking inspections of insecticide, fungicide, and rodenticide, and toxic substances) Alternative names: HELEN HYATT ELEMENTARY SCHOOL
LUX MIDDLE SCHOOL ( in LINCOLN, NE)
(Geographic Names Information System) (National Center for Education Statistics) - STATE ID-550001058 Organizations: LINCOLN PUBLIC SCHOOLS (SCHOOL DISTRICT)
BRYAN COMMUNITY SCHOOL ( in LINCOLN, NE)
(National Center for Education Statistics) - STATE ID-550001015 Organizations: LINCOLN PUBLIC SCHOOLS (SCHOOL DISTRICT)
CALVERT ELEMENTARY SCHOOL ( in LINCOLN, NE)
(National Center for Education Statistics) - STATE ID-550001014 Organizations: LINCOLN PUBLIC SCHOOLS (SCHOOL DISTRICT)
COLLEGE VIEW 66 SERVICE (48TH & PIONEER in LINCOLN, NE)
(Integrated Compliance Information System) - ICIS-07-1991-0210, FORMAL ENFORCEMENT ACTION
HELEN HYATT_ELEMENTARY SCHOOL (5140 CALVERT ST in LINCOLN, NE)
(Integrated Compliance Information System) - ICIS-07-1999-0095, FORMAL ENFORCEMENT ACTION
FALOS FUMIGATION (2251 PLEASANT HILL RD in LINCOLN, NE)
COMPLIANCE ACTIVITY (Tracking inspections of insecticide, fungicide, and rodenticide, and toxic substances)
ANIS EYE INSTITUTE (1500 S 48TH STREET in LINCOLN, NE)
(Resource Conservation and Recovery Act (tracking hazardous waste))
BADBERG FIREFILTER STICK (1921 S COTNER in LINCOLN, NE)
(Resource Conservation and Recovery Act (tracking hazardous waste)) Business NAICS classification: ALL OTHER MISCELLANEOUS GENERAL PURPOSE MACHINERY MANUFACTURING.
CIRCLE 4 FEED & GRAIN (NO ADDRESS in HICKMAN, NE)
AIR MINOR (AIRS/AFS) Business SIC classification: GRAIN AND FIELD BEANS
Housing units lacking complete plumbing facilities: 0.3% Housing units lacking complete kitchen facilities: 2.2%
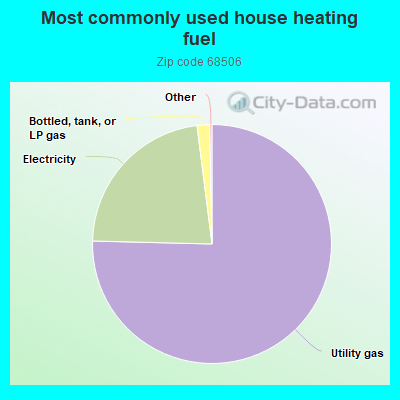
75.4%Utility gas
22.6%Electricity
1.7%Bottled, tank, or LP gas
Population in 1990: 25,903. Population change in the 1990s: +1,365 (+5.3%).
Place of birth for U.S.-born residents:
This state: 19,100
Northeast: 387
Midwest: 3,825
South: 1,455
West: 1,690
55% of the 68506 zip code residents lived in the same house 5 years ago. Out of people who lived in different houses, 64% lived in this county. Out of people who lived in different counties, 50% lived in Nebraska.
90% of the 68506 zip code residents lived in the same house 1 year ago. Out of people who lived in different houses, 68% moved from this county. Out of people who lived in different houses, 9% moved from different county within same state. Out of people who lived in different houses, 17% moved from different state. Out of people who lived in different houses, 5% moved from abroad.
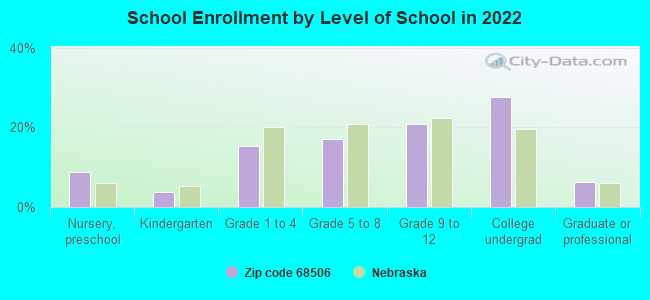
Private vs. public school enrollment:
Students in private schools in grades 1 to 8 (elementary and middle school): 465
Here:
21.2%
Nebraska:
14.1%
Students in private schools in grades 9 to 12 (high school): 245
Here:
17.2%
Nebraska:
12.5%
Students in private undergraduate colleges: 412
Here:
21.9%
Nebraska:
18.0%
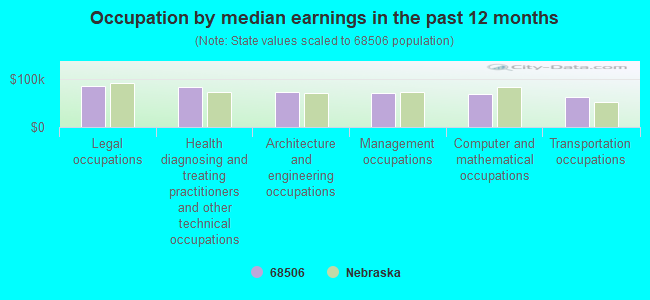
Occupation by median earnings in the past 12 months ($)
85,202Legal occupations
82,722Health diagnosing and treating practitioners and other technical occupations
72,834Architecture and engineering occupations
70,968Management occupations
69,082Computer and mathematical occupations
62,903Transportation occupations
Companies with federal contracts located in this zip code:
LINWELD INC (2900 S 70TH ST , SUITE 40 in LINCOLN, NE; small business) : $340,965 in 373 contractsfrom 2000 to 2006
Contracts for Drugs and Biologicals, Maintenance, Repair or Alteration of Real Property -- Other Non-Building Facilities, Lease or Rental of Equipment -- Miscellaneous, Gases: Compressed and Liquefied, and moreby Department of Veterans Affairs, U.S. Fish and Wildlife Service, Air Force, Bureau of Reclamation, and others Signed by year:2000: $15,000; 2001: $102,072; 2002: $30,062; 2003: $5,000; 2004: $63,473; 2005: $28,521; 2006: $96,837.
Biggest contracts:
$32,000 with Department of Veterans Affairs for Drugs and Biologicals. Taking place in CO. Signed on 2001-10-15. Completion date: 2002-09-15.
$22,000 with U.S. Fish and Wildlife Service for Maintenance, Repair or Alteration of Real Property -- Other Non-Building Facilities. Signed on 2001-07-15. Completion date: 2001-10-15.
$18,320 with Air Force for Lease or Rental of Equipment -- Miscellaneous. Signed on 2005-10-24. Completion date: 2006-09-30.
$17,600, same as above.Signed on 2004-10-06. Completion date: 2005-09-30.
COMMERCIAL INVESTMENT PROPERTI (3808 NORMAL BLVD in LINCOLN, NE) : $197,776 in 8 contractsfrom 2003 to 2005
Contracts for Lease or Rental of Facilities -- Troop Housing Facilities by Army Signed by year:2000: $0; 2001: $0; 2002: $0; 2003: $89,400; 2004: $106,800; 2005: $1,576; 2006: $0.
Biggest contracts:
$106,200 with Army for Lease or Rental of Facilities -- Troop Housing Facilities. Signed on 2004-04-09. Completion date: 2004-05-01.
$89,400, same as above.Signed on 2003-04-02. Completion date: 2003-05-01.
$2,900, same as above.Signed on 2003-12-02. Completion date: 2004-02-01.
$1,576, same as above.Signed on 2005-02-23. Completion date: 2003-05-01.
thomas e. hiller (1520 South 70th st. in Lincoln, NE; small business) : $82,062 in 3 contractsfrom 2004 to 2005
$31,781 with Offices, Boards and Divisions (includes Attorney General, Deputy Attorney General, etc.) for Expert Witness. Taking place in AR. Signed on 2004-12-06. Completion date: 2005-07-01.
$29,076, same as above.Signed on 2005-07-01. Completion date: 2005-12-31.
$21,205, same as above.Signed on 2005-12-31. Completion date: 2006-02-28.
HEIDI STARK (7932 BANCROFT AVE in LINCOLN, NE; small business)
$47,520 with Public Health Service for Dentistry Services. Taking place in SD. Signed on 2003-10-01. Completion date: 2004-09-30.
JAG CONSULTING INC (3910 S 83RD ST in LINCOLN, NE; small business)
$16,050 with Army for Program Management/Support Services. Signed on 2004-08-19. Completion date: 2005-02-28.
GAUTHIER, PERRY (4547 CALVERT ST in LINCOLN, NE; small business) : $14,681 in 2 contractsin 2002
$9,837 with Army for Simulation. Signed on 2002-09-26. Completion date: 2002-10-08.
$4,844 with U.S. Army Corps of Engineers - civil program financing only for Other Architect and Engineering Services. Signed on 2002-05-29. Completion date: 2002-06-21.
AMERICOM COMMUNICATIONS CORP (3743 S 48TH ST in LINCOLN, NE; small business)
$4,875 with Defense Information Systems Agency for Telephone and/or Communications Services (includes Telegraph, Telex, and Cablevision Services). Signed on 2004-07-06. Completion date: 2004-07-02.
VALENTINO'S, INC (2601 S 70TH ST in LINCOLN, NE; small business)
$4,742 with Army for Special Dietary Foods and Food Specialty Preparations. Signed on 2006-06-09. Completion date: 2006-06-11.
Top industries in this zip code by the number of employees in 2005:
Health Care and Social Assistance: Specialty (except Psychiatric and Substance Abuse) Hospitals (over 1000 employees: 1 establishment)
Health Care and Social Assistance: General Medical and Surgical Hospitals (over 1000: 1)
Health Care and Social Assistance: Offices of Physicians (except Mental Health Specialists) (100-249: 2, 50-99: 1, 20-49: 13, 10-19: 11, 5-9: 9, 1-4: 21)
Educational Services: Colleges, Universities, and Professional Schools (500-999: 1)
2002 - 2018 National Fire Incident Reporting System (NFIRS) incidents
Based on the data from the years 2002 - 2018 the average number of fire incidents per year is 17. The highest number of fire incidents - 41 took place in 2012, and the least - 0 in 2003. The data has a rising trend.
When looking into fire subcategories, the most incidents belonged to: Structure Fires (53.8%), and Outside Fires (28.8%).
Fire incident types reported to NFIRS in Zip Code 68506
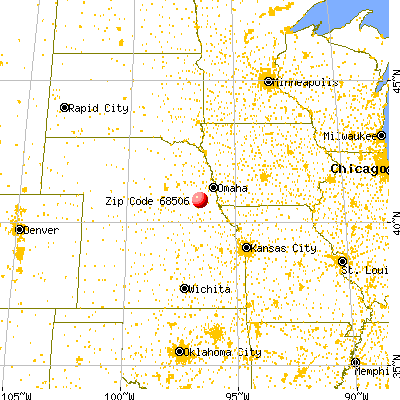


 Nearest zip codes: 68510, 68505, 68516, 68503, 68502, 68526.
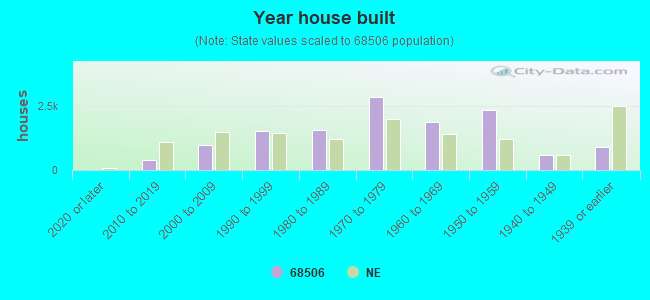


 Based on the data from the years 2002 - 2018 the average number of fire incidents per year is 17. The highest number of fire incidents - 41 took place in 2012, and the least - 0 in 2003. The data has a rising trend.
 When looking into fire subcategories, the most incidents belonged to: Structure Fires (53.8%), and Outside Fires (28.8%).