Estimated zip code population in 2022: 40,089 Zip code population in 2010: 40,150 Zip code population in 2000: 43,455
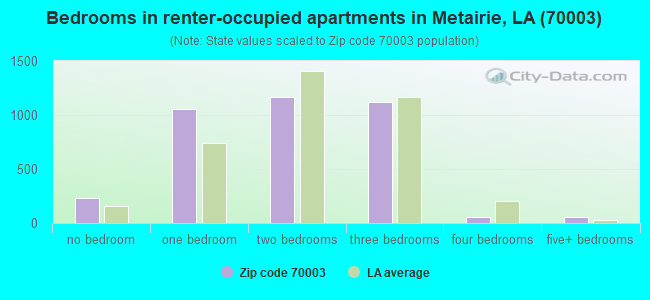
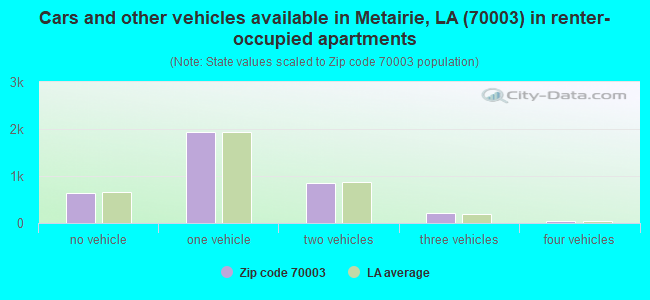
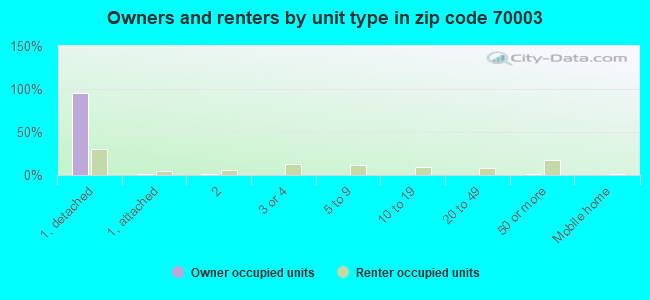
Houses and condos: 17,896 Renter-occupied apartments: 3,686
% of renters here:
22%
State:
32%
March 2022 cost of living index in zip code 70003: 95.3 (near average, U.S. average is 100)
Land area: 7.0 sq. mi. Water area: 0.2 sq. mi.
Population density: 5,711 people per square mile
(average).
OSM Map
General Map
Google Map
MSN Map
OSM Map
General Map
Google Map
MSN Map
OSM Map
General Map
Google Map
MSN Map
OSM Map
General Map
Google Map
MSN Map
Please wait while loading the map...
Real estate property taxes paid for housing units in 2022:
This zip code:
0.5% ($1,257)
Louisiana:
0.5% ($1,127)
Median real estate property taxes paid for housing units with mortgages in 2022: $1,486 (0.5%) Median real estate property taxes paid for housing units with no mortgage in 2022: $1,017 (0.4%)
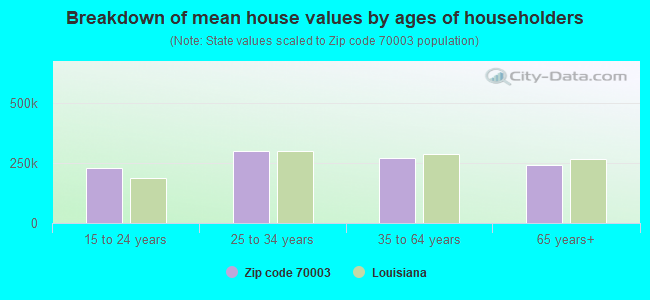
Estimated median house/condo value in 2022: $256,568
70003:
$256,568
Louisiana:
$209,200
According to our research of Louisiana and other state lists, there were 43 registered sex offenders living in 70003 zip code as of April 27, 2024. The ratio of all residents to sex offenders in zip code 70003 is 967 to 1. The ratio of registered sex offenders to all residents in this zip code is much lower than the state average.
Median resident age:
This zip code:
46.4 years
Louisiana median age:
38.2 years
Average household size:
This zip code:
2.3 people
Louisiana:
2.5 people
Averages for the 2020 tax year for zip code 70003, filed in 2021:
Average Adjusted Gross Income (AGI) in 2020: $63,592 (Individual Income Tax Returns)
Here:
$63,592
State:
$60,757
Salary/wage: $52,708 (reported on 77.9% of returns)
Here:
$52,708
State:
$50,882
(% of AGI for various income ranges: 1010.2% for AGIs below $25k, 3425.4% for AGIs $25k-50k, 6385.7% for AGIs $50k-75k, 9466.3% for AGIs $75k-100k, 16923.1% for AGIs $100k-200k, 56459.0% for AGIs over 200k)
Taxable interest for individuals: $1,469 (reported on 29.6% of returns)
This zip code:
$1,469
Louisiana:
$1,576
(% of AGI for various income ranges: 20.0% for AGIs below $25k, 30.9% for AGIs $25k-50k, 55.9% for AGIs $50k-75k, 81.6% for AGIs $75k-100k, 117.4% for AGIs $100k-200k, 1148.0% for AGIs over 200k)
Ordinary dividends: $4,503 (reported on 18.1% of returns)
Here:
$4,503
State:
$7,743
(% of AGI for various income ranges: 20.5% for AGIs below $25k, 34.8% for AGIs $25k-50k, 87.0% for AGIs $50k-75k, 151.5% for AGIs $75k-100k, 287.4% for AGIs $100k-200k, 2647.0% for AGIs over 200k)
Net capital gain/loss in AGI: +$10,352 (reported on 15.9% of returns)
Here:
+$10,352
State:
+$16,917
(% of AGI for various income ranges: 8.4% for AGIs below $25k, 28.6% for AGIs $25k-50k, 79.1% for AGIs $50k-75k, 133.1% for AGIs $75k-100k, 447.0% for AGIs $100k-200k, 9754.0% for AGIs over 200k)
Profit/loss from business: +$9,477 (reported on 21.8% of returns)
Here:
+$9,477
State:
+$7,679
(% of AGI for various income ranges: 185.9% for AGIs below $25k, 162.9% for AGIs $25k-50k, 286.9% for AGIs $50k-75k, 413.0% for AGIs $75k-100k, 542.6% for AGIs $100k-200k, 2748.0% for AGIs over 200k)
Taxable individual retirement arrangement distribution: $16,839 (reported on 9.5% of returns)
70003:
$16,839
Louisiana:
$20,716
(% of AGI for various income ranges: 54.2% for AGIs below $25k, 105.2% for AGIs $25k-50k, 230.1% for AGIs $50k-75k, 346.0% for AGIs $75k-100k, 695.3% for AGIs $100k-200k, 2369.5% for AGIs over 200k)
Self-employed (Keogh) retirement plans: $15,022 (reported on 0.5% of returns)
70003:
$15,022
Louisiana:
$27,459
(% of AGI for various income ranges: 13.5% for AGIs $50k-75k, 27.3% for AGIs $100k-200k, 339.0% for AGIs over 200k)
Total itemized deductions: $30,160 (reported on 5.0% of returns)
Here:
$30,160
State:
$36,265
(% of AGI for various income ranges: 34.8% for AGIs below $25k, 84.6% for AGIs $25k-50k, 220.3% for AGIs $50k-75k, 326.4% for AGIs $75k-100k, 599.1% for AGIs $100k-200k, 3327.0% for AGIs over 200k)
Charity contributions: $7,751 (reported on 3.7% of returns)
Here:
$7,751
State:
$13,106
(% of AGI for various income ranges: 1.8% for AGIs below $25k, 10.7% for AGIs $25k-50k, 31.9% for AGIs $50k-75k, 50.4% for AGIs $75k-100k, 126.8% for AGIs $100k-200k, 887.0% for AGIs over 200k)
Taxes paid: $5,980 (reported on 4.6% of returns)
70003:
$5,980
State:
$6,643
(% of AGI for various income ranges: 2.1% for AGIs below $25k, 10.1% for AGIs $25k-50k, 33.8% for AGIs $50k-75k, 62.0% for AGIs $75k-100k, 133.5% for AGIs $100k-200k, 682.5% for AGIs over 200k)
Earned income credit: $2,381 (reported on 18.0% of returns)
Here:
$2,381
State:
$2,671
(% of AGI for various income ranges: 116.0% for AGIs below $25k, 67.9% for AGIs $25k-50k, 0.7% for AGIs $50k-75k)
Percentage of individuals using paid preparers for their 2020 taxes: 89.7%
Here:
90%
State:
92%
(% for various income ranges: 88.1% for AGIs below $25k, 91.4% for AGIs $25k-50k, 89.9% for AGIs $50k-75k, 91.1% for AGIs $75k-100k, 90.4% for AGIs $100k-200k, 89.3% for AGIs over 200k)
Averages for the 2012 tax year for zip code 70003, filed in 2013:
Average Adjusted Gross Income (AGI) in 2012: $54,226 (Individual Income Tax Returns)
Here:
$54,226
State:
$56,730
Salary/wage: $46,549 (reported on 81.9% of returns)
Here:
$46,549
State:
$45,545
(% of AGI for various income ranges: 71.6% for AGIs below $25k, 79.6% for AGIs $25k-50k, 77.6% for AGIs $50k-75k, 76.8% for AGIs $75k-100k, 76.4% for AGIs $100k-200k, 44.3% for AGIs over 200k)
Taxable interest for individuals: $2,739 (reported on 34.2% of returns)
This zip code:
$2,739
Louisiana:
$1,804
(% of AGI for various income ranges: 1.5% for AGIs below $25k, 0.9% for AGIs $25k-50k, 0.8% for AGIs $50k-75k, 0.7% for AGIs $75k-100k, 0.9% for AGIs $100k-200k, 4.9% for AGIs over 200k)
Ordinary dividends: $4,047 (reported on 19.8% of returns)
Here:
$4,047
State:
$7,610
(% of AGI for various income ranges: 1.6% for AGIs below $25k, 0.9% for AGIs $25k-50k, 1.2% for AGIs $50k-75k, 1.0% for AGIs $75k-100k, 1.3% for AGIs $100k-200k, 2.5% for AGIs over 200k)
Net capital gain/loss in AGI: +$17,514 (reported on 14.2% of returns)
Here:
+$17,514
State:
+$17,096
(% of AGI for various income ranges: 0.3% for AGIs $25k-50k, 0.4% for AGIs $50k-75k, 0.6% for AGIs $75k-100k, 1.0% for AGIs $100k-200k, 20.6% for AGIs over 200k)
Profit/loss from business: +$14,191 (reported on 18.8% of returns)
Here:
+$14,191
State:
+$12,088
(% of AGI for various income ranges: 11.9% for AGIs below $25k, 4.3% for AGIs $25k-50k, 2.7% for AGIs $50k-75k, 3.3% for AGIs $75k-100k, 3.7% for AGIs $100k-200k, 6.6% for AGIs over 200k)
Taxable individual retirement arrangement distribution: $13,858 (reported on 10.5% of returns)
70003:
$13,858
Louisiana:
$16,085
(% of AGI for various income ranges: 3.2% for AGIs below $25k, 2.3% for AGIs $25k-50k, 2.6% for AGIs $50k-75k, 3.1% for AGIs $75k-100k, 3.2% for AGIs $100k-200k, 1.9% for AGIs over 200k)
Self-employment retirement plans: $22,729 (reported on 0.7% of returns)
70003:
$22,729
Louisiana:
$25,119
(% of AGI for various income ranges: 0.1% for AGIs below $25k, 0.1% for AGIs $75k-100k, 0.3% for AGIs $100k-200k, 0.9% for AGIs over 200k)
Total itemized deductions: $19,967 (19% of AGI, reported on 26.5% of returns)
Here:
$19,967
State:
$23,585
Here:
18.6% of AGI
State:
18.1% of AGI
(% of AGI for various income ranges: 7.0% for AGIs below $25k, 8.7% for AGIs $25k-50k, 11.2% for AGIs $50k-75k, 10.7% for AGIs $75k-100k, 10.4% for AGIs $100k-200k, 9.3% for AGIs over 200k)
Charity contributions: $3,415 (reported on 20.8% of returns)
Here:
$3,415
State:
$5,533
(% of AGI for various income ranges: 0.6% for AGIs below $25k, 0.9% for AGIs $25k-50k, 1.2% for AGIs $50k-75k, 1.2% for AGIs $75k-100k, 1.4% for AGIs $100k-200k, 2.0% for AGIs over 200k)
Taxes paid: $5,281 (reported on 26.3% of returns)
70003:
$5,281
State:
$6,282
(% of AGI for various income ranges: 0.8% for AGIs below $25k, 1.3% for AGIs $25k-50k, 2.1% for AGIs $50k-75k, 2.3% for AGIs $75k-100k, 3.0% for AGIs $100k-200k, 4.3% for AGIs over 200k)
Earned income credit: $2,335 (reported on 19.0% of returns)
Here:
$2,335
State:
$2,633
(% of AGI for various income ranges: 7.4% for AGIs below $25k, 0.9% for AGIs $25k-50k)
Percentage of individuals using paid preparers for their 2012 taxes: 54.4%
Here:
54%
State:
57%
(% for various income ranges: 53.3% for AGIs below $25k, 51.7% for AGIs $25k-50k, 56.5% for AGIs $50k-75k, 55.7% for AGIs $75k-100k, 56.3% for AGIs $100k-200k, 73.9% for AGIs over 200k)
Averages for the 2004 tax year for zip code 70003, filed in 2005:
Average Adjusted Gross Income (AGI) in 2004: $41,428 (Individual Income Tax Returns)
Here:
$41,428
State:
$39,411
Salary/wage: $37,527 (reported on 83.2% of returns)
Here:
$37,527
State:
$34,434
(% of AGI for various income ranges: 96.3% for AGIs below $10k, 73.2% for AGIs $10k-25k, 81.0% for AGIs $25k-50k, 80.0% for AGIs $50k-75k, 82.6% for AGIs $75k-100k, 63.2% for AGIs over 100k)
Taxable interest for individuals: $1,375 (reported on 45.7% of returns)
This zip code:
$1,375
Louisiana:
$1,606
(% of AGI for various income ranges: 3.8% for AGIs below $10k, 2.4% for AGIs $10k-25k, 1.4% for AGIs $25k-50k, 1.3% for AGIs $50k-75k, 1.0% for AGIs $75k-100k, 1.6% for AGIs over 100k)
Taxable dividends: $2,379 (reported on 24.0% of returns)
Here:
$2,379
State:
$3,235
(% of AGI for various income ranges: 2.4% for AGIs below $10k, 1.4% for AGIs $10k-25k, 1.0% for AGIs $25k-50k, 0.9% for AGIs $50k-75k, 1.0% for AGIs $75k-100k, 2.2% for AGIs over 100k)
Net capital gain/loss: +$7,442 (reported on 17.2% of returns)
Here:
+$7,442
State:
+$8,531
(% of AGI for various income ranges: -0.9% for AGIs below $10k, -0.4% for AGIs $10k-25k, 0.6% for AGIs $25k-50k, 0.7% for AGIs $50k-75k, 0.7% for AGIs $75k-100k, 9.5% for AGIs over 100k)
Profit/loss from business: +$10,389 (reported on 16.2% of returns)
Here:
+$10,389
State:
+$9,128
(% of AGI for various income ranges: 12.3% for AGIs below $10k, 6.7% for AGIs $10k-25k, 2.5% for AGIs $25k-50k, 2.6% for AGIs $50k-75k, 2.4% for AGIs $75k-100k, 5.7% for AGIs over 100k)
IRA payment deduction: $2,907 (reported on 3.1% of returns)
70003:
$2,907
Louisiana:
$3,055
(% of AGI for various income ranges: 0.3% for AGIs $10k-25k, 0.3% for AGIs $25k-50k, 0.3% for AGIs $50k-75k, 0.2% for AGIs $75k-100k, 0.1% for AGIs over 100k)
Self-employed pension: $13,612 (reported on 0.7% of returns)
Here:
$13,612
Louisiana:
$17,274
(% of AGI for various income ranges: 0.1% for AGIs $10k-25k, 0.1% for AGIs $25k-50k, 0.1% for AGIs $50k-75k, 0.1% for AGIs $75k-100k, 0.6% for AGIs over 100k)
Total itemized deductions: $16,059 (21% of AGI, reported on 27.6% of returns)
Here:
$16,059
State:
$18,222
Here:
20.8% of AGI
State:
20.3% of AGI
(% of AGI for various income ranges: 7.5% for AGIs below $10k, 6.8% for AGIs $10k-25k, 11.2% for AGIs $25k-50k, 12.1% for AGIs $50k-75k, 12.1% for AGIs $75k-100k, 10.2% for AGIs over 100k)
Charity contributions deductions: $2,686 (3% of AGI, reported on 24.8% of returns)
Here:
$2,686
State:
$4,190
Here:
3.3% of AGI
State:
4.4% of AGI
(% of AGI for various income ranges: 0.4% for AGIs below $10k, 0.7% for AGIs $10k-25k, 1.4% for AGIs $25k-50k, 1.7% for AGIs $50k-75k, 1.8% for AGIs $75k-100k, 2.0% for AGIs over 100k)
Total tax: $6,075 (reported on 74.9% of returns)
70003:
$6,075
State:
$6,529
(% of AGI for various income ranges: 3.7% for AGIs below $10k, 4.0% for AGIs $10k-25k, 7.0% for AGIs $25k-50k, 9.3% for AGIs $50k-75k, 10.6% for AGIs $75k-100k, 18.4% for AGIs over 100k)
Earned income credit: $1,802 (reported on 17.5% of returns)
Here:
$1,802
State:
$2,103
Percentage of individuals using paid preparers for their 2004 taxes: 55.2%
Here:
55%
State:
61%
(% for various income ranges: 50.5% for AGIs below $10k, 58.2% for AGIs $10k-25k, 54.6% for AGIs $25k-50k, 55.0% for AGIs $50k-75k, 54.2% for AGIs $75k-100k, 61.5% for AGIs over 100k)
Likely homosexual households (counted as self-reported same-sex unmarried-partner households)
Lesbian couples: 0.3% of all households
Gay men: 0.2% of all households
Household received Food Stamps/SNAP in the past 12 months: 1,965 Household did not receive Food Stamps/SNAP in the past 12 months: 14,846
Women who had a birth in the past 12 months: 355 (250 now married, 100 unmarried) Women who did not have a birth in the past 12 months: 7,820 (3,184 now married, 4,626 unmarried)
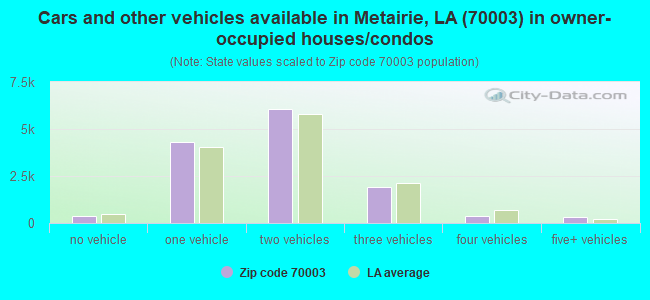
Housing units in zip code 70003 with a mortgage: 7,043 (509 second mortgage, 38 home equity loan, 213 both second mortgage and home equity loan) Houses without a mortgage: 132
Median monthly owner costs for units with a mortgage: $1,668 Median monthly owner costs for units without a mortgage: $541
Residents with income below the poverty level in 2022:
This zip code:
11.8%
Whole state:
18.6%
Residents with income below 50% of the poverty level in 2022:
This zip code:
6.5%
Whole state:
10.1%
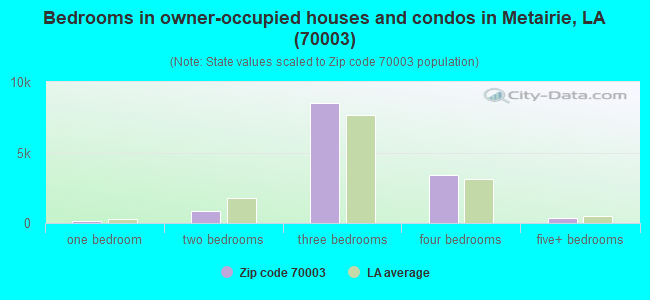
Median number of rooms in houses and condos:
Here:
6.4
State:
6.2
Median number of rooms in apartments:
Here:
4.1
State:
4.4
Notable locations in this zip code not listed on our city pages
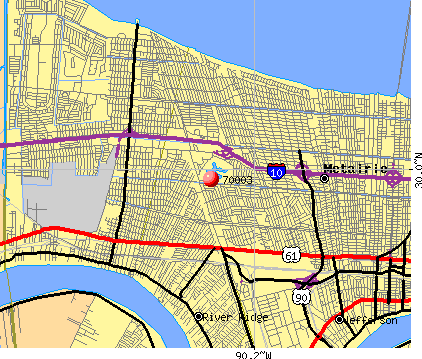
Notable locations in zip code 70003: Bissonet Maned Downs Country Club (A), Eastbank Consolidated Fire Department Station 17 (B), Bunche Career Center (C), Metairie Health Care Center (D), Saint Anthony's Nursing Home (E), The Atrium Adult Care Facility (F). Display/hide their locations on the map
Shopping Centers: M A Green Shopping Center (1), Magnolia Shopping Center (2), Evergreen Plaza Shopping Center (3), Airline Park Shopping Center (4), Barlon Plaza Shopping Center (5). Display/hide their locations on the map
Churches in zip code 70003 include: First Church of God (A), Faith Cumberland Presbyterian Church (B), Triumph Universal Church (C), Saint Matthews United Methodist Church (D), Memorial Baptist Church (E), Atonement Lutheran Church (F), Second New Guide Church (G), Saint Lawrence the Martyr Catholic Church (H), Parkway Presbyterian Church (I). Display/hide their locations on the map
Parks in zip code 70003 include: Miley Park (1), Zephyr Field (2), Girard Playground (3), Mike Miler Park (4), Delta Park (5), Lafreniere Park (6). Display/hide their locations on the map
Tourist attraction (not listed on the city page) : Airboat Adventures LLC (Tours & Charters; 5029 Wade Drive).
4,395 married couples with children.
1,465 single-parent households (445 men, 1,020 women).
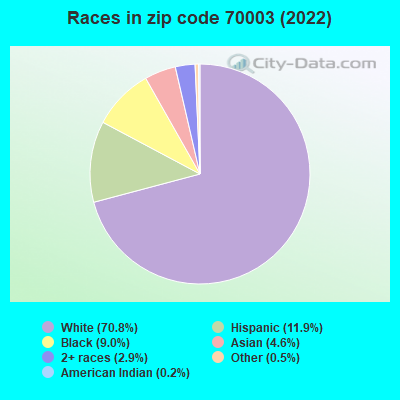
83.5% of residents of 70003 zip code speak English at home.
9.0% of residents speak Spanish at home (70% very well, 13% well, 9% not well, 8% not at all).
3.8% of residents speak other Indo-European language at home (76% very well, 18% well, 5% not well, 1% not at all).
2.0% of residents speak Asian or Pacific Island language at home (63% very well, 25% well, 12% not well).
2.1% of residents speak other language at home (55% very well, 19% well, 25% not well).
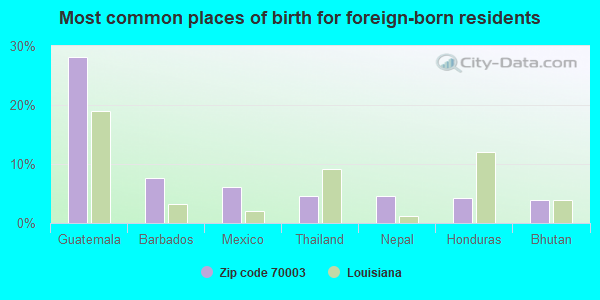
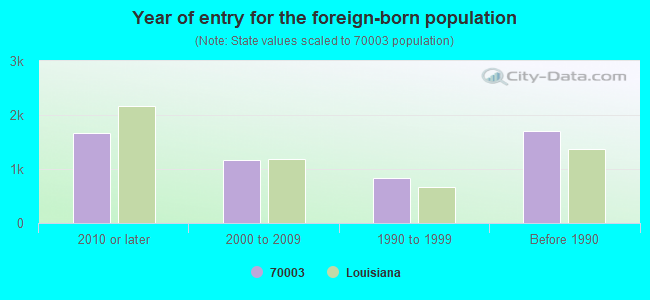
Foreign born population: 5,055 (12.6%) (58.6% of them are naturalized citizens)
Major facilities with environmental interests located in this zip code:
AIRLINE SALVAGE, INC. (6900 AIRLINE DR in METAIRIE, LA)
(Integrated Compliance Information System) - ICIS-06-1997-0135, FORMAL ENFORCEMENT ACTION National Pollutant Discharge Elimination System NON-MAJOR (Tracking pollutant discharge elimination systems) - permit National Pollutant Discharge Elimination System NON-MAJOR (Tracking pollutant discharge elimination systems) - permit National Pollutant Discharge Elimination System NON-MAJOR (Tracking pollutant discharge elimination systems) - permit National Pollutant Discharge Elimination System NON-MAJOR (Tracking pollutant discharge elimination systems) - permit Business SIC classification: MOTOR VEHICLE PARTS, USED; SCRAP AND WASTE MATERIALS Alternative names: AIRLINE AUTO SALVAGE, INC.
AIRLINE PARK ELEMENTARY SCHOOL (6201 CAMPHOR STREET in METAIRIE, LA)
(Geographic Names Information System) (National Center for Education Statistics) - STATE ID-026002 Organizations: JEFFERSON PARISH SCHOOL BOARD (SCHOOL DISTRICT)
GREEN PARK ELEMENTARY SCHOOL (1409 NORTH UPLAND STREET in METAIRIE, LA)
(Geographic Names Information System) (National Center for Education Statistics) - STATE ID-026032 Organizations: JEFFERSON PARISH SCHOOL BOARD (SCHOOL DISTRICT)
HAROLD KELLER ELEMENTARY SCHOOL (5301 IRVING STREET in METAIRIE, LA)
(Geographic Names Information System) (National Center for Education Statistics) - STATE ID-026050 Organizations: JEFFERSON PARISH SCHOOL BOARD (SCHOOL DISTRICT)
HARRIS MIDDLE SCHOOL (911 ELISE AVENUE in METAIRIE, LA)
(Geographic Names Information System) (National Center for Education Statistics) - STATE ID-026039 Organizations: JEFFERSON PARISH SCHOOL BOARD (SCHOOL DISTRICT)
Alternative names: T. H. HARRIS MIDDLE SCHOOL
RALPH J. BUNCHE MIDDLE SCHOOL (8101 SIMON STREET in METAIRIE, LA)
(National Center for Education Statistics) - STATE ID-026102 Organizations: JEFFERSON PARISH SCHOOL BOARD (SCHOOL DISTRICT)
BARTO MARBLE CO INC (7021 AIRLINE HWY in METAIRIE, LA)
AIR MINOR (AIRS/AFS) TRI REPORTER (Tracking of toxic chemicals releasing facilities) Business SIC classification: CUSTOM COMPOUNDING OF PURCHASED PLASTICS RESINS Alternative names: BARTO MARBLE CO INC - CULTURED MARBLE FA
ARTHUR PEST CONTROL (6208 LAFRENIERE ST in METAIRIE, LA) . Tribal Land
(Resource Conservation and Recovery Act (tracking hazardous waste)) Organizations: LEONARD J ARTHUR (CONTACT/OWNER)
ASAP AUTOMOTIVE SVCS (701 LITTLE FARMS AVE in METAIRIE, LA)
(Resource Conservation and Recovery Act (tracking hazardous waste)) Business NAICS classification: OTHER AUTOMOTIVE MECHANICAL AND ELECTRICAL REPAIR AND MAINTENANCE. Organizations: PAUL RICHARD (CONTACT/OWNER)
ATHLETIC IMPRINT (651 DAVID DR in METAIRIE, LA) . Tribal Land
Large Quantity Generators, more that 1000 kg of hazardous waste/month (Resource Conservation and Recovery Act (tracking hazardous waste)) - notification Business NAICS classification: OTHER COMMERCIAL PRINTING. Organizations: ATHLETIC IMPRINT INC (CONTACT/OWNER)
CHARLIE BARTLETT PEST & TERMITE CONTRO (4013 ACADEMY DR in METAIRIE, LA) . Tribal Land
(Resource Conservation and Recovery Act (tracking hazardous waste)) Organizations: CHARLIE BARTLETT SR & JR (CONTACT/OWNER)
CHRISS LIFT TRUCK (7011 IVY ST in METAIRIE, LA) . Tribal Land
Large Quantity Generators, more that 1000 kg of hazardous waste/month (Resource Conservation and Recovery Act (tracking hazardous waste)) - notification Organizations: CHRIS RODEMANN (CONTACT/OWNER)
DUTREIL PEST CONTROL INC (6901 HASTINGS ST in METAIRIE, LA) . Tribal Land
Housing units lacking complete plumbing facilities: 1.1% Housing units lacking complete kitchen facilities: 0.8%
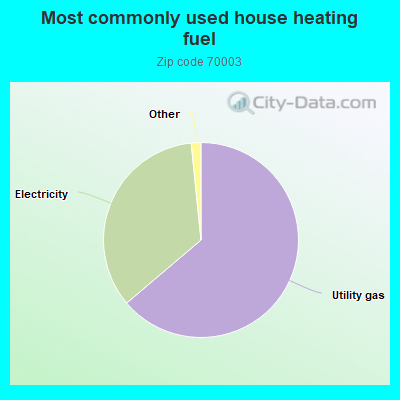
63.8%Utility gas
34.6%Electricity
0.8%Bottled, tank, or LP gas
0.6%No fuel used
Population in 1990: 46,193.
Place of birth for U.S.-born residents:
This state: 27,732
Northeast: 1,716
Midwest: 991
South: 2,987
West: 1,214
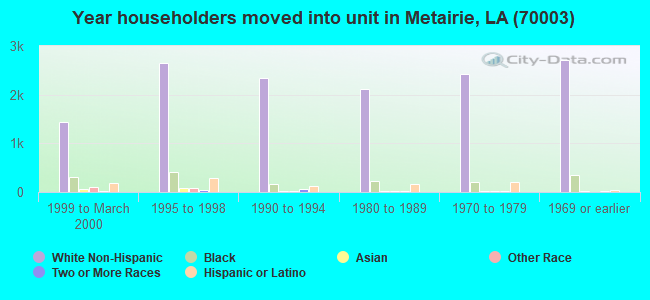
69% of the 70003 zip code residents lived in the same house 5 years ago. Out of people who lived in different houses, 69% lived in this county. Out of people who lived in different counties, 50% lived in Louisiana.
93% of the 70003 zip code residents lived in the same house 1 year ago. Out of people who lived in different houses, 38% moved from this county. Out of people who lived in different houses, 41% moved from different county within same state. Out of people who lived in different houses, 13% moved from different state. Out of people who lived in different houses, 11% moved from abroad.
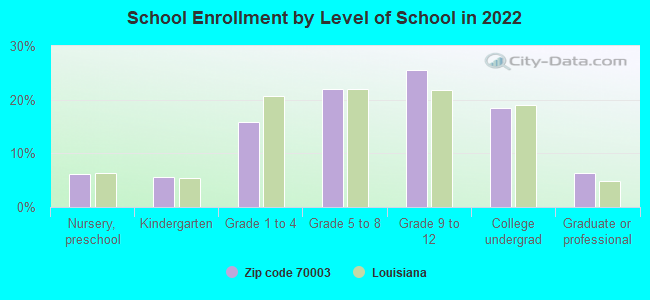
Private vs. public school enrollment:
Students in private schools in grades 1 to 8 (elementary and middle school): 1,133
Here:
38.2%
Louisiana:
19.6%
Students in private schools in grades 9 to 12 (high school): 1,051
Here:
53.0%
Louisiana:
18.3%
Students in private undergraduate colleges: 464
Here:
32.2%
Louisiana:
17.4%
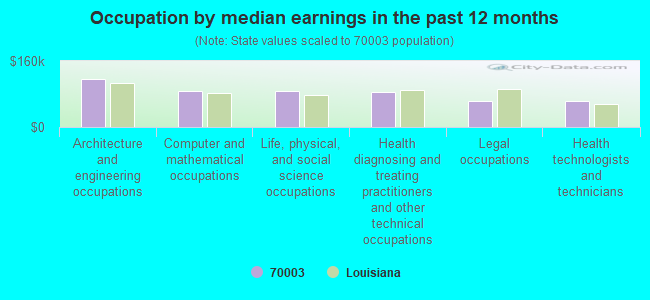
Occupation by median earnings in the past 12 months ($)
116,751Architecture and engineering occupations
88,295Computer and mathematical occupations
88,015Life, physical, and social science occupations
83,696Health diagnosing and treating practitioners and other technical occupations
63,154Legal occupations
62,865Health technologists and technicians
Companies with federal contracts located in this zip code (METAIRIE, LA):
LITTORAL RESEARCH GROUP, LLC (3517 PAGE DR; small business) : $856,100 in 5 contractsfrom 2003 to 2005
Contracts for Other Defense -- Operational Systems Development (R&D), Other Defense -- Basic Research (R&D), Defense Ships -- Basic Research (R&D) by Navy Signed by year:2000: $0; 2001: $0; 2002: $0; 2003: $139,462; 2004: $99,638; 2005: $617,000; 2006: $0.
Biggest contracts:
$617,000 with Navy for Other Defense -- Operational Systems Development (R&D). Signed on 2005-09-20. Completion date: 2007-09-19.
$69,793 with Navy for Other Defense -- Basic Research (R&D). Signed on 2004-05-13. Completion date: 2004-11-13.
$69,747 with Navy for Defense Ships -- Basic Research (R&D). Signed on 2003-08-11. Completion date: 2004-02-11.
$69,715 with Navy for Other Defense -- Operational Systems Development (R&D). Signed on 2003-07-01. Completion date: 2004-03-31.
COMPUSA INC (8855 VETERANS MEMORIAL BLV; small business)
$22,105 with Army for ADP Input/Output and Storage Devices. Signed on 2005-01-05. Completion date: 2005-01-14.
GULF INSTRUMENT SERVICE INC (6613 AIRLINE DR; small business)
$9,510 with Army for Sets, Kits, and Outfits of Measuring Tools. Signed on 2003-02-27. Completion date: 2003-03-03.
TRANS-AD, INC (6800 GILLEN ST; small business)
$6,570 with Army for Advertising Services. Signed on 2005-05-26. Completion date: 2005-06-01.
COASTAL ERECTION COMPANY INC (1028 MARKET ST; small business)
$2,718 with Army for Other Housekeeping Services. Signed on 2006-06-20. Completion date: 2006-05-19.
Top industries in this zip code by the number of employees in 2005:
2002 - 2018 National Fire Incident Reporting System (NFIRS) incidents
According to the data from the years 2002 - 2018 the average number of fires per year is 66. The highest number of reported fires - 100 took place in 2013, and the least - 21 in 2008. The data has an increasing trend.
When looking into fire subcategories, the most reports belonged to: Structure Fires (37.7%), and Outside Fires (35.2%).
Fire incident types reported to NFIRS in Zip Code 70003


 Nearest zip codes: 70006, 70001, 70002, 70062, 70065, 70123.


 According to the data from the years 2002 - 2018 the average number of fires per year is 66. The highest number of reported fires - 100 took place in 2013, and the least - 21 in 2008. The data has an increasing trend.
 When looking into fire subcategories, the most reports belonged to: Structure Fires (37.7%), and Outside Fires (35.2%).