Estimated zip code population in 2022: 8,050 Zip code population in 2010: 10,232 Zip code population in 2000: 9,551
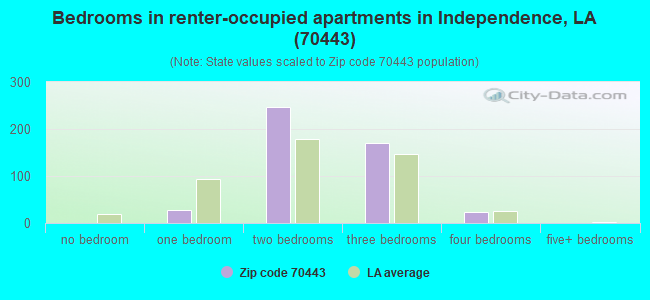
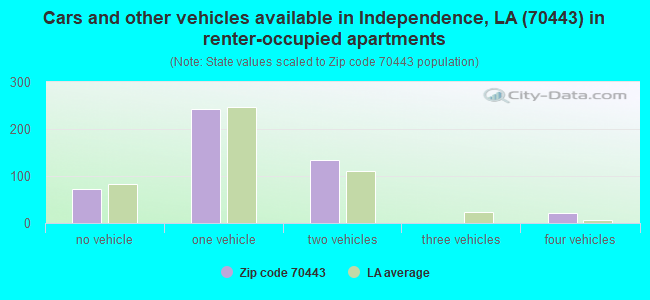
Houses and condos: 3,281 Renter-occupied apartments: 469
% of renters here:
17%
State:
32%
March 2022 cost of living index in zip code 70443: 80.8 (low, U.S. average is 100)
Land area: 77.1 sq. mi. Water area: 0.6 sq. mi.
Population density: 104 people per square mile
(very low).
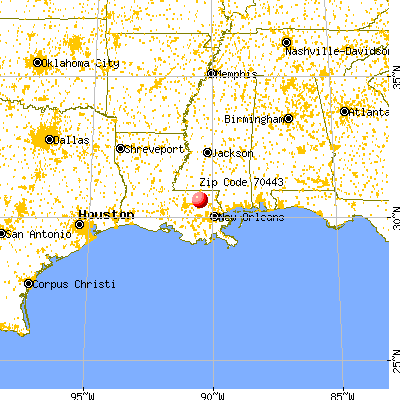
OSM Map
General Map
Google Map
MSN Map
OSM Map
General Map
Google Map
MSN Map
OSM Map
General Map
Google Map
MSN Map
OSM Map
General Map
Google Map
MSN Map
Please wait while loading the map...
Real estate property taxes paid for housing units in 2022:
This zip code:
0.4% ($662)
Louisiana:
0.5% ($1,127)
Median real estate property taxes paid for housing units with mortgages in 2022: $794 (0.4%) Median real estate property taxes paid for housing units with no mortgage in 2022: $207 (0.2%)
Business Search- 14 Million verified businesses
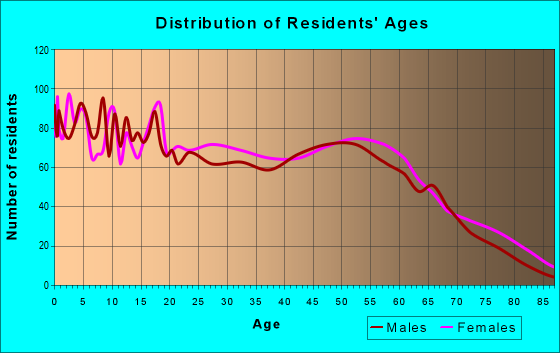
Males: 3,700
(46.0%)
Females: 4,351
(54.0%)
For population 25 years and over in 70443:
High school or higher: 74.9%
Bachelor's degree or higher: 17.3%
Graduate or professional degree: 5.6%
Unemployed: 11.0%
Mean travel time to work (commute): 30.8 minutes
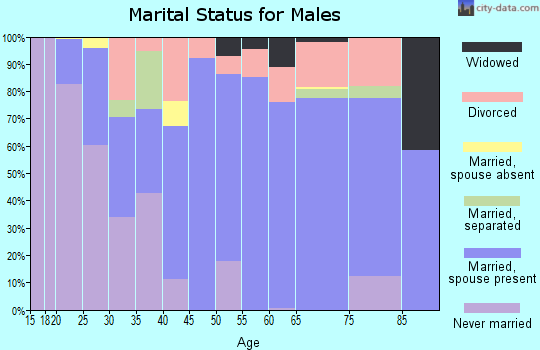
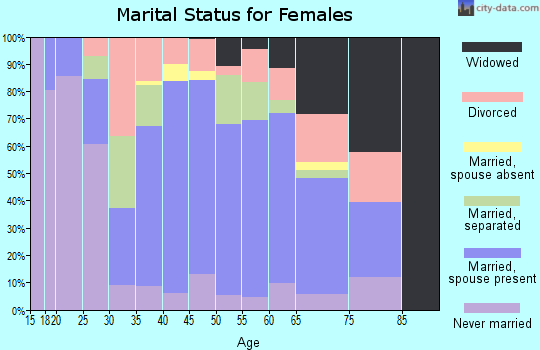
For population 15 years and over in 70443:
Never married: 32.5%
Now married: 49.2%
Separated: 0.6%
Widowed: 5.4%
Divorced: 12.3%
Zip code 70443 compared to state average:
Unemployed percentage above state average.
Renting percentage below state average.
Percentage of population with a bachelor's degree or higher below state average.
Averages for the 2020 tax year for zip code 70443, filed in 2021:
Average Adjusted Gross Income (AGI) in 2020: $45,838 (Individual Income Tax Returns)
Here:
$45,838
State:
$60,757
Salary/wage: $40,810 (reported on 83.0% of returns)
Here:
$40,810
State:
$50,882
(% of AGI for various income ranges: 1114.9% for AGIs below $25k, 3725.6% for AGIs $25k-50k, 7168.9% for AGIs $50k-75k, 11067.8% for AGIs $75k-100k, 15446.2% for AGIs $100k-200k)
Taxable interest for individuals: $1,259 (reported on 15.2% of returns)
This zip code:
$1,259
Louisiana:
$1,576
(% of AGI for various income ranges: 4.7% for AGIs below $25k, 9.1% for AGIs $25k-50k, 25.7% for AGIs $50k-75k, 44.4% for AGIs $75k-100k, 144.6% for AGIs $100k-200k)
Ordinary dividends: $2,253 (reported on 6.9% of returns)
Here:
$2,253
State:
$7,743
(% of AGI for various income ranges: 5.5% for AGIs below $25k, 5.2% for AGIs $25k-50k, 20.8% for AGIs $50k-75k, 47.2% for AGIs $75k-100k, 113.8% for AGIs $100k-200k)
Net capital gain/loss in AGI: +$8,330 (reported on 6.9% of returns)
Here:
+$8,330
State:
+$16,917
(% of AGI for various income ranges: 4.4% for AGIs $25k-50k, 39.2% for AGIs $50k-75k, 32.8% for AGIs $75k-100k, 350.8% for AGIs $100k-200k)
Profit/loss from business: +$2,787 (reported on 23.0% of returns)
Here:
+$2,787
State:
+$7,679
(% of AGI for various income ranges: 96.6% for AGIs below $25k, 13.8% for AGIs $50k-75k, 172.8% for AGIs $75k-100k, 474.2% for AGIs $100k-200k)
Taxable individual retirement arrangement distribution: $14,000 (reported on 4.1% of returns)
70443:
$14,000
Louisiana:
$20,716
(% of AGI for various income ranges: 10.4% for AGIs below $25k, 42.4% for AGIs $25k-50k, 91.9% for AGIs $50k-75k, 315.6% for AGIs $75k-100k, 427.9% for AGIs $100k-200k)
Total itemized deductions: $31,600 (reported on 2.8% of returns)
Here:
$31,600
State:
$36,265
(% of AGI for various income ranges: 70.4% for AGIs $25k-50k, 328.4% for AGIs $50k-75k, 783.3% for AGIs $100k-200k)
Charity contributions: $10,789 (reported on 2.1% of returns)
Here:
$10,789
State:
$13,106
(% of AGI for various income ranges: 8.3% for AGIs below $25k, 79.5% for AGIs $50k-75k, 227.1% for AGIs $100k-200k)
Taxes paid: $5,000 (reported on 2.8% of returns)
70443:
$5,000
State:
$6,643
(% of AGI for various income ranges: 6.0% for AGIs $25k-50k, 42.2% for AGIs $50k-75k, 160.4% for AGIs $100k-200k)
Earned income credit: $2,959 (reported on 34.3% of returns)
Here:
$2,959
State:
$2,671
(% of AGI for various income ranges: 206.5% for AGIs below $25k, 113.6% for AGIs $25k-50k)
Percentage of individuals using paid preparers for their 2020 taxes: 93.1%
Here:
93%
State:
92%
(% for various income ranges: 93.3% for AGIs below $25k, 93.4% for AGIs $25k-50k, 92.3% for AGIs $50k-75k, 92.9% for AGIs $75k-100k, 91.4% for AGIs $100k-200k, 100.0% for AGIs over 200k)
Averages for the 2012 tax year for zip code 70443, filed in 2013:
Average Adjusted Gross Income (AGI) in 2012: $38,159 (Individual Income Tax Returns)
Here:
$38,159
State:
$56,730
Salary/wage: $35,848 (reported on 86.8% of returns)
Here:
$35,848
State:
$45,545
(% of AGI for various income ranges: 86.0% for AGIs below $25k, 87.5% for AGIs $25k-50k, 85.0% for AGIs $50k-75k, 79.1% for AGIs $75k-100k, 80.9% for AGIs $100k-200k, 48.9% for AGIs over 200k)
Taxable interest for individuals: $1,208 (reported on 17.3% of returns)
This zip code:
$1,208
Louisiana:
$1,804
(% of AGI for various income ranges: 0.5% for AGIs below $25k, 0.3% for AGIs $25k-50k, 0.3% for AGIs $50k-75k, 0.8% for AGIs $75k-100k, 0.8% for AGIs $100k-200k, 0.8% for AGIs over 200k)
Ordinary dividends: $1,784 (reported on 7.7% of returns)
Here:
$1,784
State:
$7,610
(% of AGI for various income ranges: 0.4% for AGIs below $25k, 0.1% for AGIs $25k-50k, 0.2% for AGIs $50k-75k, 0.6% for AGIs $75k-100k, 0.6% for AGIs $100k-200k)
Net capital gain/loss in AGI: +$4,073 (reported on 5.3% of returns)
Here:
+$4,073
State:
+$17,096
(% of AGI for various income ranges: 0.3% for AGIs $50k-75k, 0.3% for AGIs $75k-100k, 2.5% for AGIs $100k-200k)
Profit/loss from business: +$3,816 (reported on 19.7% of returns)
Here:
+$3,816
State:
+$12,088
(% of AGI for various income ranges: 5.2% for AGIs below $25k, 1.1% for AGIs $50k-75k, 2.5% for AGIs $75k-100k, 2.5% for AGIs $100k-200k)
Taxable individual retirement arrangement distribution: $11,437 (reported on 4.6% of returns)
70443:
$11,437
Louisiana:
$16,085
(% of AGI for various income ranges: 0.7% for AGIs below $25k, 1.2% for AGIs $25k-50k, 1.4% for AGIs $50k-75k, 2.4% for AGIs $75k-100k, 1.9% for AGIs $100k-200k)
Total itemized deductions: $20,019 (27% of AGI, reported on 20.7% of returns)
Here:
$20,019
State:
$23,585
Here:
26.7% of AGI
State:
18.1% of AGI
(% of AGI for various income ranges: 6.2% for AGIs below $25k, 11.4% for AGIs $25k-50k, 13.5% for AGIs $50k-75k, 11.4% for AGIs $75k-100k, 12.0% for AGIs $100k-200k, 9.6% for AGIs over 200k)
Charity contributions: $4,319 (reported on 13.7% of returns)
Here:
$4,319
State:
$5,533
(% of AGI for various income ranges: 0.6% for AGIs below $25k, 1.4% for AGIs $25k-50k, 1.8% for AGIs $50k-75k, 1.6% for AGIs $75k-100k, 1.9% for AGIs $100k-200k, 2.9% for AGIs over 200k)
Taxes paid: $3,096 (reported on 20.4% of returns)
70443:
$3,096
State:
$6,282
(% of AGI for various income ranges: 0.5% for AGIs below $25k, 1.1% for AGIs $25k-50k, 1.7% for AGIs $50k-75k, 1.8% for AGIs $75k-100k, 2.7% for AGIs $100k-200k, 3.3% for AGIs over 200k)
Earned income credit: $2,979 (reported on 38.2% of returns)
Here:
$2,979
State:
$2,633
(% of AGI for various income ranges: 14.9% for AGIs below $25k, 1.6% for AGIs $25k-50k)
Percentage of individuals using paid preparers for their 2012 taxes: 66.1%
Here:
66%
State:
57%
(% for various income ranges: 64.8% for AGIs below $25k, 63.7% for AGIs $25k-50k, 69.6% for AGIs $50k-75k, 70.4% for AGIs $75k-100k, 72.0% for AGIs $100k-200k, 100.0% for AGIs over 200k)
Averages for the 2004 tax year for zip code 70443, filed in 2005:
Average Adjusted Gross Income (AGI) in 2004: $28,711 (Individual Income Tax Returns)
Here:
$28,711
State:
$39,411
Salary/wage: $27,037 (reported on 88.7% of returns)
Here:
$27,037
State:
$34,434
(% of AGI for various income ranges: 89.3% for AGIs below $10k, 83.6% for AGIs $10k-25k, 88.6% for AGIs $25k-50k, 86.9% for AGIs $50k-75k, 86.2% for AGIs $75k-100k, 60.7% for AGIs over 100k)
Taxable interest for individuals: $1,273 (reported on 23.8% of returns)
This zip code:
$1,273
Louisiana:
$1,606
(% of AGI for various income ranges: 1.3% for AGIs below $10k, 1.0% for AGIs $10k-25k, 0.9% for AGIs $25k-50k, 0.9% for AGIs $50k-75k, 1.2% for AGIs $75k-100k, 1.5% for AGIs over 100k)
Taxable dividends: $818 (reported on 9.2% of returns)
Here:
$818
State:
$3,235
(% of AGI for various income ranges: 0.3% for AGIs below $10k, 0.1% for AGIs $10k-25k, 0.2% for AGIs $25k-50k, 0.2% for AGIs $50k-75k, 0.3% for AGIs $75k-100k, 0.9% for AGIs over 100k)
Net capital gain/loss: +$2,300 (reported on 6.5% of returns)
Here:
+$2,300
State:
+$8,531
(% of AGI for various income ranges: -0.6% for AGIs below $10k, 0.0% for AGIs $10k-25k, 0.1% for AGIs $25k-50k, 0.5% for AGIs $50k-75k, 1.4% for AGIs $75k-100k, 1.9% for AGIs over 100k)
Profit/loss from business: +$3,606 (reported on 16.0% of returns)
Here:
+$3,606
State:
+$9,128
(% of AGI for various income ranges: 10.1% for AGIs below $10k, 4.1% for AGIs $10k-25k, 0.5% for AGIs $25k-50k, 1.0% for AGIs $50k-75k, -0.3% for AGIs $75k-100k, 3.4% for AGIs over 100k)
IRA payment deduction: $2,982 (reported on 1.5% of returns)
70443:
$2,982
Louisiana:
$3,055
(% of AGI for various income ranges: 0.1% for AGIs $10k-25k, 0.1% for AGIs $25k-50k, 0.2% for AGIs $50k-75k, 0.5% for AGIs $75k-100k)
Total itemized deductions: $17,431 (29% of AGI, reported on 17.5% of returns)
Here:
$17,431
State:
$18,222
Here:
29.2% of AGI
State:
20.3% of AGI
(% of AGI for various income ranges: 4.8% for AGIs $10k-25k, 12.9% for AGIs $25k-50k, 12.5% for AGIs $50k-75k, 14.6% for AGIs $75k-100k, 11.2% for AGIs over 100k)
Charity contributions deductions: $3,445 (6% of AGI, reported on 14.5% of returns)
Here:
$3,445
State:
$4,190
Here:
5.5% of AGI
State:
4.4% of AGI
(% of AGI for various income ranges: 0.6% for AGIs $10k-25k, 2.0% for AGIs $25k-50k, 2.0% for AGIs $50k-75k, 2.0% for AGIs $75k-100k, 3.0% for AGIs over 100k)
Total tax: $3,416 (reported on 59.4% of returns)
70443:
$3,416
State:
$6,529
(% of AGI for various income ranges: 2.8% for AGIs below $10k, 2.7% for AGIs $10k-25k, 4.8% for AGIs $25k-50k, 7.7% for AGIs $50k-75k, 10.3% for AGIs $75k-100k, 17.0% for AGIs over 100k)
Earned income credit: $2,355 (reported on 38.8% of returns)
Here:
$2,355
State:
$2,103
Percentage of individuals using paid preparers for their 2004 taxes: 67.9%
Here:
68%
State:
61%
(% for various income ranges: 65.4% for AGIs below $10k, 69.8% for AGIs $10k-25k, 64.9% for AGIs $25k-50k, 69.5% for AGIs $50k-75k, 74.5% for AGIs $75k-100k, 75.9% for AGIs over 100k)
Household received Food Stamps/SNAP in the past 12 months: 703 Household did not receive Food Stamps/SNAP in the past 12 months: 2,023
Women who had a birth in the past 12 months: 71 (22 now married, 50 unmarried) Women who did not have a birth in the past 12 months: 2,058 (1,005 now married, 1,045 unmarried)
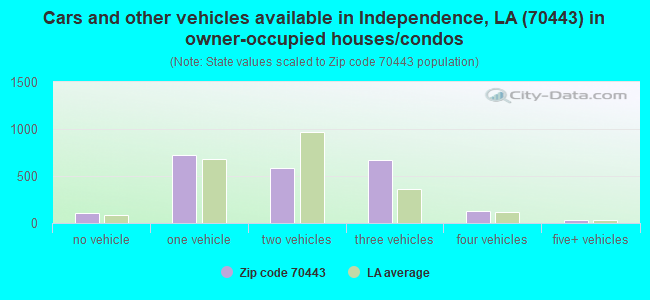
Housing units in zip code 70443 with a mortgage: 1,121 (114 second mortgage, 78 home equity loan, 43 both second mortgage and home equity loan) Median monthly owner costs for units with a mortgage: $1,353 Median monthly owner costs for units without a mortgage: $300
Residents with income below the poverty level in 2022:
This zip code:
22.4%
Whole state:
18.6%
Residents with income below 50% of the poverty level in 2022:
This zip code:
13.4%
Whole state:
10.1%
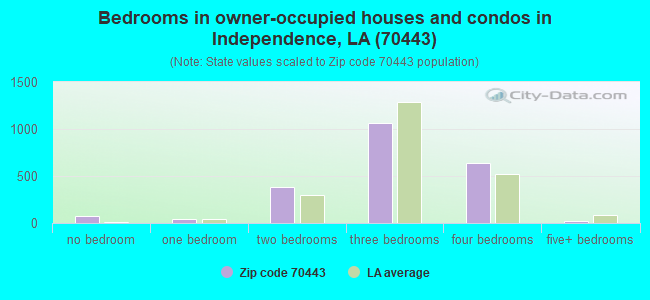
Median number of rooms in houses and condos:
Here:
6.0
State:
6.2
Median number of rooms in apartments:
Here:
4.5
State:
4.4
Notable locations in this zip code not listed on our city pages
Notable locations in zip code 70443: Apostolic Camp Grounds (A), Tangipahoa Septic Tank Sludge Treatment Facility (B), Independence Sewage Treatment Plant (C), Independence Police Department (D), Independence Police Department - Chief (E), Livingston Parish Fire Protection District 11 (F), Independence Fire Department (G), Independence Fire Department Station 2 (H). Display/hide their locations on the map
Churches in zip code 70443 include: Friendly Faith Tabernacle Church (A), First Baptist Church (B), Faith Temple Ministries Church of God in Christ (C), Christ Anointed Ministries (D), Zion Hill Baptist Church (E), Oak Grove Church of God (F), New Hope Baptist Church (G), Mount Olive Baptist Church (H), Mount Calvary Baptist Church (I). Display/hide their locations on the map
Cemeteries: Baham Cemetery (1), Bankston Cemetery (2), Barnett Cemetery (3), Myra Cemetery (4), Natalbany Cemetery (5), Warren Cemetery (6), Bennett Cemetery (7). Display/hide their locations on the map
Streams, rivers, and creeks: Davis Branch (A), Crooked Creek (B), Killian Branch (C), Spring Branch (D), Scott Creek (E), Morgan Branch (F), Sweetwater Creek (G). Display/hide their locations on the map
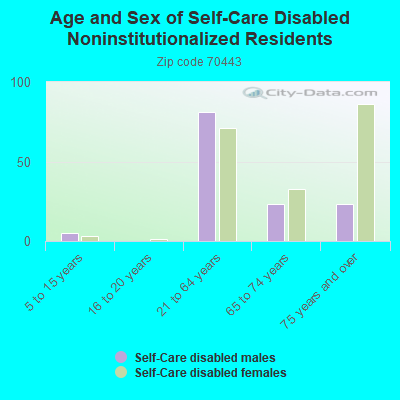
In group quarters: 6 (-1 institutionalized population)
Size of family households: 791 2-persons, 446 3-persons, 507 4-persons, 91 5-persons, 28 6-persons, 82 7-or-more-persons
Size of nonfamily households: 595 1-person, 112 2-persons, 27 3-persons
1,022 married couples with children.
708 single-parent households (113 men, 595 women).
95.1% of residents of 70443 zip code speak English at home.
4.4% of residents speak Spanish at home (25% very well, 2% well, 6% not well, 67% not at all).
0.7% of residents speak other Indo-European language at home (85% very well, 15% well).
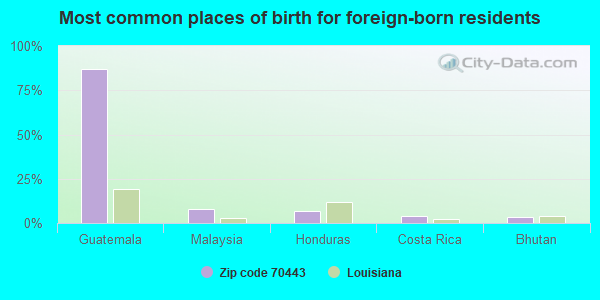
Foreign born population: 241 (3.0%) (9.8% of them are naturalized citizens)
This zip code:
3.0%
Whole state:
4.2%
87%Guatemala
8%Malaysia
7%Honduras
4%Costa Rica
3%Bhutan
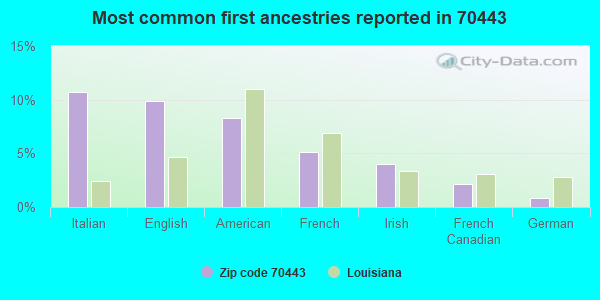
11%Italian
10%English
8%American
5%French
4%Irish
2%French Canadian
1%German
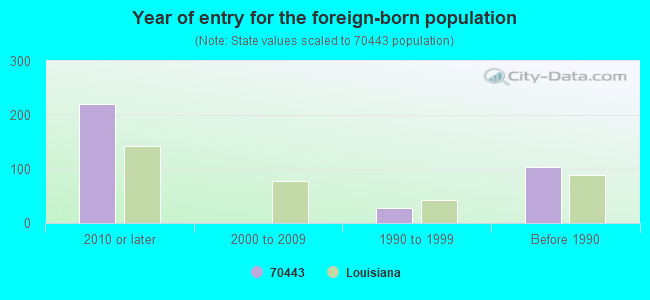
Year of entry for the foreign-born population
2212010 or later
02000 to 2009
281990 to 1999
103Before 1990
Facilities with environmental interests located in this zip code:
BRICKYARD APARTMENTS (13074 BRICKYARD RD in INDEPENDENCE, LA)
National Pollutant Discharge Elimination System NON-MAJOR (Tracking pollutant discharge elimination systems) - permit Business SIC classification: SEWERAGE SYSTEMS
PALMS PARK (55147 MASHON ROAD in INDEPENDENCE, LA)
National Pollutant Discharge Elimination System NON-MAJOR (Tracking pollutant discharge elimination systems) - permit Business SIC classification: SEWERAGE SYSTEMS
RALPH N. HARPER DAIRY (18047 LA HWY 442 in INDEPENDENCE, LA)
National Pollutant Discharge Elimination System NON-MAJOR (Tracking pollutant discharge elimination systems) - permit
DWAYNE PULS DAIRY (52275 PULS ROAD in INDEPENDENCE, LA)
National Pollutant Discharge Elimination System NON-MAJOR (Tracking pollutant discharge elimination systems) - permit
EARL CHAMBERS DAIRY (16453 HWY 40 in INDEPENDENCE, LA)
National Pollutant Discharge Elimination System NON-MAJOR (Tracking pollutant discharge elimination systems) - permit
FRANKIE'S BODY SHOP (11096 HWY 40 WEST in INDEPENDENCE, LA)
National Pollutant Discharge Elimination System NON-MAJOR (Tracking pollutant discharge elimination systems) - permit
FINCH AUTO RPR (51532 FINCH LN in INDEPENDENCE, LA)
Conditionally Exempt Small Quantity Generators, less than 100 kg/month of hazardous waste (Resource Conservation and Recovery Act (tracking hazardous waste)) - notification Business NAICS classification: GENERAL AUTOMOTIVE REPAIR. Organizations: JOHN R FINCH III (CONTACT/OWNER)
Housing units lacking complete plumbing facilities: 10.4% Housing units lacking complete kitchen facilities: 8.7%
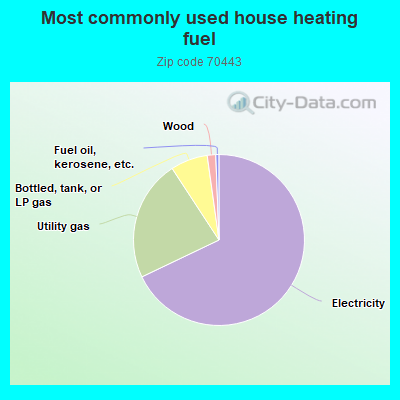
67.7%Electricity
22.8%Utility gas
7.0%Bottled, tank, or LP gas
1.6%Wood
0.6%Fuel oil, kerosene, etc.
Population in 1990: 4,330. Population change in the 1990s: +5,221 (+120.6%).
Place of birth for U.S.-born residents:
This state: 6,441
Northeast: 63
Midwest: 277
South: 729
West: 182
67% of the 70443 zip code residents lived in the same house 5 years ago. Out of people who lived in different houses, 55% lived in this county. Out of people who lived in different counties, 50% lived in Louisiana.
96% of the 70443 zip code residents lived in the same house 1 year ago. Out of people who lived in different houses, 72% moved from this county. Out of people who lived in different houses, 17% moved from different county within same state. Out of people who lived in different houses, 16% moved from different state.
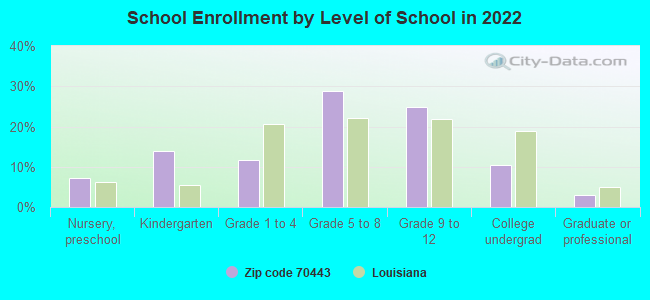
Private vs. public school enrollment:
Students in private schools in grades 1 to 8 (elementary and middle school): 122
Here:
15.9%
Louisiana:
19.6%
Students in private schools in grades 9 to 12 (high school): 67
Here:
14.2%
Louisiana:
18.3%
Students in private undergraduate colleges: 90
Here:
45.7%
Louisiana:
17.4%
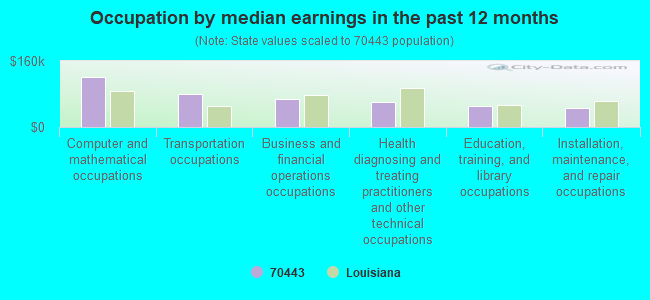
Occupation by median earnings in the past 12 months ($)
121,944Computer and mathematical occupations
78,792Transportation occupations
67,884Business and financial operations occupations
60,014Health diagnosing and treating practitioners and other technical occupations
50,458Education, training, and library occupations
46,721Installation, maintenance, and repair occupations
Companies with federal contracts located in this zip code:
MCELWEE BROTHERS, INC (14150 REV JOSEPH WHITE RO in INDEPENDENCE, LA; small business) : $5,620,200 in 29 contractsfrom 2001 to 2005
Contracts for Construction of Structures and Facilities -- Other Non-Building Facilities by U.S. Army Corps of Engineers - civil program financing only, Army Signed by year:2000: $0; 2001: $2,555,000; 2002: $335,000; 2003: $1,621,742; 2004: $1,033,150; 2005: $75,308; 2006: $0.
Biggest contracts:
$1,263,000 with U.S. Army Corps of Engineers - civil program financing only for Construction of Structures and Facilities -- Other Non-Building Facilities. Signed on 2001-12-21. Completion date: 2002-06-25.
$869,876 with Army for Construction of Structures and Facilities -- Other Non-Building Facilities. Signed on 2004-10-13. Completion date: 2002-06-25.
$355,000 with U.S. Army Corps of Engineers - civil program financing only for Construction of Structures and Facilities -- Other Non-Building Facilities. Signed on 2001-09-19. Completion date: 2002-06-25.
$350,000, same as above.Signed on 2003-01-30. Completion date: 2002-06-25.
AMERICAN DIESEL POWER PRODUCTS (54020 DIMATTIA LANE in INDEPENDENCE, LA) : $884,704 in 29 contractsfrom 2001 to 2006
Contracts for Diesel Engines and Components, Miscellaneous Engine Accessories, Nonaircraft, Miscellaneous Engines and Components, Motor Vehicle Maintenance and Repair Shop Specialized Equipment, and moreby Navy, Army, Air Force, U.S. Army Corps of Engineers - civil program financing only, and others Signed by year:2000: $0; 2001: $58,240; 2002: $0; 2003: $75,951; 2004: $512,859; 2005: $190,927; 2006: $46,727.
Biggest contracts:
$158,400 with Navy for Diesel Engines and Components. Taking place in GA. Signed on 2004-09-27. Completion date: 2004-09-27.
$119,750 with Navy for Miscellaneous Engine Accessories, Nonaircraft. Signed on 2005-06-21. Completion date: 2005-11-30.
$113,715 with Army for Miscellaneous Engines and Components. Taking place in TN. Signed on 2004-04-15. Completion date: 2004-05-26.
$99,750 with Navy for Miscellaneous Engine Accessories, Nonaircraft. Signed on 2004-12-03. Completion date: 2004-11-15.
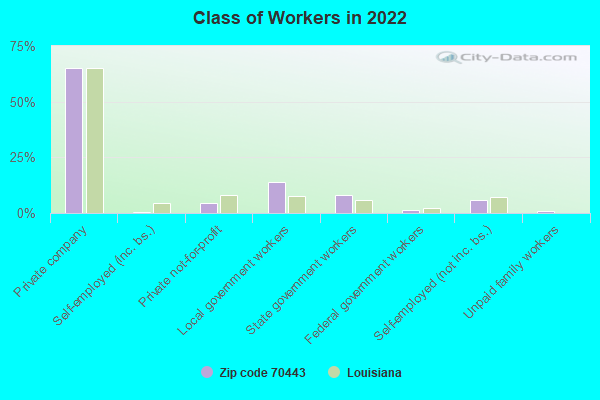
Top industries in this zip code by the number of employees in 2005:
Health Care and Social Assistance: General Medical and Surgical Hospitals (250-499 employees: 1 establishment)
Health Care and Social Assistance: Child Day Care Services (20-49: 1, 5-9: 1, 1-4: 1)
Construction: Commercial and Institutional Building Construction (10-19: 2, 5-9: 1)
Health Care and Social Assistance: Services for the Elderly and Persons with Disabilities (20-49: 1)
Accommodation and Food Services: Limited-Service Restaurants (5-9: 3, 1-4: 1)
People in group quarters in 2000:
35 people in agriculture workers' dormitories on farms
34 people in wards in general hospitals for patients who have no usual home elsewhere
9 people in religious group quarters
Fatal accident statistics in 2014:
Fatal accident count: 4
Vehicles involved in fatal accidents: 5
Fatal accidents caused by drunken drivers: 1
Fatalities: 4
Persons involved in fatal accidents: 7
Pedestrians involved in fatal accidents: 0
Fatal accident statistics in 2012:
Fatal accident count: 2
Vehicles involved in fatal accidents: 2
Fatal accidents caused by drunken drivers: 0
Fatalities: 2
Persons involved in fatal accidents: 2
Pedestrians involved in fatal accidents: 1
Home Mortgage Disclosure Act Aggregated Statistics For Year 2009 (Based on 4 partial tracts)
A) FHA, FSA/RHS & VA Home Purchase Loans
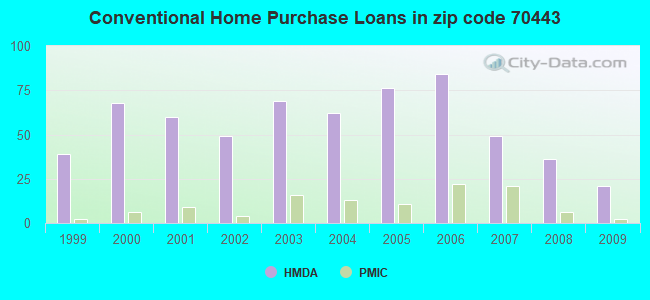
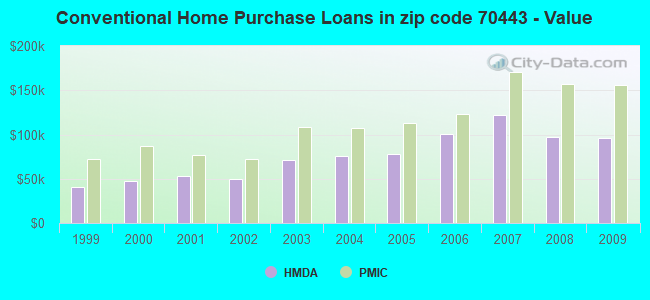
B) Conventional Home Purchase Loans
C) Refinancings
D) Home Improvement Loans
E) Loans on Dwellings For 5+ Families
F) Non-occupant Loans on < 5 Family Dwellings (A B C & D)
G) Loans On Manufactured Home Dwelling (A B C & D)
Number
Average Value
Number
Average Value
Number
Average Value
Number
Average Value
Number
Average Value
Number
Average Value
Number
Average Value
LOANS ORIGINATED
20
$137,190
21
$95,880
82
$134,754
22
$38,535
0
$0
6
$56,192
21
$44,473
APPLICATIONS APPROVED, NOT ACCEPTED
1
$86,820
7
$87,897
7
$111,689
2
$47,655
0
$0
2
$52,940
5
$73,178
APPLICATIONS DENIED
4
$157,678
21
$86,651
55
$138,790
11
$36,535
1
$179,050
1
$71,700
27
$58,284
APPLICATIONS WITHDRAWN
1
$207,340
4
$97,070
21
$163,715
4
$135,428
0
$0
2
$50,415
2
$120,905
FILES CLOSED FOR INCOMPLETENESS
3
$145,640
4
$140,892
12
$138,938
2
$88,350
0
$0
0
$0
3
$76,160
Aggregated Statistics For Year 2008 (Based on 4 partial tracts)
A) FHA, FSA/RHS & VA Home Purchase Loans
B) Conventional Home Purchase Loans
C) Refinancings
D) Home Improvement Loans
E) Loans on Dwellings For 5+ Families
F) Non-occupant Loans on < 5 Family Dwellings (A B C & D)
G) Loans On Manufactured Home Dwelling (A B C & D)
Number
Average Value
Number
Average Value
Number
Average Value
Number
Average Value
Number
Average Value
Number
Average Value
Number
Average Value
LOANS ORIGINATED
22
$135,108
36
$96,613
74
$138,664
20
$19,385
0
$0
7
$91,564
28
$50,247
APPLICATIONS APPROVED, NOT ACCEPTED
2
$104,360
9
$59,249
9
$143,736
2
$74,400
1
$489,420
0
$0
12
$58,932
APPLICATIONS DENIED
9
$150,529
35
$63,474
67
$136,608
24
$47,639
0
$0
5
$89,134
39
$54,596
APPLICATIONS WITHDRAWN
6
$165,097
7
$95,817
17
$162,181
1
$6,110
0
$0
1
$80,320
1
$39,520
FILES CLOSED FOR INCOMPLETENESS
0
$0
2
$67,740
4
$146,522
1
$102,660
0
$0
0
$0
2
$57,680
Aggregated Statistics For Year 2007 (Based on 4 partial tracts)
A) FHA, FSA/RHS & VA Home Purchase Loans
B) Conventional Home Purchase Loans
C) Refinancings
D) Home Improvement Loans
F) Non-occupant Loans on < 5 Family Dwellings (A B C & D)
G) Loans On Manufactured Home Dwelling (A B C & D)
Number
Average Value
Number
Average Value
Number
Average Value
Number
Average Value
Number
Average Value
Number
Average Value
LOANS ORIGINATED
17
$131,139
49
$121,753
85
$119,807
31
$50,693
11
$66,508
37
$56,655
APPLICATIONS APPROVED, NOT ACCEPTED
1
$80,890
21
$71,699
22
$137,691
6
$26,788
0
$0
18
$65,969
APPLICATIONS DENIED
2
$132,150
38
$73,514
64
$117,113
33
$58,708
3
$26,490
43
$61,949
APPLICATIONS WITHDRAWN
1
$120,050
6
$91,183
22
$113,543
2
$111,865
2
$64,750
4
$65,427
FILES CLOSED FOR INCOMPLETENESS
1
$100,050
0
$0
8
$123,706
1
$153,630
0
$0
1
$100,550
Aggregated Statistics For Year 2006 (Based on 4 partial tracts)
A) FHA, FSA/RHS & VA Home Purchase Loans
B) Conventional Home Purchase Loans
C) Refinancings
D) Home Improvement Loans
F) Non-occupant Loans on < 5 Family Dwellings (A B C & D)
G) Loans On Manufactured Home Dwelling (A B C & D)
Number
Average Value
Number
Average Value
Number
Average Value
Number
Average Value
Number
Average Value
Number
Average Value
LOANS ORIGINATED
11
$105,945
84
$100,233
76
$103,308
34
$24,901
16
$80,559
37
$44,676
APPLICATIONS APPROVED, NOT ACCEPTED
3
$80,270
21
$73,260
17
$91,251
4
$22,962
1
$75,540
17
$43,656
APPLICATIONS DENIED
3
$69,547
47
$73,148
50
$97,727
27
$47,102
2
$128,625
40
$45,338
APPLICATIONS WITHDRAWN
2
$81,140
9
$80,410
31
$118,561
5
$72,306
0
$0
3
$90,853
FILES CLOSED FOR INCOMPLETENESS
0
$0
4
$99,250
12
$137,251
2
$116,185
0
$0
0
$0
Aggregated Statistics For Year 2005 (Based on 4 partial tracts)
A) FHA, FSA/RHS & VA Home Purchase Loans
B) Conventional Home Purchase Loans
C) Refinancings
D) Home Improvement Loans
E) Loans on Dwellings For 5+ Families
F) Non-occupant Loans on < 5 Family Dwellings (A B C & D)
G) Loans On Manufactured Home Dwelling (A B C & D)
Number
Average Value
Number
Average Value
Number
Average Value
Number
Average Value
Number
Average Value
Number
Average Value
Number
Average Value
LOANS ORIGINATED
18
$82,090
76
$77,942
95
$92,297
23
$73,667
1
$155,980
10
$71,500
43
$38,275
APPLICATIONS APPROVED, NOT ACCEPTED
2
$62,435
14
$81,179
19
$91,247
6
$28,018
0
$0
2
$82,510
9
$57,176
APPLICATIONS DENIED
6
$59,232
50
$60,074
80
$92,764
27
$22,139
0
$0
10
$66,925
55
$46,853
APPLICATIONS WITHDRAWN
1
$73,790
15
$91,916
52
$102,847
3
$117,833
0
$0
1
$103,320
4
$62,155
FILES CLOSED FOR INCOMPLETENESS
0
$0
3
$113,487
14
$82,686
1
$8,230
0
$0
1
$78,960
3
$75,600
Aggregated Statistics For Year 2004 (Based on 4 partial tracts)
A) FHA, FSA/RHS & VA Home Purchase Loans
B) Conventional Home Purchase Loans
C) Refinancings
D) Home Improvement Loans
F) Non-occupant Loans on < 5 Family Dwellings (A B C & D)
G) Loans On Manufactured Home Dwelling (A B C & D)
Number
Average Value
Number
Average Value
Number
Average Value
Number
Average Value
Number
Average Value
Number
Average Value
LOANS ORIGINATED
10
$98,988
62
$75,310
109
$87,804
23
$17,872
10
$29,814
34
$42,784
APPLICATIONS APPROVED, NOT ACCEPTED
1
$81,020
7
$68,763
39
$87,152
1
$59,460
2
$88,880
10
$51,939
APPLICATIONS DENIED
4
$80,440
39
$55,142
65
$77,508
17
$21,802
4
$55,995
35
$44,699
APPLICATIONS WITHDRAWN
0
$0
11
$84,742
51
$96,073
3
$47,313
2
$33,475
5
$53,870
FILES CLOSED FOR INCOMPLETENESS
0
$0
2
$75,535
18
$93,099
0
$0
1
$52,020
0
$0
Aggregated Statistics For Year 2003 (Based on 4 partial tracts)
A) FHA, FSA/RHS & VA Home Purchase Loans
B) Conventional Home Purchase Loans
C) Refinancings
D) Home Improvement Loans
F) Non-occupant Loans on < 5 Family Dwellings (A B C & D)
Number
Average Value
Number
Average Value
Number
Average Value
Number
Average Value
Number
Average Value
LOANS ORIGINATED
17
$82,465
69
$71,605
151
$78,724
24
$28,399
13
$65,056
APPLICATIONS APPROVED, NOT ACCEPTED
2
$41,350
26
$47,924
26
$64,243
5
$29,544
1
$40,970
APPLICATIONS DENIED
14
$45,613
99
$35,742
78
$69,508
26
$11,426
6
$33,798
APPLICATIONS WITHDRAWN
3
$114,890
9
$82,857
37
$97,928
3
$26,797
1
$60,250
FILES CLOSED FOR INCOMPLETENESS
0
$0
2
$91,800
20
$107,551
0
$0
1
$49,340
Aggregated Statistics For Year 2002 (Based on 4 partial tracts)
A) FHA, FSA/RHS & VA Home Purchase Loans
B) Conventional Home Purchase Loans
C) Refinancings
D) Home Improvement Loans
F) Non-occupant Loans on < 5 Family Dwellings (A B C & D)
Number
Average Value
Number
Average Value
Number
Average Value
Number
Average Value
Number
Average Value
LOANS ORIGINATED
22
$81,543
49
$49,310
123
$77,840
21
$32,397
7
$44,736
APPLICATIONS APPROVED, NOT ACCEPTED
6
$50,708
25
$38,670
29
$64,138
4
$25,090
2
$66,145
APPLICATIONS DENIED
11
$44,898
95
$38,789
59
$64,105
16
$6,708
3
$51,707
APPLICATIONS WITHDRAWN
0
$0
3
$76,963
35
$87,865
0
$0
2
$60,085
FILES CLOSED FOR INCOMPLETENESS
0
$0
2
$50,405
6
$118,233
0
$0
0
$0
Aggregated Statistics For Year 2001 (Based on 4 partial tracts)
A) FHA, FSA/RHS & VA Home Purchase Loans
B) Conventional Home Purchase Loans
C) Refinancings
D) Home Improvement Loans
E) Loans on Dwellings For 5+ Families
F) Non-occupant Loans on < 5 Family Dwellings (A B C & D)
Number
Average Value
Number
Average Value
Number
Average Value
Number
Average Value
Number
Average Value
Number
Average Value
LOANS ORIGINATED
6
$78,033
60
$53,396
122
$76,465
20
$19,822
1
$36,610
6
$48,957
APPLICATIONS APPROVED, NOT ACCEPTED
1
$33,420
32
$46,418
19
$58,417
2
$14,860
0
$0
2
$52,295
APPLICATIONS DENIED
3
$77,733
102
$38,912
72
$58,566
17
$10,670
0
$0
2
$27,385
APPLICATIONS WITHDRAWN
2
$85,480
10
$54,498
43
$64,102
4
$22,302
0
$0
1
$60,160
FILES CLOSED FOR INCOMPLETENESS
1
$71,620
1
$49,710
4
$56,892
1
$19,900
0
$0
0
$0
Aggregated Statistics For Year 2000 (Based on 4 partial tracts)
A) FHA, FSA/RHS & VA Home Purchase Loans
B) Conventional Home Purchase Loans
C) Refinancings
D) Home Improvement Loans
F) Non-occupant Loans on < 5 Family Dwellings (A B C & D)
Number
Average Value
Number
Average Value
Number
Average Value
Number
Average Value
Number
Average Value
LOANS ORIGINATED
10
$58,339
68
$46,986
64
$56,874
23
$13,481
9
$37,501
APPLICATIONS APPROVED, NOT ACCEPTED
12
$50,299
26
$41,900
35
$47,369
6
$15,802
1
$40,370
APPLICATIONS DENIED
17
$51,654
127
$35,457
87
$56,012
16
$17,151
8
$43,351
APPLICATIONS WITHDRAWN
5
$46,448
8
$68,442
56
$56,771
2
$32,110
0
$0
FILES CLOSED FOR INCOMPLETENESS
0
$0
0
$0
12
$59,763
0
$0
0
$0
Aggregated Statistics For Year 1999 (Based on 2 partial tracts)
A) FHA, FSA/RHS & VA Home Purchase Loans
B) Conventional Home Purchase Loans
C) Refinancings
D) Home Improvement Loans
F) Non-occupant Loans on < 5 Family Dwellings (A B C & D)
Detailed PMIC statistics for the following Tracts:0401.00
, 0402.00
2002 - 2018 National Fire Incident Reporting System (NFIRS) incidents
Based on the data from the years 2002 - 2018 the average number of fire incidents per year is 49. The highest number of fire incidents - 145 took place in 2011, and the least - 3 in 2008. The data has an increasing trend.
When looking into fire subcategories, the most incidents belonged to: Outside Fires (51.8%), and Structure Fires (36.2%).
Fire incident types reported to NFIRS in Zip Code 70443


 Nearest zip codes: 70466, 70451, 70422, 70711, 70401, 70402.
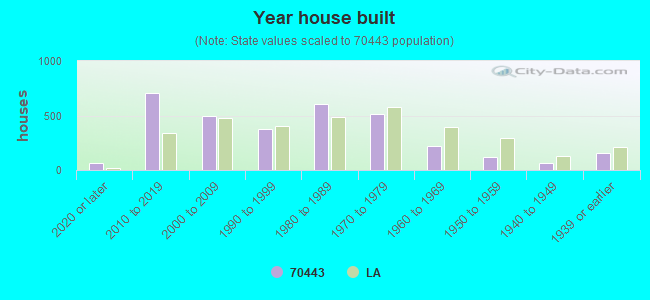


 Based on the data from the years 2002 - 2018 the average number of fire incidents per year is 49. The highest number of fire incidents - 145 took place in 2011, and the least - 3 in 2008. The data has an increasing trend.
 When looking into fire subcategories, the most incidents belonged to: Outside Fires (51.8%), and Structure Fires (36.2%).