Estimated zip code population in 2022: 20,162 Zip code population in 2010: 19,256 Zip code population in 2000: 16,810
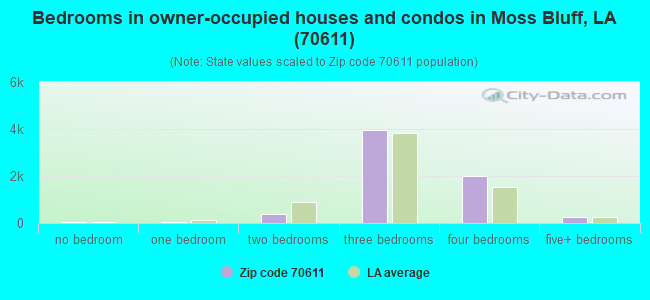
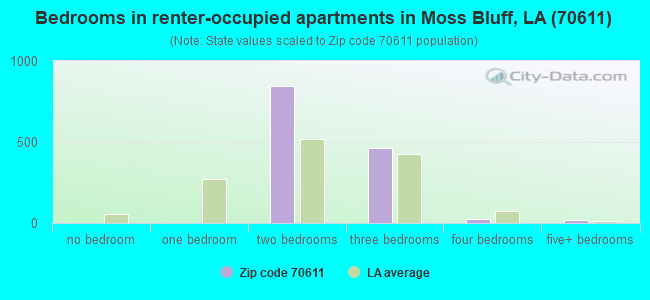
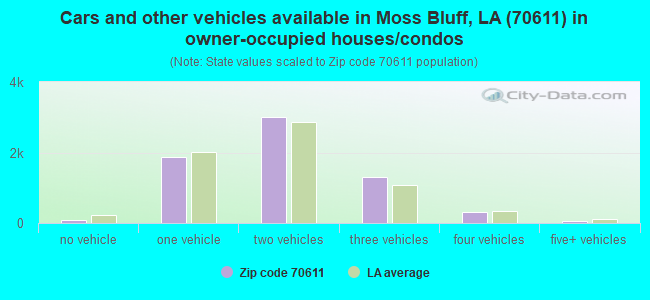
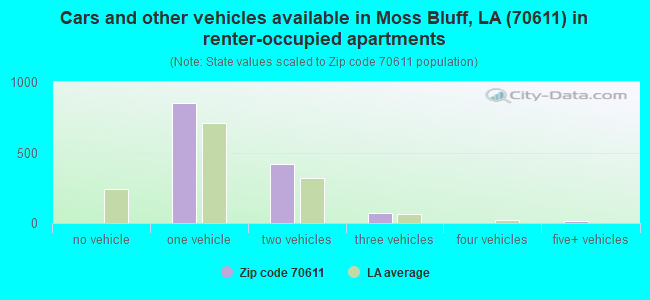
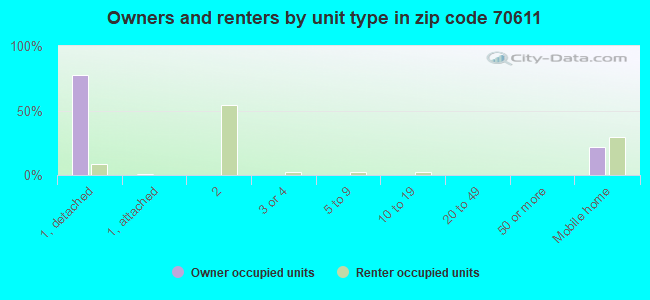
Houses and condos: 9,011 Renter-occupied apartments: 1,355
% of renters here:
17%
State:
32%
March 2022 cost of living index in zip code 70611: 85.6 (less than average, U.S. average is 100)
Land area: 81.8 sq. mi. Water area: 1.7 sq. mi.
Population density: 247 people per square mile
(very low).
OSM Map
General Map
Google Map
MSN Map
OSM Map
General Map
Google Map
MSN Map
OSM Map
General Map
Google Map
MSN Map
OSM Map
General Map
Google Map
MSN Map
Please wait while loading the map...
Real estate property taxes paid for housing units in 2022:
This zip code:
0.6% ($1,570)
Louisiana:
0.5% ($1,127)
Median real estate property taxes paid for housing units with mortgages in 2022: $1,742 (0.6%) Median real estate property taxes paid for housing units with no mortgage in 2022: $1,121 (0.5%)
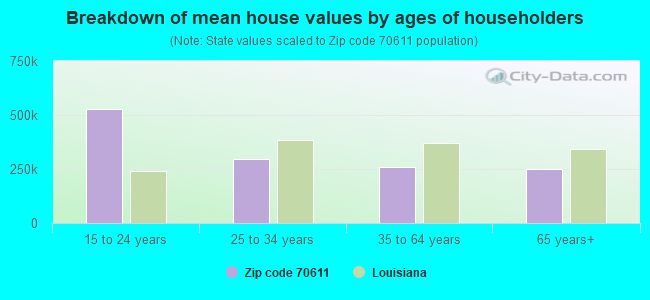
Estimated median house/condo value in 2022: $249,605
70611:
$249,605
Louisiana:
$209,200
According to our research of Louisiana and other state lists, there were 37 registered sex offenders living in 70611 zip code as of April 27, 2024. The ratio of all residents to sex offenders in zip code 70611 is 561 to 1. The ratio of registered sex offenders to all residents in this zip code is lower than the state average.
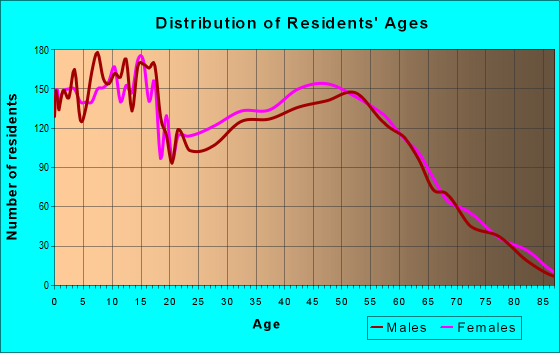
Median resident age:
This zip code:
42.1 years
Louisiana median age:
38.2 years
Average household size:
This zip code:
2.5 people
Louisiana:
2.5 people
Averages for the 2020 tax year for zip code 70611, filed in 2021:
Average Adjusted Gross Income (AGI) in 2020: $74,907 (Individual Income Tax Returns)
Here:
$74,907
State:
$60,757
Salary/wage: $67,260 (reported on 84.3% of returns)
Here:
$67,260
State:
$50,882
(% of AGI for various income ranges: 1096.5% for AGIs below $25k, 3368.6% for AGIs $25k-50k, 5843.4% for AGIs $50k-75k, 8513.5% for AGIs $75k-100k, 15654.2% for AGIs $100k-200k, 39190.0% for AGIs over 200k)
Taxable interest for individuals: $1,083 (reported on 33.5% of returns)
This zip code:
$1,083
Louisiana:
$1,576
(% of AGI for various income ranges: 15.5% for AGIs below $25k, 18.8% for AGIs $25k-50k, 24.8% for AGIs $50k-75k, 45.4% for AGIs $75k-100k, 55.8% for AGIs $100k-200k, 546.5% for AGIs over 200k)
Ordinary dividends: $4,201 (reported on 15.4% of returns)
Here:
$4,201
State:
$7,743
(% of AGI for various income ranges: 18.2% for AGIs below $25k, 25.0% for AGIs $25k-50k, 72.9% for AGIs $50k-75k, 103.1% for AGIs $75k-100k, 113.2% for AGIs $100k-200k, 841.7% for AGIs over 200k)
Net capital gain/loss in AGI: +$9,786 (reported on 14.8% of returns)
Here:
+$9,786
State:
+$16,917
(% of AGI for various income ranges: 17.8% for AGIs below $25k, 25.6% for AGIs $25k-50k, 42.0% for AGIs $50k-75k, 103.3% for AGIs $75k-100k, 342.7% for AGIs $100k-200k, 2640.0% for AGIs over 200k)
Profit/loss from business: +$6,967 (reported on 17.0% of returns)
Here:
+$6,967
State:
+$7,679
(% of AGI for various income ranges: 31.5% for AGIs below $25k, 52.5% for AGIs $25k-50k, 49.7% for AGIs $50k-75k, 153.5% for AGIs $75k-100k, 279.6% for AGIs $100k-200k, 1516.5% for AGIs over 200k)
Taxable individual retirement arrangement distribution: $26,476 (reported on 9.3% of returns)
70611:
$26,476
Louisiana:
$20,716
(% of AGI for various income ranges: 60.5% for AGIs below $25k, 113.2% for AGIs $25k-50k, 259.4% for AGIs $50k-75k, 412.4% for AGIs $75k-100k, 581.2% for AGIs $100k-200k, 2236.1% for AGIs over 200k)
Total itemized deductions: $44,137 (reported on 22.5% of returns)
Here:
$44,137
State:
$36,265
(% of AGI for various income ranges: 197.0% for AGIs below $25k, 532.0% for AGIs $25k-50k, 1082.2% for AGIs $50k-75k, 1761.2% for AGIs $75k-100k, 2497.4% for AGIs $100k-200k, 7688.3% for AGIs over 200k)
Charity contributions: $13,881 (reported on 6.0% of returns)
Here:
$13,881
State:
$13,106
(% of AGI for various income ranges: 15.2% for AGIs $25k-50k, 36.6% for AGIs $50k-75k, 42.8% for AGIs $75k-100k, 225.8% for AGIs $100k-200k, 1425.7% for AGIs over 200k)
Taxes paid: $6,593 (reported on 7.6% of returns)
70611:
$6,593
State:
$6,643
(% of AGI for various income ranges: 2.6% for AGIs below $25k, 9.0% for AGIs $25k-50k, 23.3% for AGIs $50k-75k, 39.4% for AGIs $75k-100k, 151.3% for AGIs $100k-200k, 687.0% for AGIs over 200k)
Earned income credit: $2,426 (reported on 15.1% of returns)
Here:
$2,426
State:
$2,671
(% of AGI for various income ranges: 99.7% for AGIs below $25k, 78.1% for AGIs $25k-50k, 1.2% for AGIs $50k-75k)
Percentage of individuals using paid preparers for their 2020 taxes: 94.6%
Here:
95%
State:
92%
(% for various income ranges: 93.5% for AGIs below $25k, 95.4% for AGIs $25k-50k, 94.8% for AGIs $50k-75k, 94.6% for AGIs $75k-100k, 95.4% for AGIs $100k-200k, 93.2% for AGIs over 200k)
Averages for the 2012 tax year for zip code 70611, filed in 2013:
Average Adjusted Gross Income (AGI) in 2012: $61,720 (Individual Income Tax Returns)
Here:
$61,720
State:
$56,730
Salary/wage: $56,463 (reported on 86.8% of returns)
Here:
$56,463
State:
$45,545
(% of AGI for various income ranges: 77.4% for AGIs below $25k, 78.5% for AGIs $25k-50k, 81.0% for AGIs $50k-75k, 84.8% for AGIs $75k-100k, 85.9% for AGIs $100k-200k, 55.6% for AGIs over 200k)
Taxable interest for individuals: $806 (reported on 33.7% of returns)
This zip code:
$806
Louisiana:
$1,804
(% of AGI for various income ranges: 0.6% for AGIs below $25k, 0.4% for AGIs $25k-50k, 0.4% for AGIs $50k-75k, 0.3% for AGIs $75k-100k, 0.4% for AGIs $100k-200k, 0.8% for AGIs over 200k)
Ordinary dividends: $2,827 (reported on 15.3% of returns)
Here:
$2,827
State:
$7,610
(% of AGI for various income ranges: 1.0% for AGIs below $25k, 0.7% for AGIs $25k-50k, 0.7% for AGIs $50k-75k, 0.5% for AGIs $75k-100k, 0.5% for AGIs $100k-200k, 1.3% for AGIs over 200k)
Net capital gain/loss in AGI: +$5,197 (reported on 12.5% of returns)
Here:
+$5,197
State:
+$17,096
(% of AGI for various income ranges: 0.4% for AGIs $25k-50k, 0.4% for AGIs $50k-75k, 0.2% for AGIs $75k-100k, 0.9% for AGIs $100k-200k, 4.1% for AGIs over 200k)
Profit/loss from business: +$13,944 (reported on 15.3% of returns)
Here:
+$13,944
State:
+$12,088
(% of AGI for various income ranges: 6.5% for AGIs below $25k, 3.6% for AGIs $25k-50k, 1.9% for AGIs $50k-75k, 1.7% for AGIs $75k-100k, 2.5% for AGIs $100k-200k, 8.2% for AGIs over 200k)
Taxable individual retirement arrangement distribution: $17,300 (reported on 8.5% of returns)
70611:
$17,300
Louisiana:
$16,085
(% of AGI for various income ranges: 2.6% for AGIs below $25k, 2.8% for AGIs $25k-50k, 2.5% for AGIs $50k-75k, 2.4% for AGIs $75k-100k, 1.8% for AGIs $100k-200k, 3.3% for AGIs over 200k)
Self-employment retirement plans: $24,267 (reported on 0.4% of returns)
70611:
$24,267
Louisiana:
$25,119
Total itemized deductions: $21,246 (19% of AGI, reported on 30.2% of returns)
Here:
$21,246
State:
$23,585
Here:
19.1% of AGI
State:
18.1% of AGI
(% of AGI for various income ranges: 5.8% for AGIs below $25k, 8.5% for AGIs $25k-50k, 9.1% for AGIs $50k-75k, 10.3% for AGIs $75k-100k, 11.7% for AGIs $100k-200k, 12.0% for AGIs over 200k)
Charity contributions: $6,299 (reported on 23.4% of returns)
Here:
$6,299
State:
$5,533
(% of AGI for various income ranges: 0.7% for AGIs below $25k, 1.3% for AGIs $25k-50k, 1.7% for AGIs $50k-75k, 2.2% for AGIs $75k-100k, 2.8% for AGIs $100k-200k, 3.8% for AGIs over 200k)
Taxes paid: $5,298 (reported on 30.2% of returns)
70611:
$5,298
State:
$6,282
(% of AGI for various income ranges: 0.9% for AGIs below $25k, 1.2% for AGIs $25k-50k, 1.6% for AGIs $50k-75k, 2.3% for AGIs $75k-100k, 3.5% for AGIs $100k-200k, 3.7% for AGIs over 200k)
Earned income credit: $2,323 (reported on 16.3% of returns)
Here:
$2,323
State:
$2,633
(% of AGI for various income ranges: 7.3% for AGIs below $25k, 1.2% for AGIs $25k-50k)
Percentage of individuals using paid preparers for their 2012 taxes: 55.4%
Here:
55%
State:
57%
(% for various income ranges: 51.8% for AGIs below $25k, 55.1% for AGIs $25k-50k, 57.8% for AGIs $50k-75k, 56.1% for AGIs $75k-100k, 57.1% for AGIs $100k-200k, 76.2% for AGIs over 200k)
Averages for the 2004 tax year for zip code 70611, filed in 2005:
Average Adjusted Gross Income (AGI) in 2004: $47,063 (Individual Income Tax Returns)
Here:
$47,063
State:
$39,411
Salary/wage: $44,330 (reported on 88.7% of returns)
Here:
$44,330
State:
$34,434
(% of AGI for various income ranges: 98.3% for AGIs below $10k, 78.6% for AGIs $10k-25k, 83.4% for AGIs $25k-50k, 89.1% for AGIs $50k-75k, 89.8% for AGIs $75k-100k, 74.9% for AGIs over 100k)
Taxable interest for individuals: $932 (reported on 44.2% of returns)
This zip code:
$932
Louisiana:
$1,606
(% of AGI for various income ranges: 3.2% for AGIs below $10k, 1.4% for AGIs $10k-25k, 1.0% for AGIs $25k-50k, 0.5% for AGIs $50k-75k, 0.6% for AGIs $75k-100k, 1.0% for AGIs over 100k)
Taxable dividends: $2,055 (reported on 18.3% of returns)
Here:
$2,055
State:
$3,235
(% of AGI for various income ranges: 2.0% for AGIs below $10k, 0.9% for AGIs $10k-25k, 0.6% for AGIs $25k-50k, 0.4% for AGIs $50k-75k, 0.3% for AGIs $75k-100k, 1.5% for AGIs over 100k)
Net capital gain/loss: +$3,205 (reported on 15.3% of returns)
Here:
+$3,205
State:
+$8,531
(% of AGI for various income ranges: 1.7% for AGIs below $10k, 0.4% for AGIs $10k-25k, 0.2% for AGIs $25k-50k, 0.5% for AGIs $50k-75k, 0.8% for AGIs $75k-100k, 2.2% for AGIs over 100k)
Profit/loss from business: +$9,349 (reported on 14.7% of returns)
Here:
+$9,349
State:
+$9,128
(% of AGI for various income ranges: 11.6% for AGIs below $10k, 4.4% for AGIs $10k-25k, 1.9% for AGIs $25k-50k, 2.0% for AGIs $50k-75k, 1.4% for AGIs $75k-100k, 4.4% for AGIs over 100k)
IRA payment deduction: $2,865 (reported on 2.6% of returns)
70611:
$2,865
Louisiana:
$3,055
(% of AGI for various income ranges: 0.2% for AGIs $10k-25k, 0.2% for AGIs $25k-50k, 0.2% for AGIs $50k-75k, 0.1% for AGIs $75k-100k, 0.1% for AGIs over 100k)
Self-employed pension: $15,606 (reported on 0.5% of returns)
Here:
$15,606
Louisiana:
$17,274
Total itemized deductions: $17,179 (20% of AGI, reported on 28.1% of returns)
Here:
$17,179
State:
$18,222
Here:
20.0% of AGI
State:
20.3% of AGI
(% of AGI for various income ranges: 3.5% for AGIs below $10k, 5.3% for AGIs $10k-25k, 8.0% for AGIs $25k-50k, 10.2% for AGIs $50k-75k, 11.4% for AGIs $75k-100k, 12.4% for AGIs over 100k)
Charity contributions deductions: $4,841 (5% of AGI, reported on 24.2% of returns)
Here:
$4,841
State:
$4,190
Here:
5.4% of AGI
State:
4.4% of AGI
(% of AGI for various income ranges: 1.0% for AGIs $10k-25k, 1.7% for AGIs $25k-50k, 2.1% for AGIs $50k-75k, 2.5% for AGIs $75k-100k, 3.7% for AGIs over 100k)
Total tax: $6,190 (reported on 76.6% of returns)
70611:
$6,190
State:
$6,529
(% of AGI for various income ranges: 3.3% for AGIs below $10k, 3.8% for AGIs $10k-25k, 5.8% for AGIs $25k-50k, 8.0% for AGIs $50k-75k, 10.2% for AGIs $75k-100k, 16.2% for AGIs over 100k)
Earned income credit: $1,815 (reported on 15.3% of returns)
Here:
$1,815
State:
$2,103
Percentage of individuals using paid preparers for their 2004 taxes: 54.7%
Here:
55%
State:
61%
(% for various income ranges: 48.2% for AGIs below $10k, 58.0% for AGIs $10k-25k, 55.6% for AGIs $25k-50k, 55.0% for AGIs $50k-75k, 53.6% for AGIs $75k-100k, 59.0% for AGIs over 100k)
Household received Food Stamps/SNAP in the past 12 months: 739 Household did not receive Food Stamps/SNAP in the past 12 months: 7,125
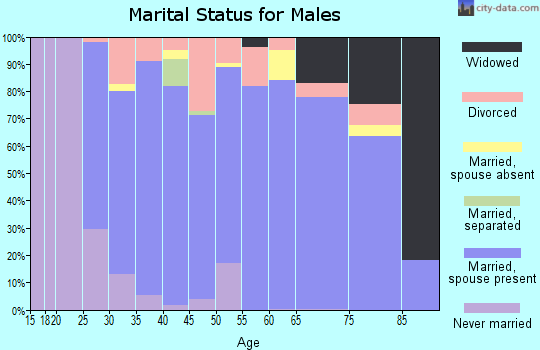
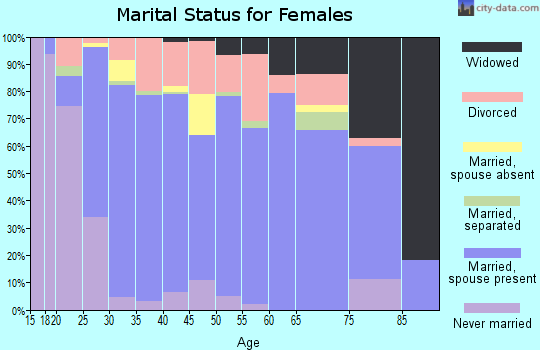
Women who had a birth in the past 12 months: 241 (222 now married, 10 unmarried) Women who did not have a birth in the past 12 months: 3,447 (1,941 now married, 1,482 unmarried)
Housing units in zip code 70611 with a mortgage: 3,874 (244 second mortgage, 165 both second mortgage and home equity loan) Median monthly owner costs for units with a mortgage: $1,580 Median monthly owner costs for units without a mortgage: $429
Residents with income below the poverty level in 2022:
This zip code:
7.4%
Whole state:
18.6%
Residents with income below 50% of the poverty level in 2022:
This zip code:
4.0%
Whole state:
10.1%
Median number of rooms in houses and condos:
Here:
6.4
State:
6.2
Median number of rooms in apartments:
Here:
4.0
State:
4.4
Notable locations in this zip code not listed on our city pages
Notable locations in zip code 70611: Indian Bayou Ferry (A), Perkins Ferry (B), Calcasieu Parish Library Moss Bluff Branch (C), Calcasieu Parish Sheriff's Office Moss Bluff Law Enforcement Center (D), Calcasieu Parish Ward 1 Fire Protection District 1 (E). Display/hide their locations on the map
Churches in zip code 70611 include: Saint Andrews Episcopal Church (A), Moss Bluff Pentecostal Church (B), Moss Bluff Church of Christ (C), Moss Bluff Bible Church (D), Midway Baptist Church (E), Jubilee Family Church (F), Gateway Church of God (G), First Pentecostal Church of Gillis (H), Williams Chapel (I). Display/hide their locations on the map
Streams, rivers, and creeks: Birdsnest Gully (A), West Fork Calcasieu River (B), Persimmon Gully (C), Moss Gully (D), Indian Bayou (E). Display/hide their locations on the map
In group quarters: 21 (-1 institutionalized population)
Size of family households: 2,578 2-persons, 1,200 3-persons, 972 4-persons, 497 5-persons, 78 6-persons, 44 7-or-more-persons
Size of nonfamily households: 2,065 1-person, 495 2-persons, 24 3-persons
3,765 married couples with children.
660 single-parent households (199 men, 461 women).
96.4% of residents of 70611 zip code speak English at home.
1.7% of residents speak Spanish at home (73% very well, 27% well).
1.3% of residents speak other Indo-European language at home (89% very well, 11% well).
0.5% of residents speak Asian or Pacific Island language at home (77% very well, 14% well, 8% not well).
0.2% of residents speak other language at home (23% very well, 23% well, 54% not well).
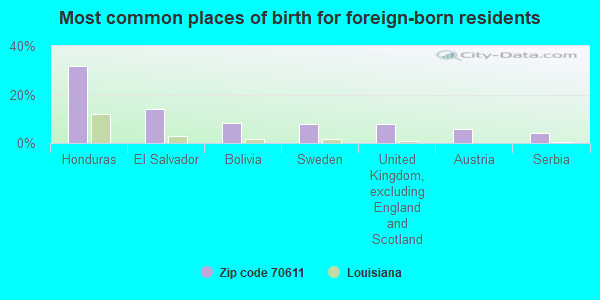
Foreign born population: 297 (1.5%) (64.6% of them are naturalized citizens)
This zip code:
1.5%
Whole state:
4.2%
32%Honduras
14%El Salvador
8%Bolivia
8%Sweden
8%United Kingdom, excluding England and Scotland
6%Austria
4%Serbia
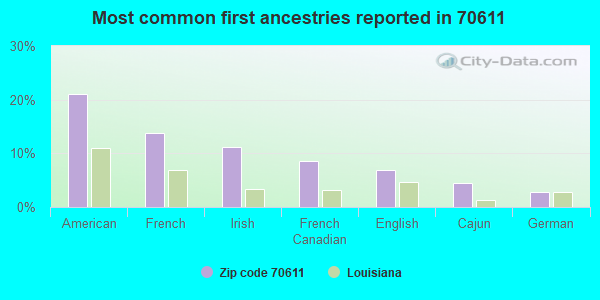
21%American
14%French
11%Irish
9%French Canadian
7%English
5%Cajun
3%German
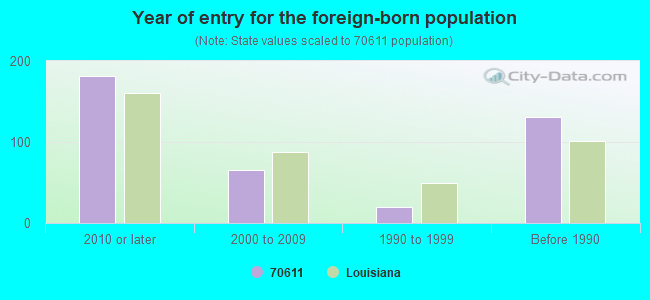
Year of entry for the foreign-born population
1822010 or later
652000 to 2009
201990 to 1999
131Before 1990
Major facilities with environmental interests located in this zip code:
MOSS BLUFF ELEMENTARY SCHOOL (215 SCHOOL STREET in LAKE CHARLES, LA)
(Geographic Names Information System) (National Center for Education Statistics) - STATE ID-010039 Organizations: CALCASIEU PARISH SCHOOL BOARD (SCHOOL DISTRICT)
GILLIS ELEMENTARY SCHOOL (916 TOPSY ROAD in LAKE CHARLES, LA)
(Geographic Names Information System) (National Center for Education Statistics) - STATE ID-010068 Organizations: CALCASIEU PARISH SCHOOL BOARD (SCHOOL DISTRICT)
MOSS BLUFF MIDDLE SCHOOL (1104 RECREATION BOULEVARD in LAKE CHARLES, LA)
(Geographic Names Information System) (National Center for Education Statistics) - STATE ID-010040 Organizations: CALCASIEU PARISH SCHOOL BOARD (SCHOOL DISTRICT)
CHARLES L. MATHIS (398 BRONCO CIRCLE in LAKE CHARLES, LA)
(Integrated Compliance Information System) - ICIS-06-2001-2707, FORMAL ENFORCEMENT ACTION, ICIS-06-2001-2708, Business SIC classification: HEAVY CONSTRUCTION
MR BRYAN D LAROCQUE (475 BEECHWOOD ROAD in LAKE CHARLES, LA)
PINE BROOK ESTATES (3098 HILLERY ROAD in MOSS BLUFF, LA)
National Pollutant Discharge Elimination System NON-MAJOR (Tracking pollutant discharge elimination systems) - permit National Pollutant Discharge Elimination System NON-MAJOR (Tracking pollutant discharge elimination systems) - permit Business SIC classification: SEWERAGE SYSTEMS
MOSS BLUFF CHIROPRACTIC (349 HWY 378 in LAKE CHARLES, LA)
(Resource Conservation and Recovery Act (tracking hazardous waste)) Organizations: CHAD RICHARD (CONTACT/OPERATOR)
, CHAD RICHARD DC (CONTACT/OWNER)
PEEBLES PIT STOP (HWY 171 N .5 M N HWY 378 in MOSS BLUFF, LA)
(Resource Conservation and Recovery Act (tracking hazardous waste)) Organizations: JANUARY PEEBLES (CONTACT/OWNER)
HOLDEN XRAY SVC (2034 N PERKINS FERRY RD in LAKE CHARLES, LA)
(Resource Conservation and Recovery Act (tracking hazardous waste)) Business NAICS classification: ALL OTHER INFORMATION SERVICES. Organizations: ALBERT D HOLDEN (CONTACT/OWNER)
BEAUREGARD ELECTRIC COOPERATIVE INC (975 N PERKINS FERRY RD in MOSS BLUFF, LA)
(Resource Conservation and Recovery Act (tracking hazardous waste))
MOSS BLUFF PRIMARY CARE (340 N HWY 171 in LAKE CHARLES, LA)
(Resource Conservation and Recovery Act (tracking hazardous waste)) Business NAICS classification: OFFICES OF PHYSICIANS, MENTAL HEALTH SPECIALISTS. Organizations: LAKE CHARLES MEMORIAL (CONTACT/OWNER)
MOSS BLUFF MARINE INC (HWY 171 N 1.5 M N HWY 378 in MOSS BLUFF, LA)
(Resource Conservation and Recovery Act (tracking hazardous waste)) Organizations: LINK GERALD (CONTACT/OWNER)
FAUSTO'S FRIED CHICKEN (909 SAM HOUSTON JONES PKWY in LAKE CHARLES, LA)
National Pollutant Discharge Elimination System NON-MAJOR (Tracking pollutant discharge elimination systems) - permit
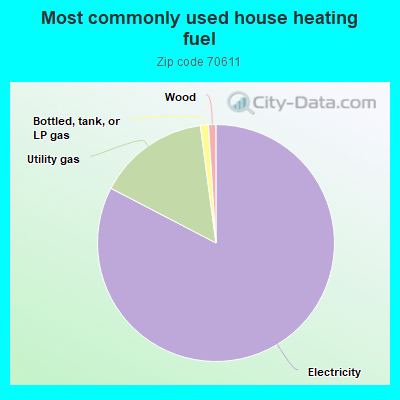
Housing units lacking complete plumbing facilities: 1.2% Housing units lacking complete kitchen facilities: 1.7%
82.4%Electricity
15.2%Utility gas
1.1%Bottled, tank, or LP gas
1.0%Wood
Population in 1990: 12,470. Population change in the 1990s: +4,340 (+34.8%).
Place of birth for U.S.-born residents:
This state: 15,021
Northeast: 326
Midwest: 727
South: 2,879
West: 810
52% of the 70611 zip code residents lived in the same house 5 years ago. Out of people who lived in different houses, 70% lived in this county. Out of people who lived in different counties, 50% lived in Louisiana.
93% of the 70611 zip code residents lived in the same house 1 year ago. Out of people who lived in different houses, 81% moved from this county. Out of people who lived in different houses, 5% moved from different county within same state. Out of people who lived in different houses, 11% moved from different state. Out of people who lived in different houses, 3% moved from abroad.
Private vs. public school enrollment:
Students in private schools in grades 1 to 8 (elementary and middle school): 475
Here:
19.8%
Louisiana:
19.6%
Students in private schools in grades 9 to 12 (high school): 161
Here:
19.4%
Louisiana:
18.3%
Students in private undergraduate colleges: 69
Here:
13.3%
Louisiana:
17.4%
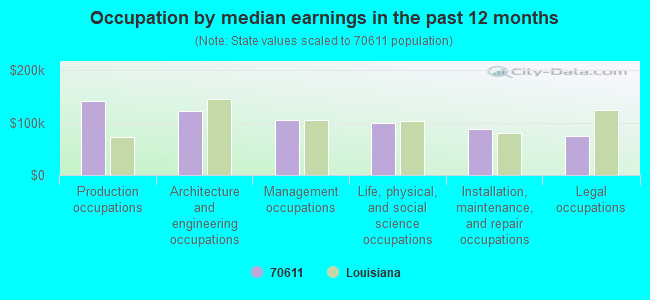
Occupation by median earnings in the past 12 months ($)
142,452Production occupations
123,268Architecture and engineering occupations
105,282Management occupations
99,725Life, physical, and social science occupations
87,326Installation, maintenance, and repair occupations
74,526Legal occupations
Companies with federal contracts located in this zip code:
KRYSTAL ICE & WATER, INC (853 PARISH ROAD in LAKE CHARLES, LA; small business) : $2,173,402 in 43 contractsfrom 2000 to 2004
Contracts for Beverages, Nonalcoholic, Food, Oils and Fats by Army Signed by year:2000: $165,770; 2001: $171,312; 2002: $265,551; 2003: $1,487,101; 2004: $83,668; 2005: $0; 2006: $0.
Biggest contracts:
$1,349,388 with Army for Beverages, Nonalcoholic. Signed on 2003-10-17. Completion date: 2004-09-30.
$117,490, same as above.Signed on 2000-06-29. Completion date: 2000-09-30.
$71,800, same as above.Signed on 2003-04-08. Completion date: 2003-06-30.
$60,350, same as above.Signed on 2002-04-26. Completion date: 2002-06-30.
CHANEY TRUCKING (1662 MILLER ST in LAKE CHARLES, LA; small business)
$13,675 with Army for Facilities Operations Support Services. Signed on 2002-09-06. Completion date: 2002-09-06.
TOTAL RENTAL CENTER OF MOSS BL (487 HIGHWAY 171 N in LAKE CHARLES, LA; small business) : $0 in 2 contractsin 2003
$5,182 with Army for Lease or Rental of Facilities -- Other Non-Building Facilities. Signed on 2003-06-18. Completion date: 2003-11-30.
-$5,182, same as above.Signed on 2003-07-15. Completion date: 2003-11-30.
Top industries in this zip code by the number of employees in 2005:
Administrative and Support and Waste Management and Remediation Services: Professional Employer Organizations (500-999 employees: 1 establishment)
2002 - 2018 National Fire Incident Reporting System (NFIRS) incidents
Based on the data from the years 2002 - 2018 the average number of fire incidents per year is 90. The highest number of fires - 170 took place in 2005, and the least - 44 in 2007. The data has an increasing trend.
When looking into fire subcategories, the most incidents belonged to: Outside Fires (63.8%), and Structure Fires (24.1%).
Fire incident types reported to NFIRS in Zip Code 70611


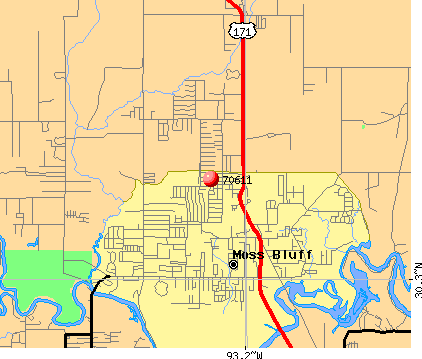 Nearest zip codes: 70615, 70601, 70669, 70657, 70663, 70647.
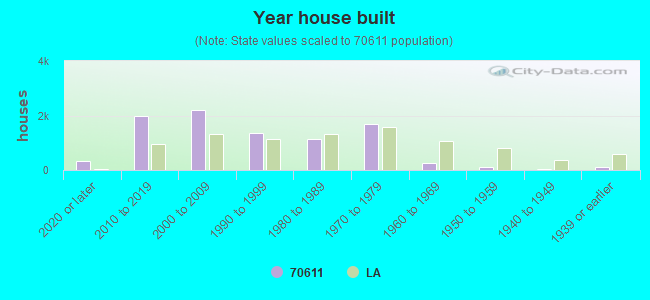


 Based on the data from the years 2002 - 2018 the average number of fire incidents per year is 90. The highest number of fires - 170 took place in 2005, and the least - 44 in 2007. The data has an increasing trend.
 When looking into fire subcategories, the most incidents belonged to: Outside Fires (63.8%), and Structure Fires (24.1%).