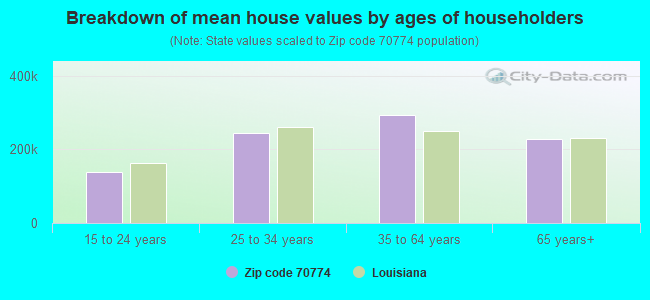
Estimated median house/condo value in 2022: $235,047
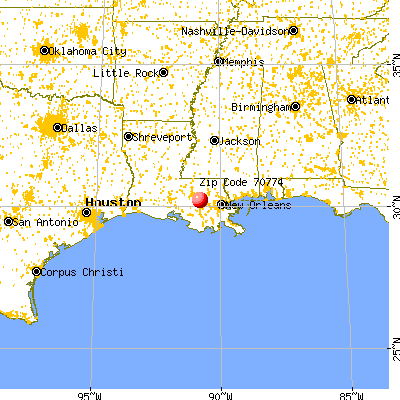
70774:
$235,047
Louisiana:
$209,200
According to our research of Louisiana and other state lists, there were 16 registered sex offenders living in 70774 zip code as of April 27, 2024. The ratio of all residents to sex offenders in zip code 70774 is 721 to 1. The ratio of registered sex offenders to all residents in this zip code is lower than the state average.
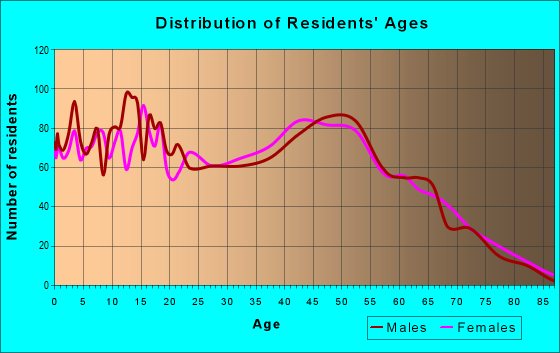
Median resident age:
This zip code:
38.6 years
Louisiana median age:
38.2 years
Average household size:
This zip code:
2.8 people
Louisiana:
2.5 people
Averages for the 2020 tax year for zip code 70774, filed in 2021:
Average Adjusted Gross Income (AGI) in 2020: $71,109 (Individual Income Tax Returns)
Here:
$71,109
State:
$60,757
Salary/wage: $66,997 (reported on 82.5% of returns)
Here:
$66,997
State:
$50,882
(% of AGI for various income ranges: 954.9% for AGIs below $25k, 3405.6% for AGIs $25k-50k, 6120.7% for AGIs $50k-75k, 8983.5% for AGIs $75k-100k, 16554.2% for AGIs $100k-200k, 41191.0% for AGIs over 200k)
Taxable interest for individuals: $797 (reported on 31.9% of returns)
This zip code:
$797
Louisiana:
$1,576
(% of AGI for various income ranges: 13.4% for AGIs below $25k, 17.0% for AGIs $25k-50k, 34.9% for AGIs $50k-75k, 55.6% for AGIs $75k-100k, 50.6% for AGIs $100k-200k, 183.0% for AGIs over 200k)
Ordinary dividends: $2,331 (reported on 15.7% of returns)
Here:
$2,331
State:
$7,743
(% of AGI for various income ranges: 15.6% for AGIs below $25k, 23.1% for AGIs $25k-50k, 34.9% for AGIs $50k-75k, 67.9% for AGIs $75k-100k, 92.1% for AGIs $100k-200k, 290.0% for AGIs over 200k)
Net capital gain/loss in AGI: +$11,667 (reported on 14.0% of returns)
Here:
+$11,667
State:
+$16,917
(% of AGI for various income ranges: 7.7% for AGIs below $25k, 33.2% for AGIs $25k-50k, 45.8% for AGIs $50k-75k, 111.8% for AGIs $75k-100k, 309.0% for AGIs $100k-200k, 4334.0% for AGIs over 200k)
Profit/loss from business: +$7,342 (reported on 17.0% of returns)
Here:
+$7,342
State:
+$7,679
(% of AGI for various income ranges: 136.8% for AGIs below $25k, 72.7% for AGIs $25k-50k, 13.3% for AGIs $50k-75k, 82.9% for AGIs $75k-100k, 249.7% for AGIs $100k-200k, 1552.0% for AGIs over 200k)
Taxable individual retirement arrangement distribution: $26,995 (reported on 8.7% of returns)
70774:
$26,995
Louisiana:
$20,716
(% of AGI for various income ranges: 51.4% for AGIs below $25k, 180.8% for AGIs $25k-50k, 318.2% for AGIs $50k-75k, 418.8% for AGIs $75k-100k, 563.1% for AGIs $100k-200k, 2034.0% for AGIs over 200k)
Total itemized deductions: $33,034 (reported on 6.3% of returns)
Here:
$33,034
State:
$36,265
(% of AGI for various income ranges: 77.9% for AGIs below $25k, 140.9% for AGIs $50k-75k, 299.7% for AGIs $75k-100k, 544.6% for AGIs $100k-200k, 3141.0% for AGIs over 200k)
Charity contributions: $9,973 (reported on 4.8% of returns)
Here:
$9,973
State:
$13,106
(% of AGI for various income ranges: 49.8% for AGIs $50k-75k, 57.9% for AGIs $75k-100k, 138.1% for AGIs $100k-200k, 779.0% for AGIs over 200k)
Taxes paid: $6,961 (reported on 6.1% of returns)
70774:
$6,961
State:
$6,643
(% of AGI for various income ranges: 5.7% for AGIs below $25k, 28.4% for AGIs $50k-75k, 47.9% for AGIs $75k-100k, 132.6% for AGIs $100k-200k, 640.0% for AGIs over 200k)
Earned income credit: $2,395 (reported on 13.5% of returns)
Here:
$2,395
State:
$2,671
(% of AGI for various income ranges: 95.6% for AGIs below $25k, 59.7% for AGIs $25k-50k)
Percentage of individuals using paid preparers for their 2020 taxes: 94.5%
Here:
95%
State:
92%
(% for various income ranges: 93.7% for AGIs below $25k, 95.5% for AGIs $25k-50k, 94.8% for AGIs $50k-75k, 95.6% for AGIs $75k-100k, 94.1% for AGIs $100k-200k, 95.2% for AGIs over 200k)
Averages for the 2012 tax year for zip code 70774, filed in 2013:
Average Adjusted Gross Income (AGI) in 2012: $60,659 (Individual Income Tax Returns)
Here:
$60,659
State:
$56,730
Salary/wage: $55,518 (reported on 87.1% of returns)
Here:
$55,518
State:
$45,545
(% of AGI for various income ranges: 75.6% for AGIs below $25k, 81.6% for AGIs $25k-50k, 81.6% for AGIs $50k-75k, 85.6% for AGIs $75k-100k, 87.6% for AGIs $100k-200k, 45.9% for AGIs over 200k)
Taxable interest for individuals: $675 (reported on 32.4% of returns)
This zip code:
$675
Louisiana:
$1,804
(% of AGI for various income ranges: 0.9% for AGIs below $25k, 0.6% for AGIs $25k-50k, 0.3% for AGIs $50k-75k, 0.4% for AGIs $75k-100k, 0.2% for AGIs $100k-200k, 0.4% for AGIs over 200k)
Ordinary dividends: $1,989 (reported on 13.5% of returns)
Here:
$1,989
State:
$7,610
(% of AGI for various income ranges: 0.6% for AGIs below $25k, 0.4% for AGIs $25k-50k, 0.5% for AGIs $50k-75k, 0.4% for AGIs $75k-100k, 0.3% for AGIs $100k-200k, 1.0% for AGIs over 200k)
Net capital gain/loss in AGI: +$10,449 (reported on 10.0% of returns)
Here:
+$10,449
State:
+$17,096
(% of AGI for various income ranges: 0.1% for AGIs $25k-50k, 0.6% for AGIs $50k-75k, 0.3% for AGIs $75k-100k, 0.7% for AGIs $100k-200k, 10.9% for AGIs over 200k)
Profit/loss from business: +$7,784 (reported on 15.5% of returns)
Here:
+$7,784
State:
+$12,088
(% of AGI for various income ranges: 8.6% for AGIs below $25k, 2.5% for AGIs $25k-50k, 1.3% for AGIs $50k-75k, 0.9% for AGIs $75k-100k, 2.0% for AGIs $100k-200k)
Taxable individual retirement arrangement distribution: $16,132 (reported on 7.5% of returns)
70774:
$16,132
Louisiana:
$16,085
(% of AGI for various income ranges: 3.0% for AGIs below $25k, 2.3% for AGIs $25k-50k, 2.8% for AGIs $50k-75k, 2.2% for AGIs $75k-100k, 2.0% for AGIs $100k-200k)
Total itemized deductions: $20,722 (19% of AGI, reported on 27.1% of returns)
Here:
$20,722
State:
$23,585
Here:
18.7% of AGI
State:
18.1% of AGI
(% of AGI for various income ranges: 6.2% for AGIs below $25k, 7.9% for AGIs $25k-50k, 9.6% for AGIs $50k-75k, 9.2% for AGIs $75k-100k, 10.4% for AGIs $100k-200k, 8.6% for AGIs over 200k)
Charity contributions: $3,410 (reported on 19.7% of returns)
Here:
$3,410
State:
$5,533
(% of AGI for various income ranges: 0.5% for AGIs below $25k, 1.0% for AGIs $25k-50k, 1.0% for AGIs $50k-75k, 1.0% for AGIs $75k-100k, 1.5% for AGIs $100k-200k, 0.8% for AGIs over 200k)
Taxes paid: $4,773 (reported on 26.8% of returns)
70774:
$4,773
State:
$6,282
(% of AGI for various income ranges: 0.7% for AGIs below $25k, 0.8% for AGIs $25k-50k, 1.4% for AGIs $50k-75k, 1.9% for AGIs $75k-100k, 2.9% for AGIs $100k-200k, 3.2% for AGIs over 200k)
Earned income credit: $2,261 (reported on 15.7% of returns)
Here:
$2,261
State:
$2,633
(% of AGI for various income ranges: 6.6% for AGIs below $25k, 1.1% for AGIs $25k-50k)
Percentage of individuals using paid preparers for their 2012 taxes: 57.4%
Here:
57%
State:
57%
(% for various income ranges: 52.6% for AGIs below $25k, 53.7% for AGIs $25k-50k, 59.7% for AGIs $50k-75k, 66.0% for AGIs $75k-100k, 60.5% for AGIs $100k-200k, 87.5% for AGIs over 200k)
Averages for the 2004 tax year for zip code 70774, filed in 2005:
Average Adjusted Gross Income (AGI) in 2004: $43,351 (Individual Income Tax Returns)
Here:
$43,351
State:
$39,411
Salary/wage: $40,732 (reported on 90.0% of returns)
Here:
$40,732
State:
$34,434
(% of AGI for various income ranges: 110.2% for AGIs below $10k, 80.0% for AGIs $10k-25k, 86.5% for AGIs $25k-50k, 88.7% for AGIs $50k-75k, 92.5% for AGIs $75k-100k, 70.6% for AGIs over 100k)
Taxable interest for individuals: $827 (reported on 38.4% of returns)
This zip code:
$827
Louisiana:
$1,606
(% of AGI for various income ranges: 2.1% for AGIs below $10k, 1.6% for AGIs $10k-25k, 0.7% for AGIs $25k-50k, 0.5% for AGIs $50k-75k, 0.4% for AGIs $75k-100k, 0.8% for AGIs over 100k)
Taxable dividends: $1,139 (reported on 15.6% of returns)
Here:
$1,139
State:
$3,235
(% of AGI for various income ranges: 1.5% for AGIs below $10k, 0.4% for AGIs $10k-25k, 0.4% for AGIs $25k-50k, 0.3% for AGIs $50k-75k, 0.2% for AGIs $75k-100k, 0.6% for AGIs over 100k)
Net capital gain/loss: +$5,644 (reported on 11.0% of returns)
Here:
+$5,644
State:
+$8,531
(% of AGI for various income ranges: -1.4% for AGIs below $10k, -0.2% for AGIs $10k-25k, 0.2% for AGIs $25k-50k, 0.1% for AGIs $50k-75k, 0.5% for AGIs $75k-100k, 5.7% for AGIs over 100k)
Profit/loss from business: +$3,553 (reported on 14.2% of returns)
Here:
+$3,553
State:
+$9,128
(% of AGI for various income ranges: 9.5% for AGIs below $10k, 5.7% for AGIs $10k-25k, 1.5% for AGIs $25k-50k, 0.7% for AGIs $50k-75k, 0.4% for AGIs $75k-100k, -0.4% for AGIs over 100k)
IRA payment deduction: $2,914 (reported on 1.8% of returns)
70774:
$2,914
Louisiana:
$3,055
(% of AGI for various income ranges: 0.2% for AGIs $10k-25k, 0.2% for AGIs $25k-50k, 0.1% for AGIs $50k-75k, 0.1% for AGIs $75k-100k, 0.1% for AGIs over 100k)
Total itemized deductions: $16,541 (21% of AGI, reported on 25.6% of returns)
Here:
$16,541
State:
$18,222
Here:
21.2% of AGI
State:
20.3% of AGI
(% of AGI for various income ranges: 4.4% for AGIs below $10k, 4.3% for AGIs $10k-25k, 9.8% for AGIs $25k-50k, 9.5% for AGIs $50k-75k, 12.1% for AGIs $75k-100k, 10.3% for AGIs over 100k)
Charity contributions deductions: $2,582 (3% of AGI, reported on 21.6% of returns)
Here:
$2,582
State:
$4,190
Here:
3.2% of AGI
State:
4.4% of AGI
(% of AGI for various income ranges: 0.5% for AGIs $10k-25k, 1.0% for AGIs $25k-50k, 1.5% for AGIs $50k-75k, 1.5% for AGIs $75k-100k, 1.6% for AGIs over 100k)
Total tax: $5,244 (reported on 76.2% of returns)
70774:
$5,244
State:
$6,529
(% of AGI for various income ranges: 3.2% for AGIs below $10k, 4.0% for AGIs $10k-25k, 6.1% for AGIs $25k-50k, 8.2% for AGIs $50k-75k, 9.9% for AGIs $75k-100k, 15.0% for AGIs over 100k)
Earned income credit: $1,698 (reported on 16.4% of returns)
Here:
$1,698
State:
$2,103
Percentage of individuals using paid preparers for their 2004 taxes: 55.4%
Here:
55%
State:
61%
(% for various income ranges: 48.7% for AGIs below $10k, 53.5% for AGIs $10k-25k, 57.7% for AGIs $25k-50k, 58.4% for AGIs $50k-75k, 55.9% for AGIs $75k-100k, 63.6% for AGIs over 100k)
Household received Food Stamps/SNAP in the past 12 months: 299 Household did not receive Food Stamps/SNAP in the past 12 months: 3,266
Women who had a birth in the past 12 months: 46 (39 now married, 5 unmarried) Women who did not have a birth in the past 12 months: 2,056 (1,003 now married, 1,045 unmarried)
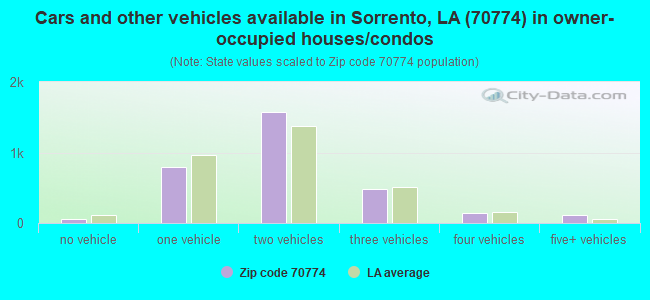
Housing units in zip code 70774 with a mortgage: 1,707 (255 second mortgage, 23 home equity loan, 157 both second mortgage and home equity loan) Houses without a mortgage: 47
Median monthly owner costs for units with a mortgage: $1,702 Median monthly owner costs for units without a mortgage: $386
Residents with income below the poverty level in 2022:
This zip code:
8.0%
Whole state:
18.6%
Residents with income below 50% of the poverty level in 2022:
This zip code:
3.1%
Whole state:
10.1%
Median number of rooms in houses and condos:
Here:
6.3
State:
6.2
Median number of rooms in apartments:
Here:
4.6
State:
4.4
Notable locations in this zip code not listed on our city pages
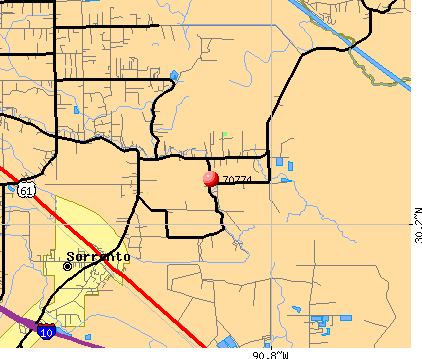
Churches in zip code 70774 include: Saint Amant Baptist Church (A), Holy Rosary Catholic Church (B), Monterrey Goal Place Church (C), Faithful Church (D), New River Church (E). Display/hide their locations on the map
Streams, rivers, and creeks: Duckroost Bayou (A), Heath Bayou (B), Black Bayou (C), Bayou Reponds Pas (D), Bayou Francois (E), Bayou Conway (F), Bayou Antoine (G), New River (H), Pierre Bayou (I). Display/hide their locations on the map
Size of family households: 1,447 2-persons, 415 3-persons, 599 4-persons, 203 5-persons, 148 6-persons, 31 7-or-more-persons
Size of nonfamily households: 616 1-person, 112 2-persons, 17 4-persons
1,725 married couples with children.
514 single-parent households (365 men, 149 women).
97.7% of residents of 70774 zip code speak English at home.
1.1% of residents speak Spanish at home (8% very well, 10% well, 78% not well, 4% not at all).
0.7% of residents speak other Indo-European language at home (100% very well).
0.5% of residents speak Asian or Pacific Island language at home (67% very well, 33% well).
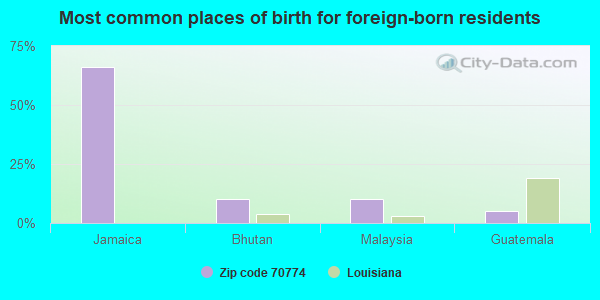
Foreign born population: 167 (1.6%) (22.5% of them are naturalized citizens)
This zip code:
1.6%
Whole state:
4.2%
66%Jamaica
10%Bhutan
10%Malaysia
5%Guatemala
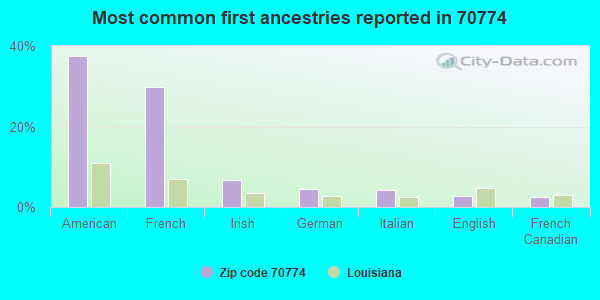
38%American
30%French
7%Irish
5%German
4%Italian
3%English
2%French Canadian
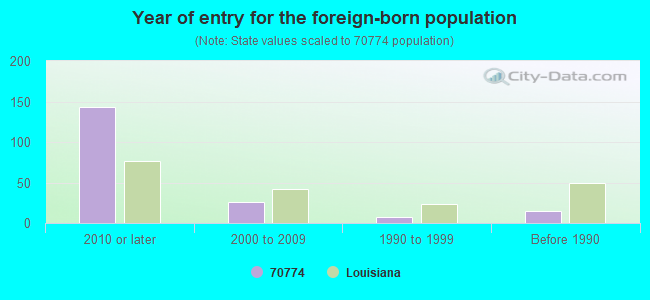
Year of entry for the foreign-born population
1432010 or later
262000 to 2009
81990 to 1999
15Before 1990
Major facilities with environmental interests located in this zip code:
CHERRY PICKER SALES (45180 FONTENOT ROAD in SAINT AMANT, LA)
AIR MINOR (AIRS/AFS) National Pollutant Discharge Elimination System NON-MAJOR (Tracking pollutant discharge elimination systems) - permit National Pollutant Discharge Elimination System NON-MAJOR (Tracking pollutant discharge elimination systems) - permit Conditionally Exempt Small Quantity Generators, less than 100 kg/month of hazardous waste (Resource Conservation and Recovery Act (tracking hazardous waste)) - notification Business SIC classification: SEWERAGE SYSTEMS; REPAIR SHOPS AND RELATED SERVICES Organizations: CHEERY PICKER PARTS (CONTACT/OWNER)
Alternative names: AUDIE J VICKNAIR, CHERRY PICKER, INC., CHERRY PICKER PARTS & SERVICE
316 INC (VAN LAMBERT/LAMBERT UTIL in SAINT AMANT, LA)
National Pollutant Discharge Elimination System NON-MAJOR (Tracking pollutant discharge elimination systems) - permit Business SIC classification: SEWERAGE SYSTEMS Alternative names: 316 INC-LAKE PARK, MO-DAD UTILITIES, LLC
A-Z KIDZ ZONE (ON HWY 431 in ST. AMANT, LA)
National Pollutant Discharge Elimination System NON-MAJOR (Tracking pollutant discharge elimination systems) - permit Business SIC classification: CHILD DAY CARE SERVICES
ASCENSION WASTEWATER UTIL.,INC (LESSARD ACRES SEW. PUMP/PO BOX in ST AMANT, LA)
National Pollutant Discharge Elimination System NON-MAJOR (Tracking pollutant discharge elimination systems) - permit Business SIC classification: SEWERAGE SYSTEMS Alternative names: WASTEWATER TREATMEN-LESSARD AC, WASTEWATER TREATMENT UTILITIES
PIT STOP CAR WASH (HWY 431 @ CHURCH POINT in ST AMANT, LA)
National Pollutant Discharge Elimination System NON-MAJOR (Tracking pollutant discharge elimination systems) - permit Business SIC classification: CARWASHES Alternative names: BAY WASH
GATOR GLASS INC. (GATOR MALL in ST. AMANT, LA)
National Pollutant Discharge Elimination System NON-MAJOR (Tracking pollutant discharge elimination systems) - permit Business SIC classification: SEWERAGE SYSTEMS
4 WAY AUTO PART (44009 HIGHWAY 429 in SAINT AMANT, LA)
Conditionally Exempt Small Quantity Generators, less than 100 kg/month of hazardous waste (Resource Conservation and Recovery Act (tracking hazardous waste)) - notification Business NAICS classification: GENERAL AUTOMOTIVE REPAIR. Organizations: MIKE TEMPLET (CONTACT/OWNER)
AMERICAN INDUSTRIAL FABRICATORS INCORPORATED (12423 JIM BABIN ROAD in SAINT AMANT, LA)
Small Quantity Generators, between 100 kg and 1000 kg of hazardous waste/month (Resource Conservation and Recovery Act (tracking hazardous waste)) - notification Business NAICS classification: OTHER AUTOMOTIVE MECHANICAL AND ELECTRICAL REPAIR AND MAINTENANCE. Alternative names: AMERICAN IDUSTRIAL FABRICATORS INC
ASCENSION SANDBLASTING & PAINTING (9186 SPLIT LOG ROAD in SAINT AMANT, LA)
Conditionally Exempt Small Quantity Generators, less than 100 kg/month of hazardous waste (Resource Conservation and Recovery Act (tracking hazardous waste)) - notification Business NAICS classification: ALL OTHER BUSINESS SUPPORT SERVICES. Organizations: ROY SUTTON (CONTACT/OWNER)
MORAN BRAKE & AUTO RPR (44097 MAURICE BOURGEOIS in ST AMANT, LA)
Conditionally Exempt Small Quantity Generators, less than 100 kg/month of hazardous waste (Resource Conservation and Recovery Act (tracking hazardous waste)) - notification Organizations: MORAN JOSEPH OWNER (CONTACT/OWNER)
POPEYES (44043 STRINGER BRIDGE RD in ST AMANT, LA)
Conditionally Exempt Small Quantity Generators, less than 100 kg/month of hazardous waste (Resource Conservation and Recovery Act (tracking hazardous waste)) - notification Business NAICS classification: ALL OTHER SPECIALTY FOOD STORES. Organizations: STAN WARE (CONTACT/OWNER)
GONZALES BODY SHOP (14528 HWY 31 in ST AMANT, LA)
Conditionally Exempt Small Quantity Generators, less than 100 kg/month of hazardous waste (Resource Conservation and Recovery Act (tracking hazardous waste)) - notification Business NAICS classification: OTHER AUTOMOTIVE MECHANICAL AND ELECTRICAL REPAIR AND MAINTENANCE.; AUTOMOTIVE BODY, PAINT, AND INTERIOR REPAIR AND MAINTENANCE. Organizations: JAMES WILSON (CONTACT/OWNER)
GUILLORYS COLLISION REPAIR (12097 BUSTER RD in ST AMANT, LA)
Conditionally Exempt Small Quantity Generators, less than 100 kg/month of hazardous waste (Resource Conservation and Recovery Act (tracking hazardous waste)) - notification Business NAICS classification: AUTOMOTIVE BODY, PAINT, AND INTERIOR REPAIR AND MAINTENANCE. Organizations: MARK GUILLORY (CONTACT/OWNER)
Housing units lacking complete plumbing facilities: 7.8% Housing units lacking complete kitchen facilities: 10.8%
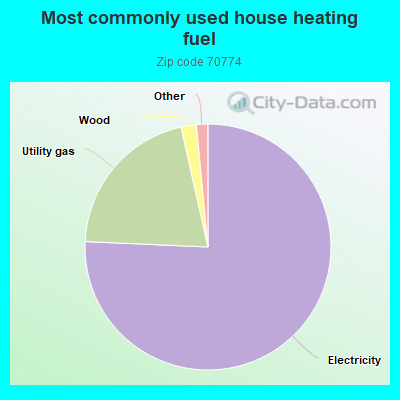
75.7%Electricity
20.8%Utility gas
2.0%Wood
0.9%No fuel used
0.6%Bottled, tank, or LP gas
Population in 1990: 6,177. Population change in the 1990s: +1,314 (+21.3%).
Place of birth for U.S.-born residents:
This state: 8,954
Northeast: 44
Midwest: 149
South: 864
West: 23
65% of the 70774 zip code residents lived in the same house 5 years ago. Out of people who lived in different houses, 64% lived in this county. Out of people who lived in different counties, 50% lived in Louisiana.
95% of the 70774 zip code residents lived in the same house 1 year ago. Out of people who lived in different houses, 48% moved from this county. Out of people who lived in different houses, 46% moved from different county within same state. Out of people who lived in different houses, 7% moved from different state. Out of people who lived in different houses, 3% moved from abroad.
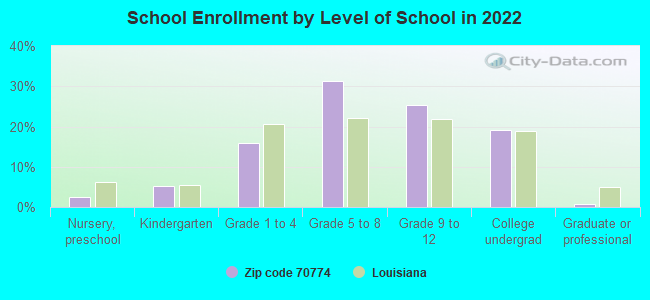
Private vs. public school enrollment:
Students in private schools in grades 1 to 8 (elementary and middle school): 117
Here:
9.0%
Louisiana:
19.6%
Students in private schools in grades 9 to 12 (high school): 102
Here:
14.5%
Louisiana:
18.3%
Students in private undergraduate colleges: 26
Here:
5.0%
Louisiana:
17.4%
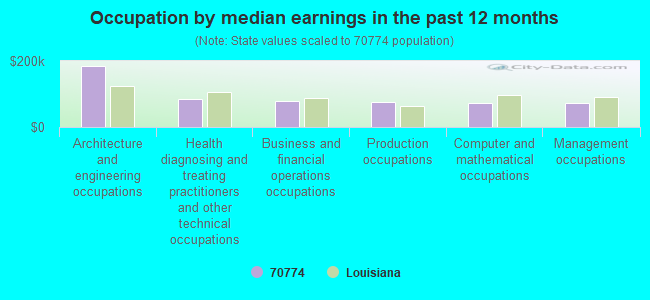
Occupation by median earnings in the past 12 months ($)
185,482Architecture and engineering occupations
84,150Health diagnosing and treating practitioners and other technical occupations
77,608Business and financial operations occupations
75,598Production occupations
73,182Computer and mathematical occupations
73,054Management occupations
Top industries in this zip code by the number of employees in 2005:
Administrative and Support and Waste Management and Remediation Services: Landscaping Services (20-49 employees: 1 establishment, 5-9 employees: 1 establishment)
Health Care and Social Assistance: Child Day Care Services (10-19: 2, 1-4: 1)
Wholesale Trade: Industrial Machinery and Equipment Merchant Wholesalers (10-19: 2)
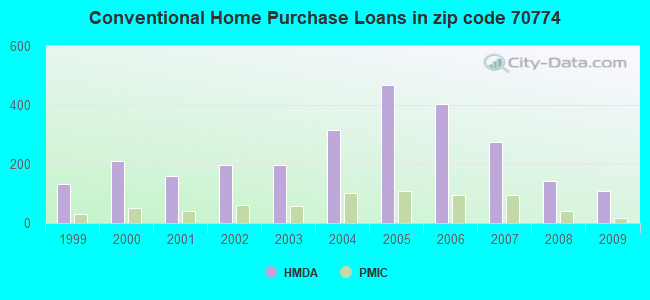
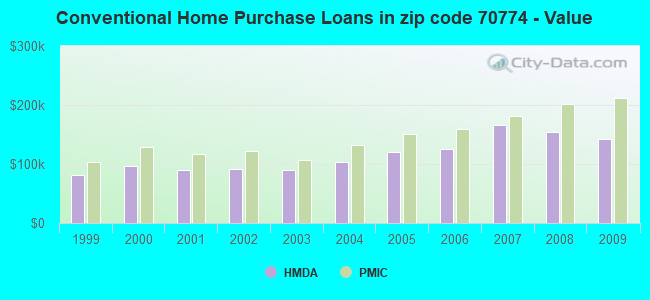
Detailed PMIC statistics for the following Tracts:0301.03
, 0305.00
2002 - 2018 National Fire Incident Reporting System (NFIRS) incidents
Based on the data from the years 2002 - 2018 the average number of fires per year is 29. The highest number of fires - 92 took place in 2005, and the least - 0 in 2007. The data has a declining trend.
When looking into fire subcategories, the most incidents belonged to: Outside Fires (44.6%), and Structure Fires (33.1%).
Fire incident types reported to NFIRS in Zip Code 70774


 Nearest zip codes: 70733, 70449, 70778, 70737, 70763, 70051.


 Based on the data from the years 2002 - 2018 the average number of fires per year is 29. The highest number of fires - 92 took place in 2005, and the least - 0 in 2007. The data has a declining trend.
 When looking into fire subcategories, the most incidents belonged to: Outside Fires (44.6%), and Structure Fires (33.1%).