Averages for the 2020 tax year for zip code 71033, filed in 2021:
Average Adjusted Gross Income (AGI) in 2020: $56,270 (Individual Income Tax Returns)
Here:
$56,270
State:
$60,757
Salary/wage: $49,024 (reported on 79.4% of returns)
Here:
$49,024
State:
$50,882
(% of AGI for various income ranges: 1127.3% for AGIs below $25k, 3464.7% for AGIs $25k-50k, 5967.2% for AGIs $50k-75k, 9315.0% for AGIs $75k-100k, 17058.6% for AGIs $100k-200k)
Taxable interest for individuals: $733 (reported on 26.1% of returns)
This zip code:
$733
Louisiana:
$1,576
(% of AGI for various income ranges: 4.9% for AGIs below $25k, 12.5% for AGIs $25k-50k, 60.6% for AGIs $50k-75k, 28.0% for AGIs $75k-100k, 82.9% for AGIs $100k-200k)
Ordinary dividends: $1,811 (reported on 10.9% of returns)
Here:
$1,811
State:
$7,743
(% of AGI for various income ranges: 8.2% for AGIs below $25k, 13.1% for AGIs $25k-50k, 44.4% for AGIs $50k-75k, 74.0% for AGIs $75k-100k, 66.4% for AGIs $100k-200k)
Net capital gain/loss in AGI: +$4,579 (reported on 8.5% of returns)
Here:
+$4,579
State:
+$16,917
(% of AGI for various income ranges: 10.9% for AGIs $25k-50k, 112.8% for AGIs $50k-75k, 125.0% for AGIs $75k-100k, 198.6% for AGIs $100k-200k)
Profit/loss from business: +$83 (reported on 18.2% of returns)
Here:
+$83
State:
+$7,679
(% of AGI for various income ranges: 34.7% for AGIs below $25k, 127.8% for AGIs $50k-75k, 32.0% for AGIs $75k-100k)
Taxable individual retirement arrangement distribution: $12,633 (reported on 9.1% of returns)
71033:
$12,633
Louisiana:
$20,716
(% of AGI for various income ranges: 38.4% for AGIs below $25k, 103.8% for AGIs $25k-50k, 232.8% for AGIs $50k-75k, 408.0% for AGIs $75k-100k, 402.1% for AGIs $100k-200k)
Total itemized deductions: $30,707 (reported on 8.5% of returns)
Here:
$30,707
State:
$36,265
(% of AGI for various income ranges: 120.4% for AGIs below $25k, 448.3% for AGIs $50k-75k, 649.0% for AGIs $75k-100k, 1643.6% for AGIs $100k-200k)
Charity contributions: $14,925 (reported on 7.3% of returns)
Here:
$14,925
State:
$13,106
(% of AGI for various income ranges: 221.1% for AGIs $50k-75k, 252.0% for AGIs $75k-100k, 815.0% for AGIs $100k-200k)
Taxes paid: $5,879 (reported on 8.5% of returns)
71033:
$5,879
State:
$6,643
(% of AGI for various income ranges: 15.8% for AGIs below $25k, 75.0% for AGIs $50k-75k, 121.0% for AGIs $75k-100k, 354.3% for AGIs $100k-200k)
Earned income credit: $2,297 (reported on 18.8% of returns)
Here:
$2,297
State:
$2,671
(% of AGI for various income ranges: 110.0% for AGIs below $25k, 67.8% for AGIs $25k-50k)
Percentage of individuals using paid preparers for their 2020 taxes: 93.9%
Here:
94%
State:
92%
(% for various income ranges: 93.0% for AGIs below $25k, 92.5% for AGIs $25k-50k, 96.2% for AGIs $50k-75k, 93.8% for AGIs $75k-100k, 95.7% for AGIs $100k-200k, 100.0% for AGIs over 200k)
Averages for the 2012 tax year for zip code 71033, filed in 2013:
Average Adjusted Gross Income (AGI) in 2012: $50,398 (Individual Income Tax Returns)
Here:
$50,398
State:
$56,730
Salary/wage: $42,878 (reported on 85.5% of returns)
Here:
$42,878
State:
$45,545
(% of AGI for various income ranges: 76.4% for AGIs below $25k, 77.6% for AGIs $25k-50k, 74.0% for AGIs $50k-75k, 70.7% for AGIs $75k-100k, 86.3% for AGIs $100k-200k)
Taxable interest for individuals: $862 (reported on 30.2% of returns)
This zip code:
$862
Louisiana:
$1,804
(% of AGI for various income ranges: 0.8% for AGIs below $25k, 0.6% for AGIs $25k-50k, 0.6% for AGIs $50k-75k, 0.4% for AGIs $75k-100k, 0.5% for AGIs $100k-200k)
Ordinary dividends: $1,850 (reported on 12.6% of returns)
Here:
$1,850
State:
$7,610
(% of AGI for various income ranges: 0.2% for AGIs below $25k, 0.3% for AGIs $25k-50k, 0.4% for AGIs $50k-75k, 0.7% for AGIs $75k-100k, 0.6% for AGIs $100k-200k)
Net capital gain/loss in AGI: +$2,546 (reported on 8.2% of returns)
Here:
+$2,546
State:
+$17,096
(% of AGI for various income ranges: 0.4% for AGIs $50k-75k, 1.1% for AGIs $75k-100k, 0.5% for AGIs $100k-200k)
Profit/loss from business: +$5,721 (reported on 18.2% of returns)
Here:
+$5,721
State:
+$12,088
(% of AGI for various income ranges: 5.0% for AGIs below $25k, 1.0% for AGIs $25k-50k, 2.3% for AGIs $75k-100k, 3.5% for AGIs $100k-200k)
Taxable individual retirement arrangement distribution: $13,107 (reported on 9.4% of returns)
71033:
$13,107
Louisiana:
$16,085
(% of AGI for various income ranges: 2.6% for AGIs below $25k, 2.1% for AGIs $25k-50k, 2.7% for AGIs $50k-75k, 2.7% for AGIs $75k-100k, 2.9% for AGIs $100k-200k)
Total itemized deductions: $22,212 (27% of AGI, reported on 30.2% of returns)
Here:
$22,212
State:
$23,585
Here:
26.5% of AGI
State:
18.1% of AGI
(% of AGI for various income ranges: 8.7% for AGIs below $25k, 10.7% for AGIs $25k-50k, 14.5% for AGIs $50k-75k, 15.0% for AGIs $75k-100k, 17.7% for AGIs $100k-200k)
Charity contributions: $7,048 (reported on 25.2% of returns)
Here:
$7,048
State:
$5,533
(% of AGI for various income ranges: 1.8% for AGIs below $25k, 2.5% for AGIs $25k-50k, 3.1% for AGIs $50k-75k, 4.4% for AGIs $75k-100k, 5.2% for AGIs $100k-200k)
Taxes paid: $4,451 (reported on 29.6% of returns)
71033:
$4,451
State:
$6,282
(% of AGI for various income ranges: 1.1% for AGIs below $25k, 1.4% for AGIs $25k-50k, 2.5% for AGIs $50k-75k, 2.9% for AGIs $75k-100k, 4.3% for AGIs $100k-200k)
Earned income credit: $2,267 (reported on 20.8% of returns)
Here:
$2,267
State:
$2,633
(% of AGI for various income ranges: 7.7% for AGIs below $25k, 1.3% for AGIs $25k-50k)
Percentage of individuals using paid preparers for their 2012 taxes: 56.6%
Here:
57%
State:
57%
(% for various income ranges: 51.7% for AGIs below $25k, 50.0% for AGIs $25k-50k, 64.0% for AGIs $50k-75k, 62.5% for AGIs $75k-100k, 77.8% for AGIs $100k-200k)
Averages for the 2004 tax year for zip code 71033, filed in 2005:
Average Adjusted Gross Income (AGI) in 2004: $43,808 (Individual Income Tax Returns)
Here:
$43,808
State:
$39,411
Salary/wage: $40,790 (reported on 88.0% of returns)
Here:
$40,790
State:
$34,434
(% of AGI for various income ranges: 89.0% for AGIs below $10k, 82.8% for AGIs $10k-25k, 82.1% for AGIs $25k-50k, 79.7% for AGIs $50k-75k, 89.0% for AGIs $75k-100k, 78.1% for AGIs over 100k)
Taxable interest for individuals: $1,087 (reported on 35.5% of returns)
This zip code:
$1,087
Louisiana:
$1,606
(% of AGI for various income ranges: 2.9% for AGIs below $10k, 1.0% for AGIs $10k-25k, 1.2% for AGIs $25k-50k, 0.7% for AGIs $50k-75k, 0.6% for AGIs $75k-100k, 0.8% for AGIs over 100k)
Taxable dividends: $872 (reported on 15.2% of returns)
Here:
$872
State:
$3,235
(% of AGI for various income ranges: 0.2% for AGIs below $10k, 0.2% for AGIs $10k-25k, 0.4% for AGIs $25k-50k, 0.5% for AGIs $50k-75k, 0.3% for AGIs $75k-100k, 0.2% for AGIs over 100k)
Net capital gain/loss: +$1,206 (reported on 10.7% of returns)
Here:
+$1,206
State:
+$8,531
(% of AGI for various income ranges: -1.2% for AGIs below $10k, -0.0% for AGIs $10k-25k, -0.0% for AGIs $25k-50k, -0.1% for AGIs $50k-75k, 0.8% for AGIs $75k-100k, 0.7% for AGIs over 100k)
Profit/loss from business: +$3,047 (reported on 14.2% of returns)
Here:
+$3,047
State:
+$9,128
(% of AGI for various income ranges: 2.4% for AGIs below $10k, 1.7% for AGIs $10k-25k, -0.2% for AGIs $25k-50k, 2.8% for AGIs $50k-75k, 0.3% for AGIs $75k-100k, 0.5% for AGIs over 100k)
IRA payment deduction: $2,769 (reported on 2.6% of returns)
71033:
$2,769
Louisiana:
$3,055
(% of AGI for various income ranges: 0.4% for AGIs $10k-25k, 0.3% for AGIs $50k-75k, 0.2% for AGIs over 100k)
Total itemized deductions: $19,270 (24% of AGI, reported on 29.1% of returns)
Here:
$19,270
State:
$18,222
Here:
24.5% of AGI
State:
20.3% of AGI
(% of AGI for various income ranges: 6.6% for AGIs $10k-25k, 9.2% for AGIs $25k-50k, 11.2% for AGIs $50k-75k, 17.0% for AGIs $75k-100k, 16.5% for AGIs over 100k)
Charity contributions deductions: $5,534 (7% of AGI, reported on 24.9% of returns)
Here:
$5,534
State:
$4,190
Here:
6.8% of AGI
State:
4.4% of AGI
(% of AGI for various income ranges: 1.2% for AGIs $10k-25k, 2.3% for AGIs $25k-50k, 3.3% for AGIs $50k-75k, 4.6% for AGIs $75k-100k, 3.5% for AGIs over 100k)
Total tax: $5,730 (reported on 76.6% of returns)
71033:
$5,730
State:
$6,529
(% of AGI for various income ranges: 3.1% for AGIs below $10k, 3.3% for AGIs $10k-25k, 6.7% for AGIs $25k-50k, 9.2% for AGIs $50k-75k, 9.9% for AGIs $75k-100k, 15.6% for AGIs over 100k)
Earned income credit: $1,822 (reported on 18.5% of returns)
Here:
$1,822
State:
$2,103
Percentage of individuals using paid preparers for their 2004 taxes: 61.9%
Here:
62%
State:
61%
(% for various income ranges: 52.5% for AGIs below $10k, 64.0% for AGIs $10k-25k, 63.4% for AGIs $25k-50k, 59.5% for AGIs $50k-75k, 62.3% for AGIs $75k-100k, 74.6% for AGIs over 100k)
Household received Food Stamps/SNAP in the past 12 months: 239 Household did not receive Food Stamps/SNAP in the past 12 months: 1,453
Women who had a birth in the past 12 months: 61 (35 now married, 25 unmarried) Women who did not have a birth in the past 12 months: 437 (246 now married, 187 unmarried)
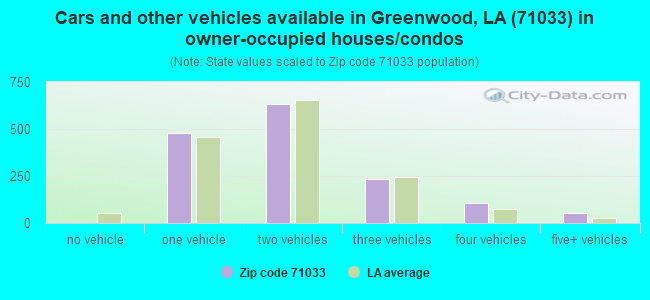
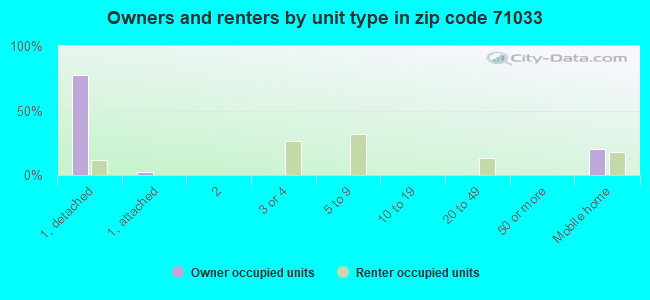
Housing units in zip code 71033 with a mortgage: 851 (51 second mortgage, 16 both second mortgage and home equity loan) Houses without a mortgage: 20
Median monthly owner costs for units with a mortgage: $1,643 Median monthly owner costs for units without a mortgage: $406
Residents with income below the poverty level in 2022:
This zip code:
8.1%
Whole state:
18.6%
Residents with income below 50% of the poverty level in 2022:
This zip code:
7.1%
Whole state:
10.1%
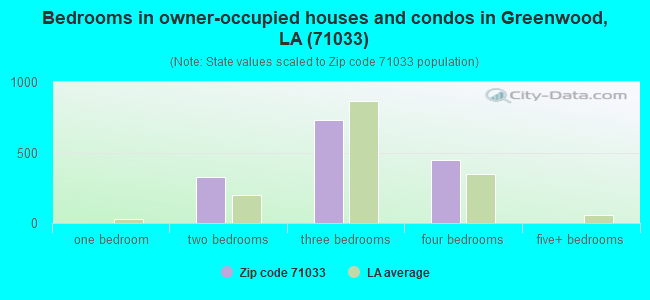
Median number of rooms in houses and condos:
Here:
6.8
State:
6.2
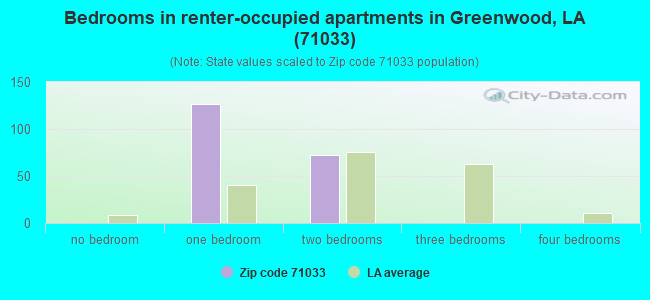
Median number of rooms in apartments:
Here:
3.3
State:
4.4
Notable locations in this zip code not listed on our city pages
Churches in zip code 71033 include: First Baptist Church of Greenwood (A), First United Pentecostal Church of Greenwood (B), Greenwood United Methodist Church (C). Display/hide their locations on the map
Size of family households: 618 2-persons, 350 3-persons, 86 4-persons, 51 5-persons
Size of nonfamily households: 596 1-person
394 married couples with children.
68 single-parent households (36 men, 32 women).
101.0% of residents of 71033 zip code speak English at home.
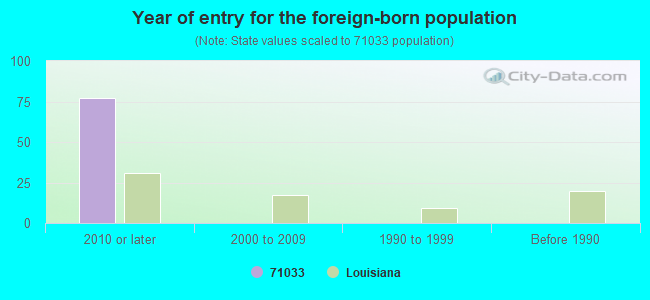
Foreign born population: 0 (0.0%)
:
0.0%
Whole state:
4.2%
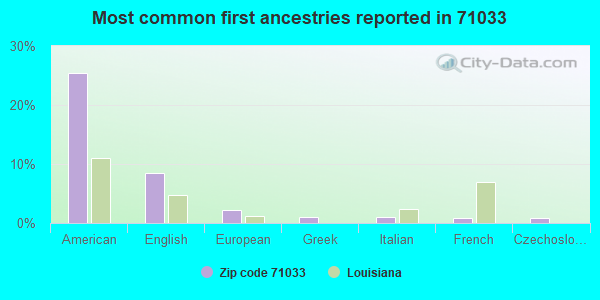
25%American
9%English
2%European
1%Greek
1%Italian
1%French
1%Czechoslovakian
Year of entry for the foreign-born population
772010 or later
02000 to 2009
01990 to 1999
0Before 1990
Major facilities with environmental interests located in this zip code:
GENTRY TRUCKING INC (8125 W 70TH ST in GREENWOOD, LA)
(Resource Conservation and Recovery Act (tracking hazardous waste)) Organizations: JAMES T GENTRY (CONTACT/OWNER)
EOG RESOURCES INC - CADDO GATHERING SYST (6 MI SW OF in GREENWOOD, LA)
AIR MINOR (AIRS/AFS) CRITERIA AND HAZARDOUS AIR POLLUTANT INVENTORY (Inventory of air pollution sources) Business SIC classification: CRUDE PETROLEUM AND NATURAL GAS; NATURAL GAS TRANSMISSION Alternative names: ENRON/CADDO GATHERG, EOG RES/CADDO GATHNG, J D HUPPLER
AGURS B #1 FACILITY - GREENWOOD-WASKOM F (OFF HWY 169 in GREENWOOD, LA)
AIR MINOR (AIRS/AFS) Business SIC classification: CRUDE PETROLEUM AND NATURAL GAS
ARKLATEX PROPERTIES, INC. (NORTH POINTE PLACE in GREENWOOD, LA)
National Pollutant Discharge Elimination System NON-MAJOR (Tracking pollutant discharge elimination systems) - permit
NOVY OIL & GAS, INC. (E D PHILLIPS NO. 1 in GREENWOOD, LA)
National Pollutant Discharge Elimination System NON-MAJOR (Tracking pollutant discharge elimination systems) - permit
GATORS & FRIENDS, LLC (ALLIGATOR PARK in GREENWOOD, LA)
National Pollutant Discharge Elimination System NON-MAJOR (Tracking pollutant discharge elimination systems) - permit
GRAY RICHARD 7 #1 FACILITY - GREENWOOD W (GREENWOOD WASKOM FIELD in GREENWOOD, LA)
AIR MINOR (AIRS/AFS) Business SIC classification: CRUDE PETROLEUM AND NATURAL GAS
GREENWOOD 950, LLC (WALDEN FERRY SUBDIVISION in GREENWOOD, LA)
National Pollutant Discharge Elimination System NON-MAJOR (Tracking pollutant discharge elimination systems) - permit
GREENWOOD RELAY STATION (WEST SIDE OF US 79 in GREENWOOD, LA)
National Pollutant Discharge Elimination System NON-MAJOR (Tracking pollutant discharge elimination systems) - permit
GREENWOOD WASKOM FIELD PRODUCTION FACILI (HWY 149 4 MI N in GREENWOOD, LA)
AIR MINOR (AIRS/AFS) Business SIC classification: CRUDE PETROLEUM AND NATURAL GAS Alternative names: KEY GREENWOOD WASKOM, STEVE BODENHEIMER
GREENWOOD WASKOM GATHERING FIELD FACILIT (GREENWOOD WASKOM FIELD in GREENWOOD, LA)
AIR MINOR (AIRS/AFS) Business SIC classification: CRUDE PETROLEUM AND NATURAL GAS
GREENWOOD-WASKOM FIELD FACILITY (HWY 80 in GREENWOOD, LA)
AIR MINOR (AIRS/AFS) Business SIC classification: CRUDE PETROLEUM AND NATURAL GAS Alternative names: GREGORY A MITSCHKE
HAGGARD #1 FACILITY - GREENWOOD-WASKOM F (ADDRESS NOT GIVEN IN APPLICATI in GREENWOOD, LA)
AIR MINOR (AIRS/AFS) Business SIC classification: CRUDE PETROLEUM AND NATURAL GAS
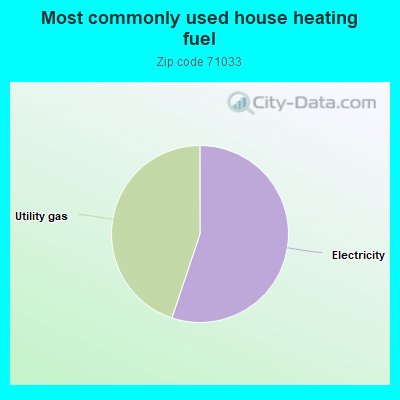
Housing units lacking complete plumbing facilities: 8.3%
55.2%Electricity
44.9%Utility gas
Population in 1990: 3,140.
Place of birth for U.S.-born residents:
This state: 2,524
Northeast: 19
Midwest: 154
South: 545
West: 91
63% of the 71033 zip code residents lived in the same house 5 years ago. Out of people who lived in different houses, 62% lived in this county. Out of people who lived in different counties, 50% lived in Louisiana.
96% of the 71033 zip code residents lived in the same house 1 year ago. Out of people who lived in different houses, 14% moved from this county. Out of people who lived in different houses, 94% moved from different state.
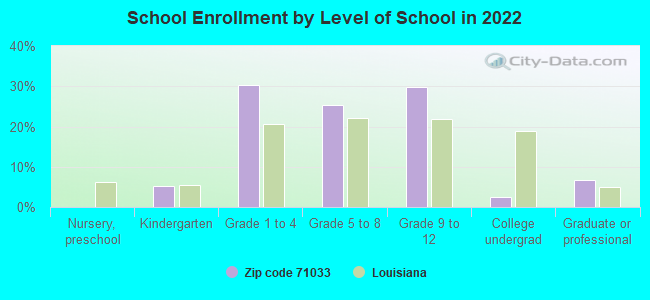
Private vs. public school enrollment:
Students in private schools in grades 1 to 8 (elementary and middle school): 34
Here:
13.7%
Louisiana:
19.6%
Students in private schools in grades 9 to 12 (high school): 15
Here:
11.3%
Louisiana:
18.3%
Students in private undergraduate colleges:
Here:
0.0%
Louisiana:
17.4%
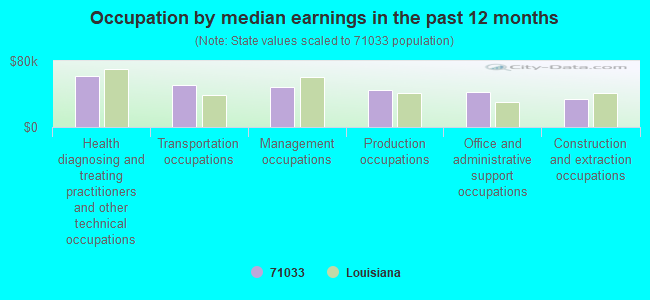
Occupation by median earnings in the past 12 months ($)
61,346Health diagnosing and treating practitioners and other technical occupations
50,315Transportation occupations
47,971Management occupations
45,006Production occupations
42,592Office and administrative support occupations
33,872Construction and extraction occupations
Top industries in this zip code by the number of employees in 2005:
Other Services (except Public Administration): General Automotive Repair (20-49 employees: 1 establishment, 5-9 employees: 1 establishment, 1-4 employees: 1 establishment)
Finance and Insurance: Commercial Banking (20-49: 1)
Health Care and Social Assistance: Other Residential Care Facilities (20-49: 1)
Accommodation and Food Services: Hotels (except Casino Hotels) and Motels (10-19: 1, 1-4: 1)
Arts, Entertainment, and Recreation: Golf Courses and Country Clubs (10-19: 1)
Construction: Commercial and Institutional Building Construction (10-19: 1)
Fatal accident statistics in 2014:
Fatal accident count: 1
Vehicles involved in fatal accidents: 3
Fatal accidents caused by drunken drivers: 0
Fatalities: 1
Persons involved in fatal accidents: 5
Pedestrians involved in fatal accidents: 0
Fatal accident statistics in 2013:
Fatal accident count: 2
Vehicles involved in fatal accidents: 3
Fatal accidents caused by drunken drivers: 1
Fatalities: 2
Persons involved in fatal accidents: 3
Pedestrians involved in fatal accidents: 0
Home Mortgage Disclosure Act Aggregated Statistics For Year 2009 (Based on 6 partial tracts)
A) FHA, FSA/RHS & VA Home Purchase Loans
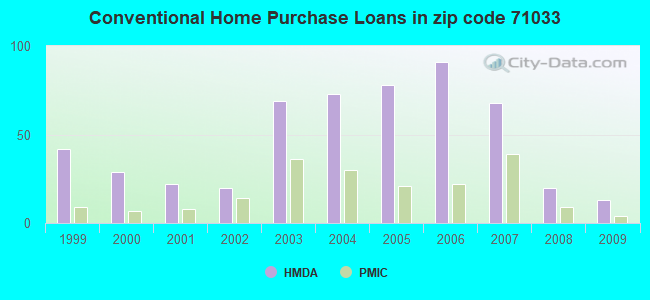
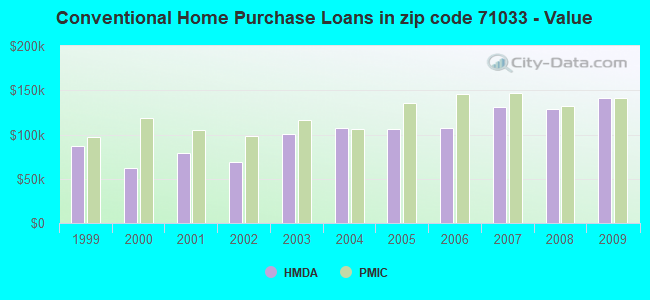
B) Conventional Home Purchase Loans
C) Refinancings
D) Home Improvement Loans
F) Non-occupant Loans on < 5 Family Dwellings (A B C & D)
G) Loans On Manufactured Home Dwelling (A B C & D)
Number
Average Value
Number
Average Value
Number
Average Value
Number
Average Value
Number
Average Value
Number
Average Value
LOANS ORIGINATED
32
$147,065
13
$141,126
96
$149,556
7
$43,730
8
$112,856
14
$83,754
APPLICATIONS APPROVED, NOT ACCEPTED
4
$124,860
4
$103,410
21
$145,687
3
$9,943
1
$64,180
5
$104,032
APPLICATIONS DENIED
10
$141,590
6
$91,757
65
$146,366
16
$47,890
5
$123,000
13
$93,422
APPLICATIONS WITHDRAWN
1
$149,510
3
$232,430
41
$172,208
1
$61,940
1
$61,000
2
$157,155
FILES CLOSED FOR INCOMPLETENESS
1
$108,300
2
$110,520
7
$148,806
4
$64,865
0
$0
1
$48,550
Aggregated Statistics For Year 2008 (Based on 6 partial tracts)
A) FHA, FSA/RHS & VA Home Purchase Loans
B) Conventional Home Purchase Loans
C) Refinancings
D) Home Improvement Loans
E) Loans on Dwellings For 5+ Families
F) Non-occupant Loans on < 5 Family Dwellings (A B C & D)
G) Loans On Manufactured Home Dwelling (A B C & D)
Number
Average Value
Number
Average Value
Number
Average Value
Number
Average Value
Number
Average Value
Number
Average Value
Number
Average Value
LOANS ORIGINATED
26
$140,499
20
$128,588
78
$151,475
11
$31,754
1
$695,840
4
$73,948
7
$75,136
APPLICATIONS APPROVED, NOT ACCEPTED
2
$144,955
3
$37,600
19
$154,925
3
$51,577
0
$0
0
$0
4
$40,188
APPLICATIONS DENIED
7
$133,074
9
$102,979
94
$146,949
21
$46,119
0
$0
3
$80,300
14
$61,309
APPLICATIONS WITHDRAWN
6
$163,003
4
$126,868
34
$162,685
1
$245,850
0
$0
0
$0
2
$67,450
FILES CLOSED FOR INCOMPLETENESS
2
$151,245
1
$132,820
8
$178,894
1
$207,880
0
$0
0
$0
2
$65,015
Aggregated Statistics For Year 2007 (Based on 6 partial tracts)
A) FHA, FSA/RHS & VA Home Purchase Loans
B) Conventional Home Purchase Loans
C) Refinancings
D) Home Improvement Loans
E) Loans on Dwellings For 5+ Families
F) Non-occupant Loans on < 5 Family Dwellings (A B C & D)
G) Loans On Manufactured Home Dwelling (A B C & D)
Number
Average Value
Number
Average Value
Number
Average Value
Number
Average Value
Number
Average Value
Number
Average Value
Number
Average Value
LOANS ORIGINATED
17
$120,197
68
$131,548
96
$137,276
27
$44,779
1
$229,040
7
$148,014
18
$70,629
APPLICATIONS APPROVED, NOT ACCEPTED
2
$167,115
16
$156,525
27
$136,810
3
$98,247
0
$0
2
$136,555
5
$81,724
APPLICATIONS DENIED
4
$86,515
23
$107,073
101
$124,873
38
$69,927
0
$0
5
$63,916
19
$63,793
APPLICATIONS WITHDRAWN
1
$55,390
7
$109,659
36
$132,924
7
$72,356
0
$0
1
$192,540
1
$120,120
FILES CLOSED FOR INCOMPLETENESS
0
$0
3
$173,250
6
$117,863
0
$0
0
$0
0
$0
0
$0
Aggregated Statistics For Year 2006 (Based on 6 partial tracts)
A) FHA, FSA/RHS & VA Home Purchase Loans
B) Conventional Home Purchase Loans
C) Refinancings
D) Home Improvement Loans
F) Non-occupant Loans on < 5 Family Dwellings (A B C & D)
G) Loans On Manufactured Home Dwelling (A B C & D)
Number
Average Value
Number
Average Value
Number
Average Value
Number
Average Value
Number
Average Value
Number
Average Value
LOANS ORIGINATED
22
$112,788
91
$106,968
104
$115,379
28
$45,335
10
$93,785
28
$74,696
APPLICATIONS APPROVED, NOT ACCEPTED
1
$59,750
15
$107,227
33
$114,548
8
$28,821
2
$54,485
5
$45,904
APPLICATIONS DENIED
3
$107,140
34
$99,612
99
$124,652
31
$52,903
6
$102,648
13
$83,455
APPLICATIONS WITHDRAWN
2
$126,330
17
$112,051
57
$143,771
6
$73,963
1
$81,680
1
$63,480
FILES CLOSED FOR INCOMPLETENESS
0
$0
9
$118,401
24
$131,982
0
$0
0
$0
0
$0
Aggregated Statistics For Year 2005 (Based on 6 partial tracts)
A) FHA, FSA/RHS & VA Home Purchase Loans
B) Conventional Home Purchase Loans
C) Refinancings
D) Home Improvement Loans
F) Non-occupant Loans on < 5 Family Dwellings (A B C & D)
G) Loans On Manufactured Home Dwelling (A B C & D)
Number
Average Value
Number
Average Value
Number
Average Value
Number
Average Value
Number
Average Value
Number
Average Value
LOANS ORIGINATED
24
$108,188
78
$106,038
120
$110,089
28
$44,307
7
$101,344
22
$63,988
APPLICATIONS APPROVED, NOT ACCEPTED
5
$81,750
20
$88,386
39
$96,089
9
$53,576
0
$0
10
$60,188
APPLICATIONS DENIED
6
$92,938
46
$74,355
119
$110,482
29
$58,487
4
$63,695
25
$62,196
APPLICATIONS WITHDRAWN
1
$115,060
16
$116,734
74
$128,830
6
$164,447
2
$138,580
4
$57,288
FILES CLOSED FOR INCOMPLETENESS
0
$0
3
$107,387
20
$125,761
0
$0
1
$60,370
0
$0
Aggregated Statistics For Year 2004 (Based on 6 partial tracts)
A) FHA, FSA/RHS & VA Home Purchase Loans
B) Conventional Home Purchase Loans
C) Refinancings
D) Home Improvement Loans
F) Non-occupant Loans on < 5 Family Dwellings (A B C & D)
G) Loans On Manufactured Home Dwelling (A B C & D)
Number
Average Value
Number
Average Value
Number
Average Value
Number
Average Value
Number
Average Value
Number
Average Value
LOANS ORIGINATED
32
$100,314
73
$107,305
128
$103,821
19
$36,717
8
$77,902
33
$70,021
APPLICATIONS APPROVED, NOT ACCEPTED
2
$101,785
17
$81,122
51
$98,298
6
$25,808
4
$71,300
11
$48,685
APPLICATIONS DENIED
9
$105,498
36
$86,672
136
$98,236
28
$33,462
4
$51,515
36
$60,629
APPLICATIONS WITHDRAWN
3
$99,907
9
$95,671
81
$100,995
4
$60,578
4
$56,575
7
$70,283
FILES CLOSED FOR INCOMPLETENESS
1
$98,960
3
$91,403
12
$108,751
0
$0
0
$0
2
$126,860
Aggregated Statistics For Year 2003 (Based on 6 partial tracts)
A) FHA, FSA/RHS & VA Home Purchase Loans
B) Conventional Home Purchase Loans
C) Refinancings
D) Home Improvement Loans
F) Non-occupant Loans on < 5 Family Dwellings (A B C & D)
Number
Average Value
Number
Average Value
Number
Average Value
Number
Average Value
Number
Average Value
LOANS ORIGINATED
24
$96,080
69
$100,016
223
$97,639
22
$24,790
12
$60,303
APPLICATIONS APPROVED, NOT ACCEPTED
2
$89,135
18
$100,043
53
$87,241
5
$35,320
3
$42,943
APPLICATIONS DENIED
5
$103,268
14
$61,838
121
$94,588
17
$14,193
4
$46,502
APPLICATIONS WITHDRAWN
0
$0
6
$88,218
73
$100,651
3
$13,317
1
$35,480
FILES CLOSED FOR INCOMPLETENESS
0
$0
2
$87,715
9
$109,186
0
$0
0
$0
Aggregated Statistics For Year 2002 (Based on 4 partial tracts)
A) FHA, FSA/RHS & VA Home Purchase Loans
B) Conventional Home Purchase Loans
C) Refinancings
D) Home Improvement Loans
F) Non-occupant Loans on < 5 Family Dwellings (A B C & D)
Number
Average Value
Number
Average Value
Number
Average Value
Number
Average Value
Number
Average Value
LOANS ORIGINATED
18
$91,730
20
$69,380
77
$92,826
10
$25,088
8
$49,106
APPLICATIONS APPROVED, NOT ACCEPTED
1
$114,260
6
$58,020
23
$77,052
3
$34,520
2
$51,295
APPLICATIONS DENIED
0
$0
12
$53,482
55
$93,651
12
$14,667
2
$60,045
APPLICATIONS WITHDRAWN
1
$146,350
3
$85,570
22
$84,842
0
$0
1
$63,210
FILES CLOSED FOR INCOMPLETENESS
0
$0
0
$0
18
$80,439
0
$0
0
$0
Aggregated Statistics For Year 2001 (Based on 4 partial tracts)
A) FHA, FSA/RHS & VA Home Purchase Loans
B) Conventional Home Purchase Loans
C) Refinancings
D) Home Improvement Loans
F) Non-occupant Loans on < 5 Family Dwellings (A B C & D)
Number
Average Value
Number
Average Value
Number
Average Value
Number
Average Value
Number
Average Value
LOANS ORIGINATED
15
$88,651
22
$79,560
75
$93,286
13
$17,167
8
$44,184
APPLICATIONS APPROVED, NOT ACCEPTED
0
$0
7
$67,929
21
$77,144
5
$29,270
1
$78,280
APPLICATIONS DENIED
3
$113,610
23
$46,866
83
$82,607
19
$37,105
3
$40,353
APPLICATIONS WITHDRAWN
0
$0
3
$87,677
42
$80,929
2
$22,610
0
$0
FILES CLOSED FOR INCOMPLETENESS
0
$0
0
$0
6
$73,578
0
$0
0
$0
Aggregated Statistics For Year 2000 (Based on 4 partial tracts)
A) FHA, FSA/RHS & VA Home Purchase Loans
B) Conventional Home Purchase Loans
C) Refinancings
D) Home Improvement Loans
F) Non-occupant Loans on < 5 Family Dwellings (A B C & D)
Number
Average Value
Number
Average Value
Number
Average Value
Number
Average Value
Number
Average Value
LOANS ORIGINATED
16
$69,374
29
$62,569
35
$68,013
18
$9,805
3
$44,570
APPLICATIONS APPROVED, NOT ACCEPTED
2
$81,195
10
$46,432
15
$67,873
5
$16,336
1
$149,260
APPLICATIONS DENIED
1
$59,320
23
$34,414
57
$66,865
18
$20,637
3
$37,277
APPLICATIONS WITHDRAWN
2
$67,340
7
$69,734
35
$60,705
2
$32,820
0
$0
FILES CLOSED FOR INCOMPLETENESS
0
$0
2
$62,720
9
$103,669
0
$0
0
$0
Aggregated Statistics For Year 1999 (Based on 3 partial tracts)
A) FHA, FSA/RHS & VA Home Purchase Loans
B) Conventional Home Purchase Loans
C) Refinancings
D) Home Improvement Loans
F) Non-occupant Loans on < 5 Family Dwellings (A B C & D)
Detailed PMIC statistics for the following Tracts:0243.01
, 0243.04
2002 - 2018 National Fire Incident Reporting System (NFIRS) incidents
Based on the data from the years 2002 - 2018 the average number of fire incidents per year is 29. The highest number of fires - 72 took place in 2011, and the least - 2 in 2007. The data has a growing trend.
When looking into fire subcategories, the most reports belonged to: Outside Fires (52.4%), and Structure Fires (24.1%).
Fire incident types reported to NFIRS in Zip Code 71033
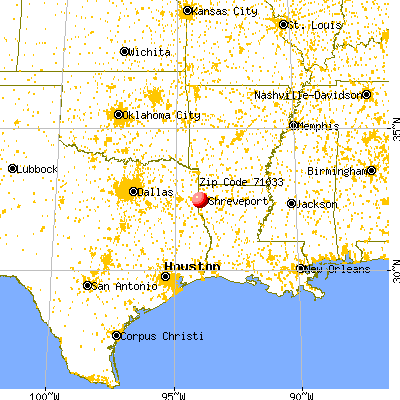


 Nearest zip codes: 71007, 71129, 71119, 75692, 71047, 75642.


 Based on the data from the years 2002 - 2018 the average number of fire incidents per year is 29. The highest number of fires - 72 took place in 2011, and the least - 2 in 2007. The data has a growing trend.
 When looking into fire subcategories, the most reports belonged to: Outside Fires (52.4%), and Structure Fires (24.1%).