Estimated zip code population in 2022: 1,389 Zip code population in 2010: 1,719 Zip code population in 2000: 1,774
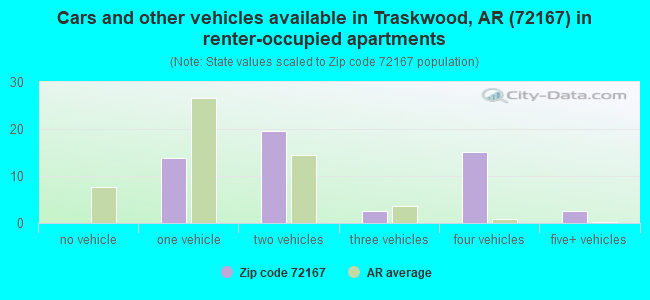
Houses and condos: 592 Renter-occupied apartments: 55
% of renters here:
10%
State:
34%
March 2022 cost of living index in zip code 72167: 77.3 (low, U.S. average is 100)
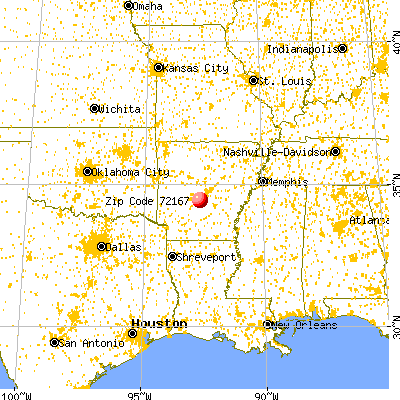
Land area: 44.8 sq. mi. Water area: 0.0 sq. mi.
Population density: 31 people per square mile
(very low).
OSM Map
General Map
Google Map
MSN Map
OSM Map
General Map
Google Map
MSN Map
OSM Map
General Map
Google Map
MSN Map
OSM Map
General Map
Google Map
MSN Map
Please wait while loading the map...
Real estate property taxes paid for housing units in 2022:
This zip code:
0.4% ($383)
Arkansas:
0.5% ($977)
Median real estate property taxes paid for housing units with mortgages in 2022: $387 (0.3%) Median real estate property taxes paid for housing units with no mortgage in 2022: $427 (0.4%)
Business Search- 14 Million verified businesses
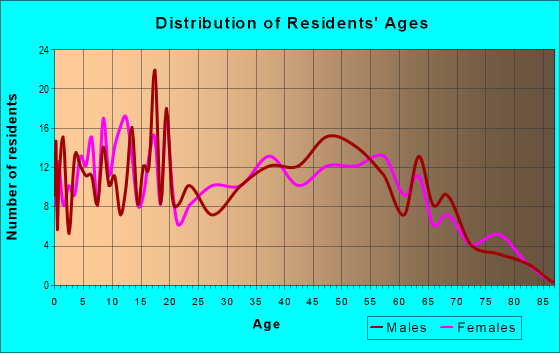
Males: 642
(46.2%)
Females: 746
(53.8%)
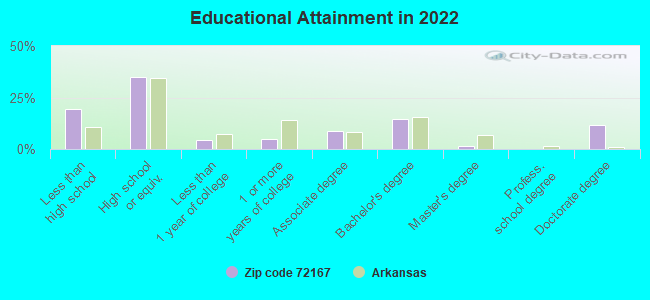
For population 25 years and over in 72167:
High school or higher: 81.0%
Bachelor's degree or higher: 27.6%
Graduate or professional degree: 12.8%
Unemployed: 1.4%
Mean travel time to work (commute): 27.1 minutes
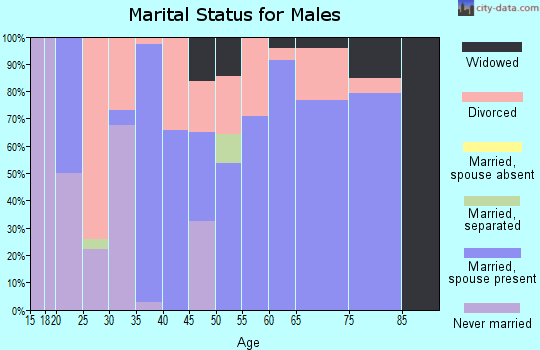
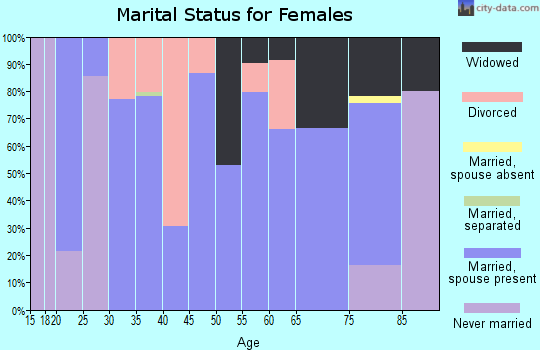
For population 15 years and over in 72167:
Never married: 17.6%
Now married: 54.1%
Separated: 1.8%
Widowed: 13.3%
Divorced: 13.2%
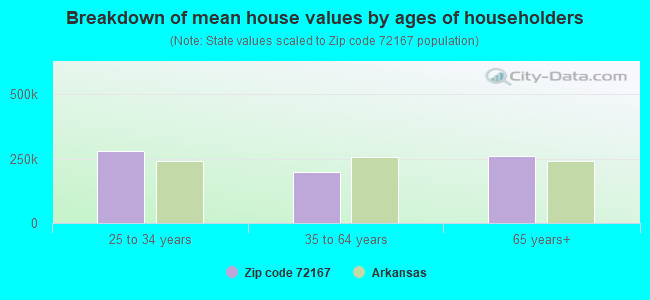
Zip code 72167 compared to state average:
Median house value below state average.
Unemployed percentage significantly below state average.
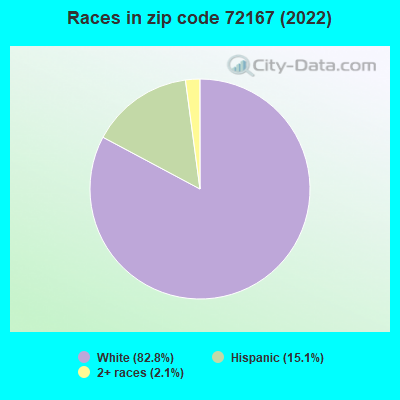
Black race population percentage significantly below state average.
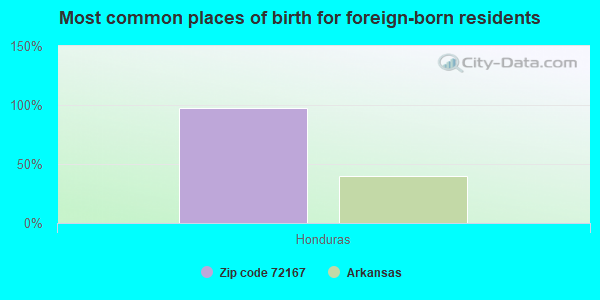
Hispanic race population percentage above state average.
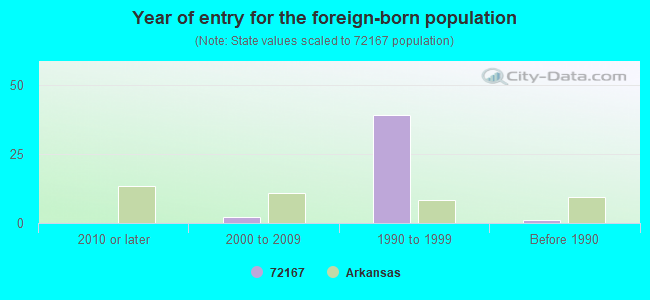
Foreign-born population percentage below state average.
Renting percentage significantly below state average.
Length of stay since moving in significantly above state average.
Estimated median house/condo value in 2022: $101,636
72167:
$101,636
Arkansas:
$179,800
According to our research of Arkansas and other state lists, there were 3 registered sex offenders living in 72167 zip code as of April 27, 2024. The ratio of all residents to sex offenders in zip code 72167 is 460 to 1. The ratio of registered sex offenders to all residents in this zip code is near the state average.
Median resident age:
This zip code:
39.0 years
Arkansas median age:
38.9 years
Average household size:
This zip code:
2.6 people
Arkansas:
2.4 people
Averages for the 2020 tax year for zip code 72167, filed in 2021:
Average Adjusted Gross Income (AGI) in 2020: $50,079 (Individual Income Tax Returns)
Here:
$50,079
State:
$64,872
Salary/wage: $48,598 (reported on 80.0% of returns)
Here:
$48,598
State:
$50,644
(% of AGI for various income ranges: 1168.9% for AGIs below $25k, 3423.1% for AGIs $25k-50k, 6592.5% for AGIs $50k-75k, 9210.0% for AGIs $75k-100k, 16258.3% for AGIs $100k-200k)
Taxable interest for individuals: $407 (reported on 20.0% of returns)
This zip code:
$407
Arkansas:
$1,857
(% of AGI for various income ranges: 4.4% for AGIs below $25k, 8.8% for AGIs $25k-50k, 20.0% for AGIs $50k-75k, 16.0% for AGIs $75k-100k, 18.3% for AGIs $100k-200k)
Ordinary dividends: $1,260 (reported on 7.1% of returns)
Here:
$1,260
State:
$21,681
(% of AGI for various income ranges: 11.7% for AGIs below $25k, 52.5% for AGIs $50k-75k)
Net capital gain/loss in AGI: +$1,050 (reported on 5.7% of returns)
Here:
+$1,050
State:
+$22,815
(% of AGI for various income ranges: 52.5% for AGIs $50k-75k)
Profit/loss from business: +$4,722 (reported on 12.9% of returns)
Here:
+$4,722
State:
+$9,743
(% of AGI for various income ranges: 127.8% for AGIs below $25k, 243.8% for AGIs $50k-75k)
Taxable individual retirement arrangement distribution: $14,450 (reported on 5.7% of returns)
72167:
$14,450
Arkansas:
$18,502
(% of AGI for various income ranges: 361.2% for AGIs $25k-50k)
Earned income credit: $2,457 (reported on 20.0% of returns)
Here:
$2,457
State:
$2,546
(% of AGI for various income ranges: 99.4% for AGIs below $25k, 103.1% for AGIs $25k-50k)
Percentage of individuals using paid preparers for their 2020 taxes: 97.1%
Here:
97%
State:
94%
(% for various income ranges: 95.7% for AGIs below $25k, 100.0% for AGIs $25k-50k, 91.7% for AGIs $50k-75k, 100.0% for AGIs $75k-100k, 100.0% for AGIs $100k-200k)
Averages for the 2012 tax year for zip code 72167, filed in 2013:
Average Adjusted Gross Income (AGI) in 2012: $38,161 (Individual Income Tax Returns)
Here:
$38,161
State:
$52,148
Salary/wage: $36,831 (reported on 84.1% of returns)
Here:
$36,831
State:
$41,669
(% of AGI for various income ranges: 73.0% for AGIs below $25k, 78.9% for AGIs $25k-50k, 84.6% for AGIs $50k-75k, 88.9% for AGIs $75k-100k, 77.7% for AGIs $100k-200k)
Taxable interest for individuals: $500 (reported on 20.3% of returns)
This zip code:
$500
Arkansas:
$1,648
(% of AGI for various income ranges: 1.0% for AGIs below $25k, 0.2% for AGIs $25k-50k, 0.2% for AGIs $50k-75k, 0.1% for AGIs $75k-100k)
Ordinary dividends: $775 (reported on 5.8% of returns)
Here:
$775
State:
$20,675
Net capital gain/loss in AGI: +$667 (reported on 4.3% of returns)
Here:
+$667
State:
+$15,222
Profit/loss from business: +$3,256 (reported on 13.0% of returns)
Here:
+$3,256
State:
+$9,665
Taxable individual retirement arrangement distribution: $5,450 (reported on 5.8% of returns)
72167:
$5,450
Arkansas:
$13,644
Total itemized deductions: $15,473 (23% of AGI, reported on 15.9% of returns)
Here:
$15,473
State:
$23,276
Here:
22.6% of AGI
State:
19.1% of AGI
(% of AGI for various income ranges: 5.8% for AGIs $25k-50k, 10.2% for AGIs $50k-75k, 13.4% for AGIs $100k-200k)
Charity contributions: $3,200 (reported on 11.6% of returns)
Here:
$3,200
State:
$5,996
Taxes paid: $4,582 (reported on 15.9% of returns)
72167:
$4,582
State:
$7,941
(% of AGI for various income ranges: 1.0% for AGIs $25k-50k, 3.0% for AGIs $50k-75k, 5.3% for AGIs $100k-200k)
Earned income credit: $2,265 (reported on 24.6% of returns)
Here:
$2,265
State:
$2,455
(% of AGI for various income ranges: 7.5% for AGIs below $25k, 1.6% for AGIs $25k-50k)
Percentage of individuals using paid preparers for their 2012 taxes: 71.0%
Here:
71%
State:
61%
(% for various income ranges: 70.0% for AGIs below $25k, 68.4% for AGIs $25k-50k, 66.7% for AGIs $50k-75k, 80.0% for AGIs $75k-100k, 100.0% for AGIs $100k-200k)
Averages for the 2004 tax year for zip code 72167, filed in 2005:
Average Adjusted Gross Income (AGI) in 2004: $33,257 (Individual Income Tax Returns)
Here:
$33,257
State:
$39,270
Salary/wage: $31,509 (reported on 86.0% of returns)
Here:
$31,509
State:
$34,079
(% of AGI for various income ranges: 78.6% for AGIs below $10k, 77.3% for AGIs $10k-25k, 84.7% for AGIs $25k-50k, 87.0% for AGIs $50k-75k, 89.8% for AGIs $75k-100k, 56.7% for AGIs over 100k)
Taxable interest for individuals: $838 (reported on 29.7% of returns)
This zip code:
$838
Arkansas:
$1,904
(% of AGI for various income ranges: 2.1% for AGIs below $10k, 2.0% for AGIs $10k-25k, 0.8% for AGIs $25k-50k, 0.3% for AGIs $50k-75k, 0.1% for AGIs $75k-100k, 0.2% for AGIs over 100k)
Taxable dividends: $1,000 (reported on 8.2% of returns)
Here:
$1,000
State:
$5,995
Net capital gain/loss: +$5,273 (reported on 8.8% of returns)
Here:
+$5,273
State:
+$10,430
Profit/loss from business: +$6,222 (reported on 14.4% of returns)
Here:
+$6,222
State:
+$7,823
(% of AGI for various income ranges: 10.3% for AGIs below $10k, 4.5% for AGIs $10k-25k, 2.9% for AGIs $25k-50k, 2.7% for AGIs $50k-75k)
Total itemized deductions: $14,521 (24% of AGI, reported on 15.4% of returns)
Here:
$14,521
State:
$18,389
Here:
24.2% of AGI
State:
21.0% of AGI
(% of AGI for various income ranges: 7.3% for AGIs $10k-25k, 4.3% for AGIs $25k-50k, 6.6% for AGIs $50k-75k, 14.9% for AGIs $75k-100k, 9.3% for AGIs over 100k)
Charity contributions deductions: $2,441 (4% of AGI, reported on 10.9% of returns)
Here:
$2,441
State:
$4,725
Here:
3.8% of AGI
State:
5.1% of AGI
(% of AGI for various income ranges: 0.3% for AGIs $25k-50k, 0.8% for AGIs $50k-75k, 3.8% for AGIs $75k-100k, 1.4% for AGIs over 100k)
Total tax: $3,424 (reported on 72.2% of returns)
72167:
$3,424
State:
$6,047
(% of AGI for various income ranges: 3.3% for AGIs below $10k, 3.9% for AGIs $10k-25k, 6.0% for AGIs $25k-50k, 7.7% for AGIs $50k-75k, 9.9% for AGIs $75k-100k, 14.6% for AGIs over 100k)
Earned income credit: $2,000 (reported on 20.9% of returns)
Here:
$2,000
State:
$1,909
Percentage of individuals using paid preparers for their 2004 taxes: 69.0%
Here:
69%
State:
67%
(% for various income ranges: 65.8% for AGIs below $10k, 63.1% for AGIs $10k-25k, 73.4% for AGIs $25k-50k, 72.6% for AGIs $50k-75k, 73.7% for AGIs $75k-100k, 77.8% for AGIs over 100k)
Household received Food Stamps/SNAP in the past 12 months: 35 Household did not receive Food Stamps/SNAP in the past 12 months: 494
Women who had a birth in the past 12 months: 15 (0 now married, 15 unmarried) Women who did not have a birth in the past 12 months: 258 (123 now married, 135 unmarried)
Housing units in zip code 72167 with a mortgage: 267 Median monthly owner costs for units with a mortgage: $850 Median monthly owner costs for units without a mortgage: $347
Residents with income below the poverty level in 2022:
This zip code:
23.0%
Whole state:
16.8%
Residents with income below 50% of the poverty level in 2022:
This zip code:
14.3%
Whole state:
8.5%
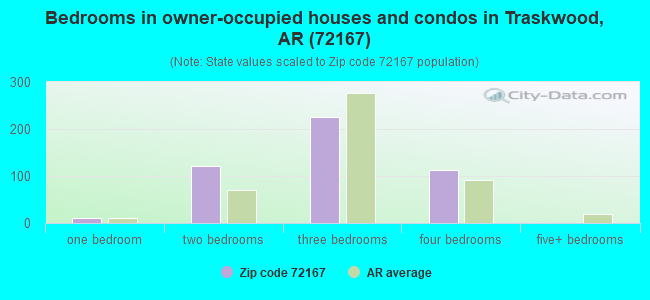
Median number of rooms in houses and condos:
Here:
6.0
State:
6.1
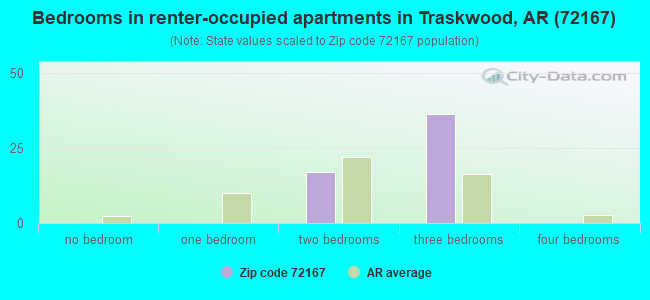
Median number of rooms in apartments:
Here:
5.0
State:
4.3
Notable locations in this zip code not listed on our city pages
Streams, rivers, and creeks: Holly Creek (A), Fletcher Slough (B), Trace Creek (C), Tenmile Creek (D), Clift Creek (E), Chinquapin Creek (F), Brushy Creek (G). Display/hide their locations on the map
Housing units lacking complete plumbing facilities: 5.0% Housing units lacking complete kitchen facilities: 0.7%
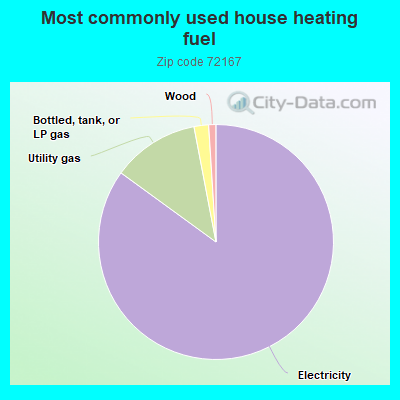
85.1%Electricity
12.0%Utility gas
2.0%Bottled, tank, or LP gas
1.0%Wood
Population in 1990: 606. Population change in the 1990s: +1,168 (+192.7%).
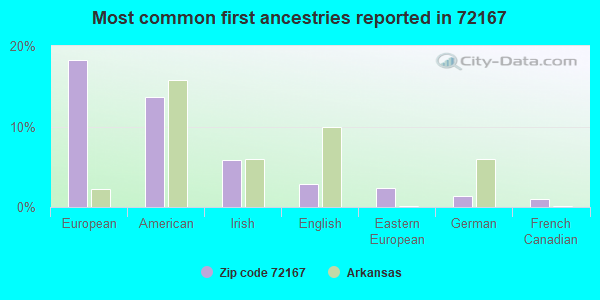
Place of birth for U.S.-born residents:
This state: 1,072
Midwest: 36
South: 100
West: 126
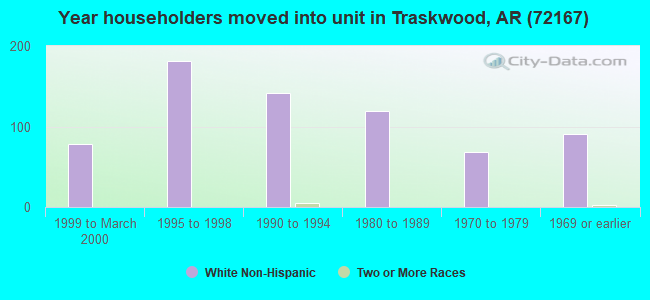
67% of the 72167 zip code residents lived in the same house 5 years ago. Out of people who lived in different houses, 58% lived in this county. Out of people who lived in different counties, 50% lived in Arkansas.
97% of the 72167 zip code residents lived in the same house 1 year ago. Out of people who lived in different houses, 40% moved from this county. Out of people who lived in different houses, 68% moved from abroad.
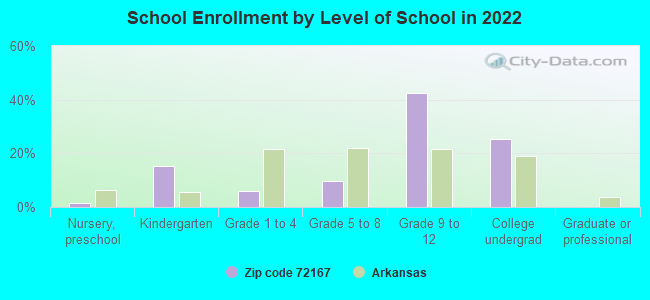
Private vs. public school enrollment:
Students in private schools in grades 1 to 8 (elementary and middle school):
Here:
0.0%
Arkansas:
10.5%
Students in private schools in grades 9 to 12 (high school):
Here:
0.0%
Arkansas:
8.7%
Students in private undergraduate colleges:
Here:
0.0%
Arkansas:
19.4%
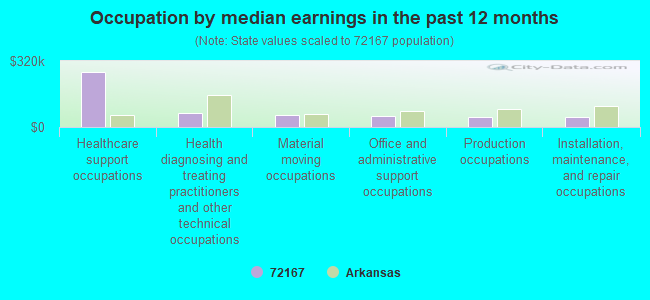
Occupation by median earnings in the past 12 months ($)
268,307Healthcare support occupations
66,125Health diagnosing and treating practitioners and other technical occupations
55,916Material moving occupations
51,699Office and administrative support occupations
50,869Production occupations
47,464Installation, maintenance, and repair occupations
Top industries in this zip code by the number of employees in 2005:
Administrative and Support and Waste Management and Remediation Services: Janitorial Services (5-9 employees: 1 establishment)
Construction: Electrical Contractors (1-4: 1)
Construction: New Single-Family Housing Construction (except Operative Builders) (1-4: 1)
Other Services (except Public Administration): Commercial and Industrial Machinery and Equipment (except Automotive and Electronic) Repair and Maintenance (1-4: 1)
Construction: Framing Contractors (1-4: 1)
Fatal accident statistics in 2013:
Fatal accident count: 1
Vehicles involved in fatal accidents: 1
Fatal accidents caused by drunken drivers: 1
Fatalities: 1
Persons involved in fatal accidents: 2
Pedestrians involved in fatal accidents: 0
Fatal accident statistics in 2012:
Fatal accident count: 1
Vehicles involved in fatal accidents: 1
Fatal accidents caused by drunken drivers: 0
Fatalities: 1
Persons involved in fatal accidents: 3
Pedestrians involved in fatal accidents: 0
Home Mortgage Disclosure Act Aggregated Statistics For Year 2009 (Based on 2 partial tracts)
A) FHA, FSA/RHS & VA Home Purchase Loans
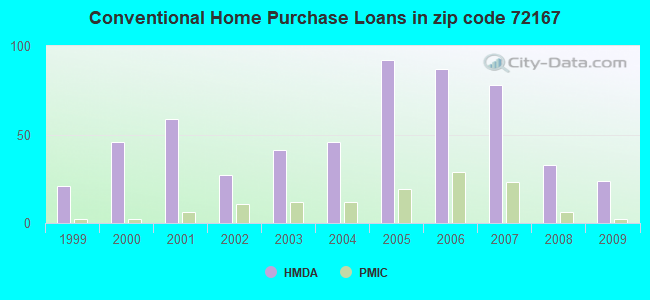
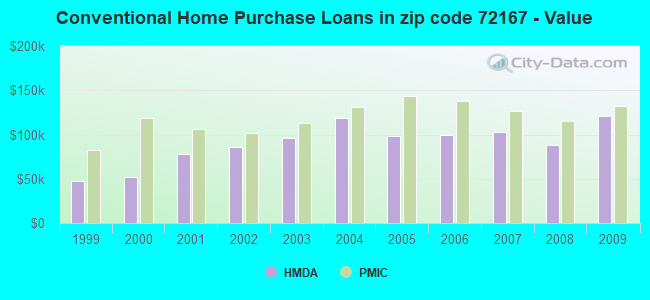
B) Conventional Home Purchase Loans
C) Refinancings
D) Home Improvement Loans
F) Non-occupant Loans on < 5 Family Dwellings (A B C & D)
G) Loans On Manufactured Home Dwelling (A B C & D)
Number
Average Value
Number
Average Value
Number
Average Value
Number
Average Value
Number
Average Value
Number
Average Value
LOANS ORIGINATED
67
$124,724
24
$121,159
68
$158,377
8
$34,882
11
$191,640
8
$45,561
APPLICATIONS APPROVED, NOT ACCEPTED
3
$127,463
4
$64,478
3
$88,410
0
$0
0
$0
5
$71,760
APPLICATIONS DENIED
12
$122,243
7
$49,164
20
$112,724
5
$19,690
1
$11,390
10
$45,318
APPLICATIONS WITHDRAWN
3
$143,737
2
$202,180
21
$124,365
2
$58,985
0
$0
2
$64,275
FILES CLOSED FOR INCOMPLETENESS
2
$187,535
1
$163,530
4
$133,022
1
$28,480
0
$0
0
$0
Aggregated Statistics For Year 2008 (Based on 2 partial tracts)
A) FHA, FSA/RHS & VA Home Purchase Loans
B) Conventional Home Purchase Loans
C) Refinancings
D) Home Improvement Loans
F) Non-occupant Loans on < 5 Family Dwellings (A B C & D)
G) Loans On Manufactured Home Dwelling (A B C & D)
Number
Average Value
Number
Average Value
Number
Average Value
Number
Average Value
Number
Average Value
Number
Average Value
LOANS ORIGINATED
37
$129,736
33
$88,288
52
$133,743
17
$32,496
15
$92,208
10
$42,389
APPLICATIONS APPROVED, NOT ACCEPTED
2
$87,460
3
$80,277
5
$98,934
1
$2,440
1
$81,360
4
$70,782
APPLICATIONS DENIED
7
$120,877
16
$79,122
28
$127,358
2
$21,155
4
$86,445
11
$41,642
APPLICATIONS WITHDRAWN
7
$92,983
4
$191,400
6
$97,632
1
$96,000
1
$73,220
0
$0
FILES CLOSED FOR INCOMPLETENESS
2
$192,010
0
$0
2
$133,430
0
$0
0
$0
0
$0
Aggregated Statistics For Year 2007 (Based on 2 partial tracts)
A) FHA, FSA/RHS & VA Home Purchase Loans
B) Conventional Home Purchase Loans
C) Refinancings
D) Home Improvement Loans
F) Non-occupant Loans on < 5 Family Dwellings (A B C & D)
G) Loans On Manufactured Home Dwelling (A B C & D)
Number
Average Value
Number
Average Value
Number
Average Value
Number
Average Value
Number
Average Value
Number
Average Value
LOANS ORIGINATED
15
$107,504
78
$103,348
40
$110,222
18
$29,651
24
$79,258
15
$38,456
APPLICATIONS APPROVED, NOT ACCEPTED
0
$0
7
$57,533
10
$116,752
2
$13,830
1
$24,410
6
$53,427
APPLICATIONS DENIED
2
$116,750
16
$78,563
20
$108,128
8
$8,645
8
$85,732
7
$67,761
APPLICATIONS WITHDRAWN
2
$107,395
8
$89,496
13
$131,615
0
$0
2
$104,140
0
$0
FILES CLOSED FOR INCOMPLETENESS
0
$0
1
$279,880
4
$139,330
1
$32,540
0
$0
0
$0
Aggregated Statistics For Year 2006 (Based on 2 partial tracts)
A) FHA, FSA/RHS & VA Home Purchase Loans
B) Conventional Home Purchase Loans
C) Refinancings
D) Home Improvement Loans
F) Non-occupant Loans on < 5 Family Dwellings (A B C & D)
G) Loans On Manufactured Home Dwelling (A B C & D)
Number
Average Value
Number
Average Value
Number
Average Value
Number
Average Value
Number
Average Value
Number
Average Value
LOANS ORIGINATED
21
$116,345
87
$99,643
50
$96,916
11
$19,526
15
$76,804
12
$45,222
APPLICATIONS APPROVED, NOT ACCEPTED
1
$58,580
17
$90,118
11
$95,783
2
$11,795
6
$134,515
9
$53,969
APPLICATIONS DENIED
2
$125,295
24
$69,665
24
$88,818
7
$10,229
5
$50,932
24
$54,172
APPLICATIONS WITHDRAWN
2
$130,175
6
$103,870
15
$134,678
1
$7,320
2
$68,340
1
$58,580
FILES CLOSED FOR INCOMPLETENESS
0
$0
1
$74,040
5
$171,182
0
$0
0
$0
0
$0
Aggregated Statistics For Year 2005 (Based on 2 partial tracts)
A) FHA, FSA/RHS & VA Home Purchase Loans
B) Conventional Home Purchase Loans
C) Refinancings
D) Home Improvement Loans
F) Non-occupant Loans on < 5 Family Dwellings (A B C & D)
G) Loans On Manufactured Home Dwelling (A B C & D)
Number
Average Value
Number
Average Value
Number
Average Value
Number
Average Value
Number
Average Value
Number
Average Value
LOANS ORIGINATED
20
$111,097
92
$97,756
48
$111,429
15
$36,069
13
$81,923
16
$62,088
APPLICATIONS APPROVED, NOT ACCEPTED
2
$111,465
7
$83,801
7
$90,774
1
$21,150
1
$54,510
5
$44,586
APPLICATIONS DENIED
1
$76,480
30
$72,980
24
$90,174
12
$28,476
3
$82,443
27
$51,619
APPLICATIONS WITHDRAWN
1
$36,610
5
$121,878
15
$92,371
2
$14,645
0
$0
0
$0
FILES CLOSED FOR INCOMPLETENESS
0
$0
2
$40,680
2
$48,410
1
$70,780
0
$0
0
$0
Aggregated Statistics For Year 2004 (Based on 2 partial tracts)
A) FHA, FSA/RHS & VA Home Purchase Loans
B) Conventional Home Purchase Loans
C) Refinancings
D) Home Improvement Loans
E) Loans on Dwellings For 5+ Families
F) Non-occupant Loans on < 5 Family Dwellings (A B C & D)
G) Loans On Manufactured Home Dwelling (A B C & D)
Number
Average Value
Number
Average Value
Number
Average Value
Number
Average Value
Number
Average Value
Number
Average Value
Number
Average Value
LOANS ORIGINATED
16
$101,852
46
$118,662
52
$86,914
11
$29,807
1
$87,870
12
$112,955
15
$43,989
APPLICATIONS APPROVED, NOT ACCEPTED
0
$0
7
$57,999
7
$65,669
2
$8,135
0
$0
0
$0
5
$32,218
APPLICATIONS DENIED
1
$55,320
15
$82,282
27
$88,532
8
$22,272
0
$0
2
$161,905
14
$64,565
APPLICATIONS WITHDRAWN
1
$52,070
4
$121,228
20
$100,927
2
$12,205
0
$0
0
$0
2
$80,955
FILES CLOSED FOR INCOMPLETENESS
0
$0
4
$149,500
4
$101,700
0
$0
0
$0
0
$0
1
$61,830
Aggregated Statistics For Year 2003 (Based on 2 partial tracts)
A) FHA, FSA/RHS & VA Home Purchase Loans
B) Conventional Home Purchase Loans
C) Refinancings
D) Home Improvement Loans
F) Non-occupant Loans on < 5 Family Dwellings (A B C & D)
Number
Average Value
Number
Average Value
Number
Average Value
Number
Average Value
Number
Average Value
LOANS ORIGINATED
15
$92,642
41
$96,005
81
$99,149
9
$12,837
8
$69,054
APPLICATIONS APPROVED, NOT ACCEPTED
1
$30,100
10
$111,545
18
$74,806
0
$0
0
$0
APPLICATIONS DENIED
2
$74,445
25
$59,914
43
$83,706
4
$3,865
1
$65,090
APPLICATIONS WITHDRAWN
3
$96,003
1
$57,770
16
$82,377
2
$69,565
0
$0
FILES CLOSED FOR INCOMPLETENESS
0
$0
2
$207,060
1
$47,190
0
$0
0
$0
Aggregated Statistics For Year 2002 (Based on 2 partial tracts)
A) FHA, FSA/RHS & VA Home Purchase Loans
B) Conventional Home Purchase Loans
C) Refinancings
D) Home Improvement Loans
F) Non-occupant Loans on < 5 Family Dwellings (A B C & D)
Number
Average Value
Number
Average Value
Number
Average Value
Number
Average Value
Number
Average Value
LOANS ORIGINATED
27
$91,244
27
$86,061
73
$105,634
18
$15,911
10
$47,921
APPLICATIONS APPROVED, NOT ACCEPTED
0
$0
15
$43,826
9
$101,790
0
$0
0
$0
APPLICATIONS DENIED
7
$87,520
22
$51,960
34
$86,553
11
$13,535
2
$19,525
APPLICATIONS WITHDRAWN
2
$61,425
4
$61,428
15
$97,903
0
$0
1
$39,870
FILES CLOSED FOR INCOMPLETENESS
0
$0
1
$26,040
3
$84,887
0
$0
0
$0
Aggregated Statistics For Year 2001 (Based on 2 partial tracts)
A) FHA, FSA/RHS & VA Home Purchase Loans
B) Conventional Home Purchase Loans
C) Refinancings
D) Home Improvement Loans
F) Non-occupant Loans on < 5 Family Dwellings (A B C & D)
Number
Average Value
Number
Average Value
Number
Average Value
Number
Average Value
Number
Average Value
LOANS ORIGINATED
17
$87,582
59
$78,092
63
$88,514
27
$12,445
9
$40,770
APPLICATIONS APPROVED, NOT ACCEPTED
0
$0
21
$60,788
11
$96,745
2
$24,410
2
$48,000
APPLICATIONS DENIED
0
$0
42
$40,622
24
$50,647
7
$20,107
2
$39,055
APPLICATIONS WITHDRAWN
2
$76,885
3
$45,290
22
$61,575
0
$0
0
$0
FILES CLOSED FOR INCOMPLETENESS
0
$0
0
$0
6
$95,327
0
$0
0
$0
Aggregated Statistics For Year 2000 (Based on 2 partial tracts)
A) FHA, FSA/RHS & VA Home Purchase Loans
B) Conventional Home Purchase Loans
C) Refinancings
D) Home Improvement Loans
F) Non-occupant Loans on < 5 Family Dwellings (A B C & D)
Number
Average Value
Number
Average Value
Number
Average Value
Number
Average Value
Number
Average Value
LOANS ORIGINATED
11
$79,067
46
$51,540
26
$63,430
18
$13,289
6
$28,747
APPLICATIONS APPROVED, NOT ACCEPTED
4
$40,272
19
$46,118
2
$53,700
3
$49,087
2
$31,325
APPLICATIONS DENIED
2
$68,750
40
$31,954
29
$45,000
7
$7,439
0
$0
APPLICATIONS WITHDRAWN
3
$60,477
2
$58,170
19
$54,725
2
$33,360
0
$0
FILES CLOSED FOR INCOMPLETENESS
0
$0
0
$0
5
$43,284
1
$40,680
0
$0
Aggregated Statistics For Year 1999 (Based on 1 partial tract)
A) FHA, FSA/RHS & VA Home Purchase Loans
B) Conventional Home Purchase Loans
C) Refinancings
D) Home Improvement Loans
F) Non-occupant Loans on < 5 Family Dwellings (A B C & D)
Detailed PMIC statistics for the following Tracts:0105.03
2002 - 2018 National Fire Incident Reporting System (NFIRS) incidents
Based on the data from the years 2002 - 2018 the average number of fire incidents per year is 19. The highest number of fires - 57 took place in 2010, and the least - 4 in 2008. The data has a growing trend.
When looking into fire subcategories, the most reports belonged to: Outside Fires (57.0%), and Structure Fires (38.1%).
Fire incident types reported to NFIRS in Zip Code 72167


 Nearest zip codes: 72015, 72128, 72129, 72104, 72011, 72019.


 Based on the data from the years 2002 - 2018 the average number of fire incidents per year is 19. The highest number of fires - 57 took place in 2010, and the least - 4 in 2008. The data has a growing trend.
 When looking into fire subcategories, the most reports belonged to: Outside Fires (57.0%), and Structure Fires (38.1%).