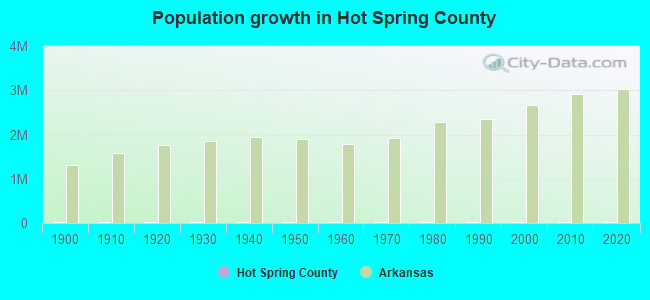
Hot Spring County, Arkansas (AR)
County owner-occupied free and clear houses and condos in 2010: 4,427
County owner-occupied houses and condos in 2000: 9,359
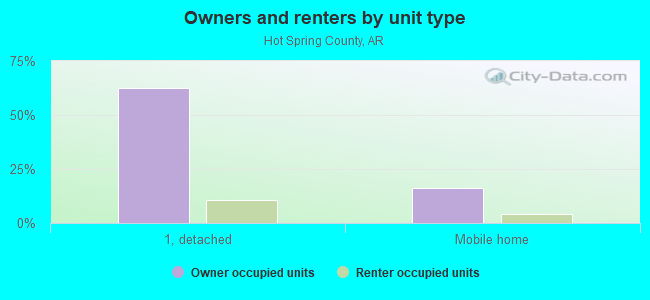
Renter-occupied apartments: 3,029 (it was 2,645 in 2000)
| % of renters here: | 22% |
| State: | 33% |
Land area: 615 sq. mi.
Water area: 7.2 sq. mi.
Population density: 54 people per square mile (average).
Industries providing employment: Educational, health and social services (21.5%), Retail trade (16.5%), Manufacturing (13.0%).
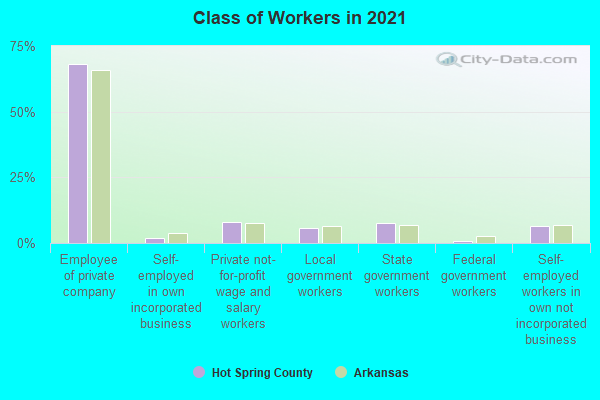
Type of workers:
- Private wage or salary: 80%
- Government: 13%
- Self-employed, not incorporated: 6%
- Unpaid family work: 1%
- OSM Map
- General Map
- Google Map
- MSN Map

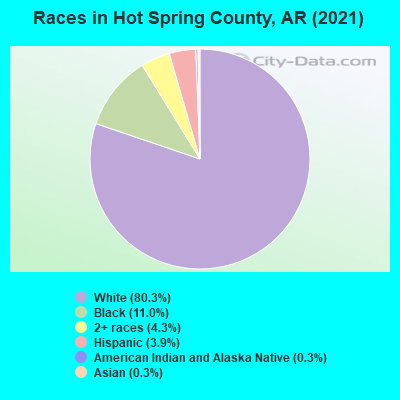
- 26,45880.6%White Non-Hispanic Alone
- 3,62911.1%Black Non-Hispanic Alone
- 1,3114.0%Hispanic or Latino
- 1,2333.8%Two or more races
- 1050.3%American Indian and Alaska Native alone
- 840.3%Asian alone
- 90.03%Native Hawaiian and Other
Pacific Islander alone - 80.02%Some other race alone
| Median resident age: | 43.2 years |
| Arkansas median age: | 38.9 years |
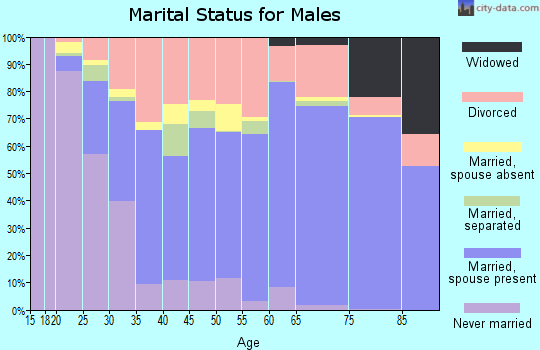
| Males: 17,772 | |
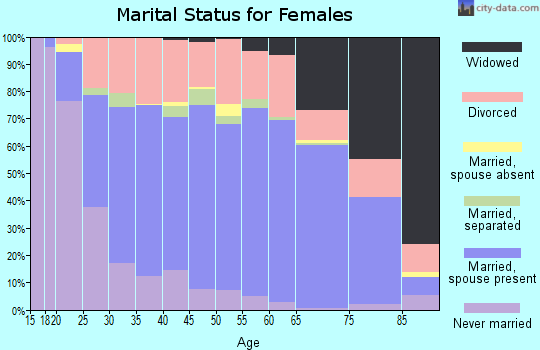
| Females: 15,652 |

 | Exploring Arkansas (1167 replies) |
| Lost Treasure in Arkansas - Fact, Folklore, and Fable (76 replies) |
| I am here!!! (22 replies) |
| Good place to buy a winter gettaway for under 50K? (41 replies) |
| UofArkansas student preparing to move to South Arkansas (24 replies) |
| Museums - small county (24 replies) |
| Hot Spring County: | 2.0 people |
| Arkansas: | 2 people |
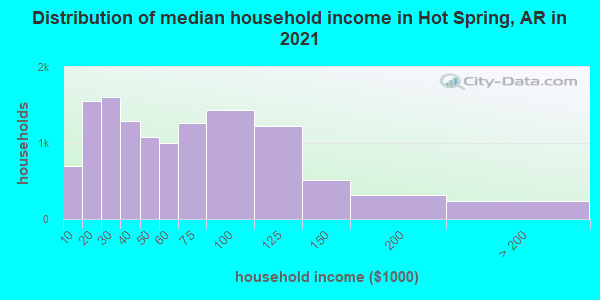
Estimated median household income in 2022: $49,454 ($31,543 in 1999)
| This county: | $49,454 |
| Arkansas: | $55,432 |
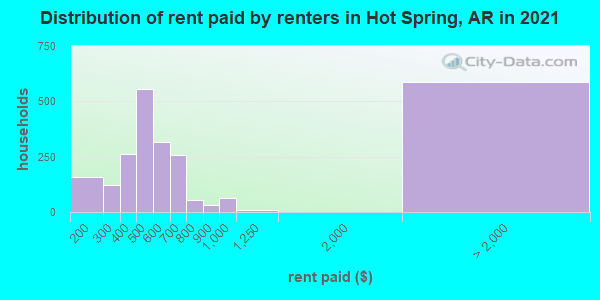
Median contract rent in 2022 for apartments: $507 (lower quartile is $389, upper quartile is $616)
| This county: | $507 |
| State: | $654 |
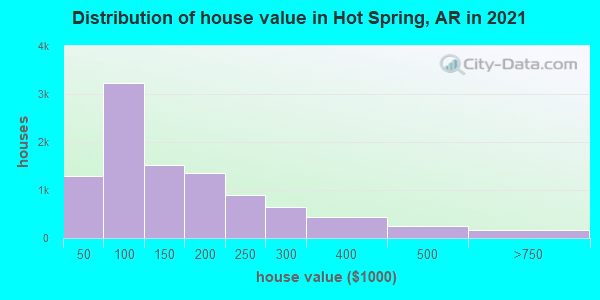
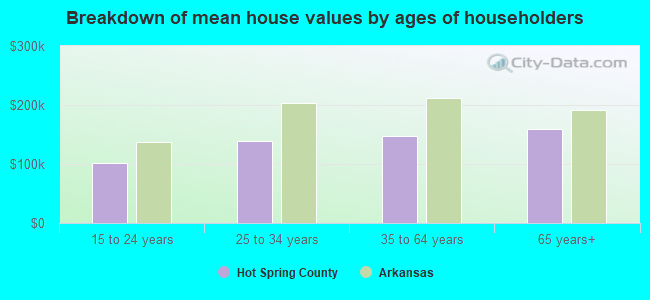
Estimated median house or condo value in 2022: $132,414 (it was $56,800 in 2000)
| Hot Spring: | $132,414 |
| Arkansas: | $179,800 |
Median monthly housing costs for homes and condos with a mortgage: $1,070
Median monthly housing costs for units without a mortgage: $358
Institutionalized population: 1,571
Crime in 2021 (reported by the sheriff's office or county police, not the county total):
- Murders: 2
- Rapes: 0
- Robberies: 0
- Assaults: 22
- Burglaries: 61
- Thefts: 24
- Auto thefts: 37
Crime in 2017 (reported by the sheriff's office or county police, not the county total):
- Murders: 3
- Rapes: 2
- Robberies: 3
- Assaults: 30
- Burglaries: 52
- Thefts: 122
- Auto thefts: 31
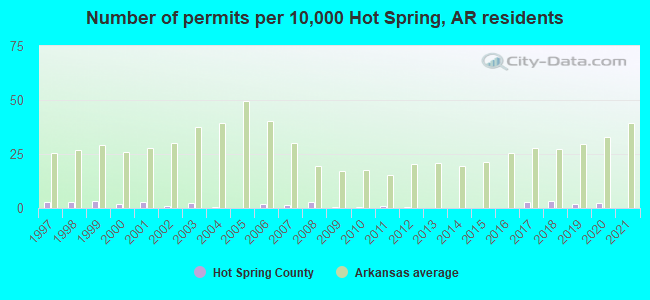
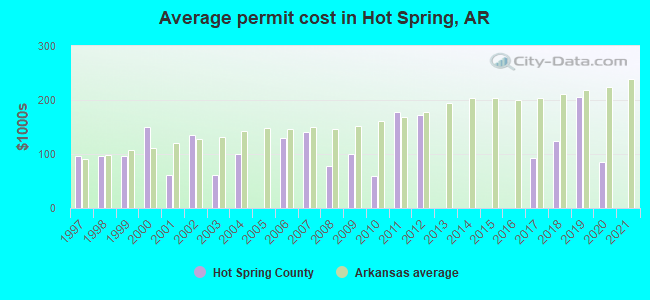
Single-family new house construction building permits:
- 2022: 3 buildings, average cost: $241,300
- 2021: 0 buildings
- 2020: 7 buildings, average cost: $85,700
- 2019: 5 buildings, average cost: $204,900
- 2018: 10 buildings, average cost: $125,000
- 2017: 9 buildings, average cost: $92,800
- 2016: 0 buildings
- 2015: 0 buildings
- 2014: 0 buildings
- 2013: 0 buildings
- 2012: 1 building, cost: $172,000
- 2011: 3 buildings, average cost: $176,800
- 2010: 2 buildings, average cost: $59,500
- 2009: 2 buildings, average cost: $100,000
- 2008: 8 buildings, average cost: $76,700
- 2007: 4 buildings, average cost: $139,800
- 2006: 6 buildings, average cost: $130,300
- 2005: 0 buildings
- 2004: 1 building, cost: $100,000
- 2003: 7 buildings, average cost: $62,300
- 2002: 3 buildings, average cost: $134,700
- 2001: 9 buildings, average cost: $60,600
- 2000: 5 buildings, average cost: $150,000
- 1999: 10 buildings, average cost: $97,300
- 1998: 9 buildings, average cost: $97,300
- 1997: 9 buildings, average cost: $97,300
Median real estate property taxes paid for housing units with mortgages in 2022: $803 (0.5%)
Median real estate property taxes paid for housing units with no mortgage in 2022: $558 (0.5%)
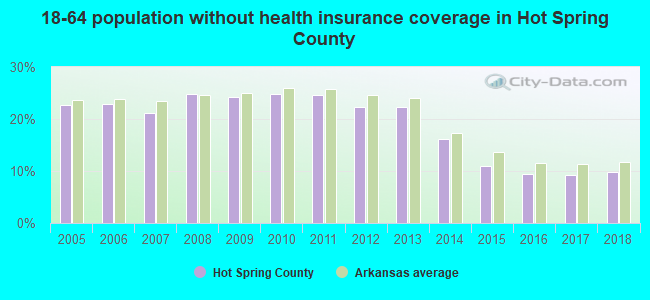
| Hot Spring County: | 20.4% |
| Arkansas: | 16.8% |
Median age of residents in 2022: 43.2 years old
(Males: 40.9 years old, Females: 45.1 years old)
(Median age for: White residents: 45.0 years old, Black residents: 36.8 years old, American Indian residents: 62.4 years old, Asian residents: 35.7 years old, Hispanic or Latino residents: 40.1 years old, Other race residents: 44.4 years old)
Fair market rent in 2006 for a 1-bedroom apartment in Hot Spring County is $381 a month.
Fair market rent for a 2-bedroom apartment is $456 a month.
Fair market rent for a 3-bedroom apartment is $598 a month.
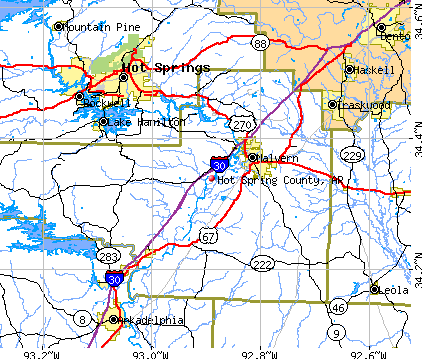
Cities in this county include: Malvern, Rockport, Donaldson, Friendship, Perla, Magnet Cove.
Neighboring counties: Navajo County, Arizona  , Grundy County, Tennessee
  , Lamar County, Alabama , Smyth County, Virginia
  , McDuffie County, Georgia , Jack County, Texas
  .
.
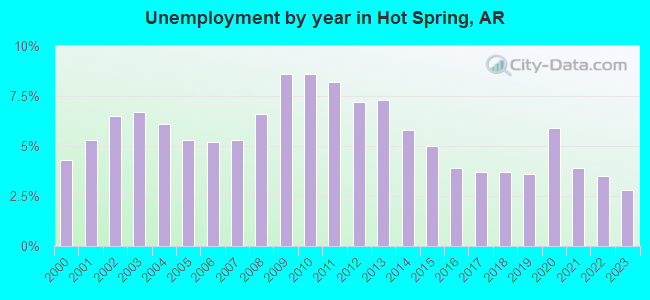
| Here: | 3.9% |
| Arkansas: | 3.4% |
Current college students: 1,005
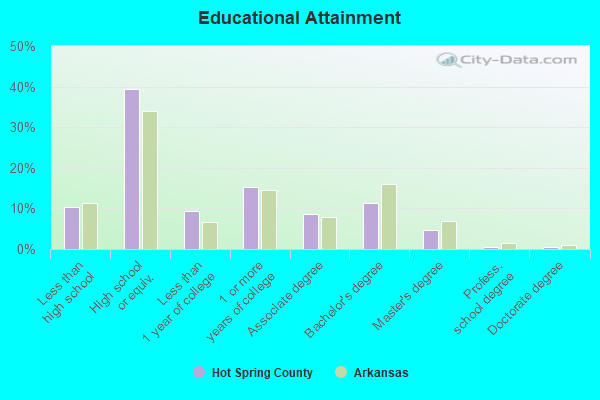
People 25 years of age or older with a high school degree or higher: 88.5%
People 25 years of age or older with a bachelor's degree or higher: 15.5%
Number of foreign born residents: 382 (69.4% naturalized citizens)
| Hot Spring County: | 1.1% |
| Whole state: | 5.1% |
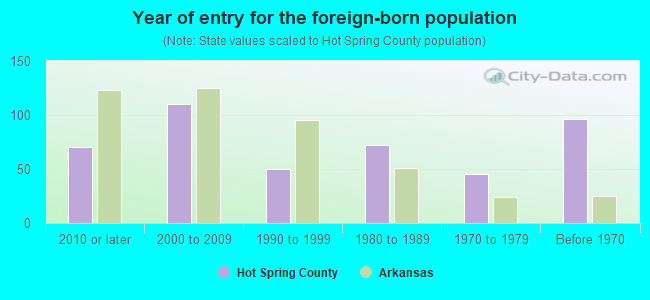
- Year of entry for the foreign-born population
- 682010 or later
- 292000 to 2009
- 2181990 to 1999
- 721980 to 1989
- 451970 to 1979
- 96Before 1970
Mean travel time to work (commute): minutes
Percentage of county residents living and working in this county: 99.5%
Housing units in structures:
- One, detached: 10,296
- One, attached: 42
- Two: 228
- 3 or 4: 149
- 5 to 9: 219
- 10 to 19: 162
- 50 or more: 18
- Mobile homes: 3,255
- Boats, RVs, vans, etc.: 56
Housing units in Hot Spring County with a mortgage: 4,687 (84 second mortgage, 11 home equity loan, 66 both second mortgage and home equity loan)
Houses without a mortgage: 66
| Here: | 5.7% with mortgage |
| State: | 98.4% with mortgage |
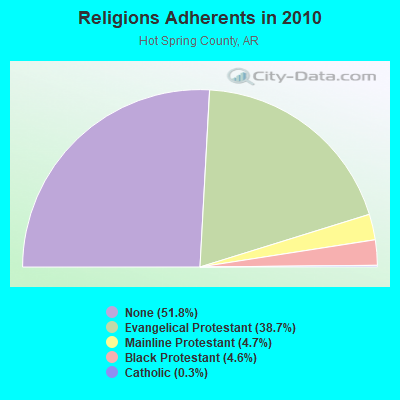
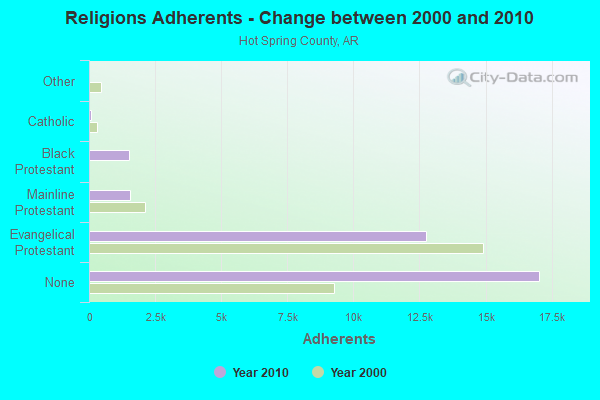
Religion statistics for Hot Spring County
| Religion | Adherents | Congregations |
|---|---|---|
| Evangelical Protestant | 12,736 | 72 |
| Mainline Protestant | 1,552 | 13 |
| Black Protestant | 1,505 | 7 |
| Catholic | 90 | 1 |
| Other | 2 | 1 |
| None | 17,038 | - |
Source: Clifford Grammich, Kirk Hadaway, Richard Houseal, Dale E.Jones, Alexei Krindatch, Richie Stanley and Richard H.Taylor. 2012. 2010 U.S.Religion Census: Religious Congregations & Membership Study. Association of Statisticians of American Religious Bodies. Jones, Dale E., et al. 2002. Congregations and Membership in the United States 2000. Nashville, TN: Glenmary Research Center.
Food Environment Statistics:
| Hot Spring County: | 1.88 / 10,000 pop. |
| State: | 2.02 / 10,000 pop. |
| This county: | 1.57 / 10,000 pop. |
| Arkansas: | 0.59 / 10,000 pop. |
| Hot Spring County: | 3.77 / 10,000 pop. |
| Arkansas: | 4.94 / 10,000 pop. |
| This county: | 4.08 / 10,000 pop. |
| State: | 6.66 / 10,000 pop. |
| Hot Spring County: | 9.7% |
| Arkansas: | 9.8% |
| Hot Spring County: | 31.6% |
| State: | 29.1% |
| Here: | 14.0% |
| State: | 13.6% |
Agriculture in Hot Spring County:
Average size of farms: 153 acresAverage value of agricultural products sold per farm: $22,637
Average value of crops sold per acre for harvested cropland: $76.28
The value of livestock, poultry, and their products as a percentage of the total market value of agricultural products sold: 89.58%
Average total farm production expenses per farm: $16,976
Harvested cropland as a percentage of land in farms: 20.21%
Average market value of all machinery and equipment per farm: $31,484
The percentage of farms operated by a family or individual: 94.65%
Average age of principal farm operators: 57 years
Average number of cattle and calves per 100 acres of all land in farms: 21.34
Milk cows as a percentage of all cattle and calves: 1.37%
Vegetables: 41 harvested acres
Land in orchards: 19 acres
Earthquake activity:
Hot Spring County-area historical earthquake activity is significantly above Arkansas state average. It is 476% greater than the overall U.S. average.On 11/6/2011 at 03:53:10, a magnitude 5.7 (5.7 MW, Depth: 3.2 mi, Class: Moderate, Intensity: VI - VII) earthquake occurred 234.7 miles away from Hot Spring County center
On 9/3/2016 at 12:02:44, a magnitude 5.8 (5.8 MW, Depth: 3.5 mi) earthquake occurred 269.6 miles away from the county center
On 1/21/1982 at 00:33:54, a magnitude 4.7 (4.5 MB, 4.7 LG, 4.5 LG, Class: Light, Intensity: IV - V) earthquake occurred 69.5 miles away from the county center
On 2/28/2011 at 05:00:50, a magnitude 4.7 (4.7 MW, Depth: 2.0 mi) earthquake occurred 71.3 miles away from the county center
On 5/4/2001 at 06:42:12, a magnitude 4.7 (4.2 MB, 4.7 LG, 4.5 LG) earthquake occurred 71.9 miles away from Hot Spring County center
On 3/25/1976 at 00:41:20, a magnitude 5.0 (4.9 MB, 5.0 LG) earthquake occurred 170.9 miles away from the county center
Magnitude types: regional Lg-wave magnitude (LG), body-wave magnitude (MB), moment magnitude (MW)
Most recent natural disasters:
- Arkansas Covid-19 Pandemic, Incident Period: January 20, 2020, FEMA Id: 4518, Natural disaster type: Other
- Arkansas Severe Winter Storm, Incident Period: December 25, 2012 to December 26, 2012, Major Disaster (Presidential) Declared DR-4100: January 29, 2013, FEMA Id: 4100, Natural disaster type: Winter Storm
- Arkansas Severe Storms, Tornadoes, and Associated Flooding, Incident Period: April 14, 2011 to June 03, 2011, Major Disaster (Presidential) Declared DR-1975: May 02, 2011, FEMA Id: 1975, Natural disaster type: Storm, Tornado, Flood
- Arkansas Severe Storms and Flooding associated with Hurricane Gustav, Incident Period: September 02, 2008 to September 08, 2008, Major Disaster (Presidential) Declared DR-1793: September 18, 2008, FEMA Id: 1793, Natural disaster type: Storm, Hurricane, Flood
- Arkansas Severe Storms, Tornadoes, and Flooding, Incident Period: March 18, 2008 to April 28, 2008, Major Disaster (Presidential) Declared DR-1751: March 26, 2008, FEMA Id: 1751, Natural disaster type: Storm, Tornado, Flood
- Arkansas Hurricane Katrina, Incident Period: August 29, 2005 to October 01, 2005, Emergency Declared EM-3215: September 02, 2005, FEMA Id: 3215, Natural disaster type: Hurricane
- Arkansas Severe Storms & Flooding, Incident Period: February 14, 2001 to March 21, 2001, Major Disaster (Presidential) Declared DR-1363: March 13, 2001, FEMA Id: 1363, Natural disaster type: Storm, Flood
- Arkansas Severe Winter Storm, Incident Period: December 12, 2000 to January 08, 2001, Major Disaster (Presidential) Declared DR-1354: December 29, 2000, FEMA Id: 1354, Natural disaster type: Winter Storm
- Arkansas Severe Winter Storm, Incident Period: December 12, 2000 to January 08, 2001, Emergency Declared EM-3159: December 28, 2000, FEMA Id: 3159, Natural disaster type: Winter Storm
- Arkansas Severe Storms/Tornadoes, Incident Period: March 01, 1997 to March 04, 1997, Major Disaster (Presidential) Declared DR-1162: March 02, 1997, FEMA Id: 1162, Natural disaster type: Storm, Tornado
- 3 other natural disasters have been reported since 1953.
The number of natural disasters in Hot Spring County (13) is near the US average (15).
Major Disasters (Presidential) Declared: 10
Emergencies Declared: 2
Causes of natural disasters: Storms: 8, Floods: 6, Tornadoes: 5, Winter Storms: 3, Hurricanes: 2, Other: 1 (Note: some incidents may be assigned to more than one category).
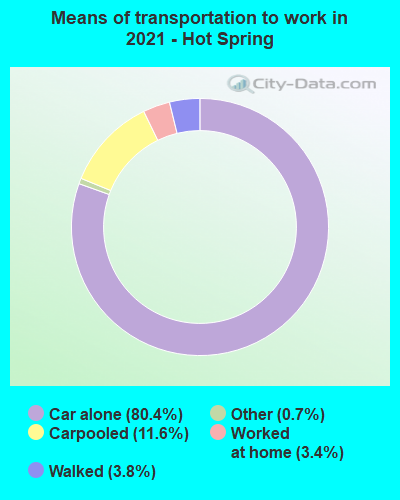
Means of transportation to work:
- Drove a car alone: 6,979 (80.9%)
- Carpooled: 810 (9.4%)
- Bus: 1 (0.0%)
- Taxicab, motorcycle, or other means: 75 (0.9%)
- Bicycle: 1 (0.0%)
- Walked: 266 (3.1%)
- Worked at home: 410 (4.8%)
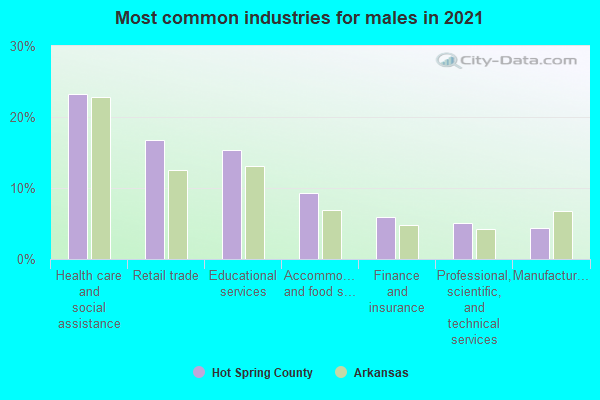
- Health care and social assistance (22%)
- Retail trade (15%)
- Educational services (12%)
- Accommodation and food services (7%)
- Professional, scientific, and technical services (6%)
- Manufacturing (5%)
- Public administration (5%)
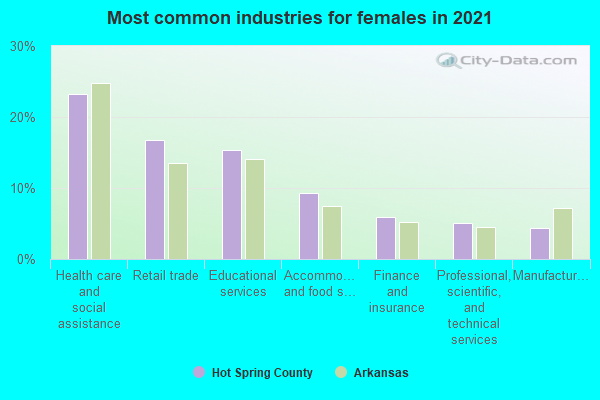
- Health care and social assistance (24%)
- Retail trade (16%)
- Educational services (13%)
- Accommodation and food services (8%)
- Professional, scientific, and technical services (6%)
- Manufacturing (6%)
- Public administration (6%)
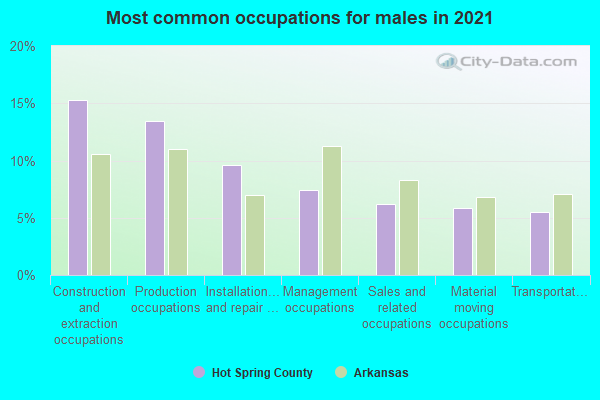
- Construction and extraction occupations (14%)
- Production occupations (12%)
- Management occupations (9%)
- Sales and related occupations (9%)
- Installation, maintenance, and repair occupations (8%)
- Material moving occupations (7%)
- Transportation occupations (6%)
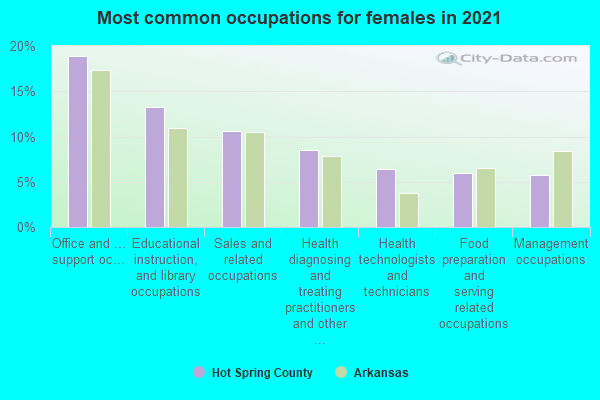
- Office and administrative support occupations (20%)
- Educational instruction, and library occupations (11%)
- Sales and related occupations (10%)
- Health diagnosing and treating practitioners and other technical occupations (7%)
- Building and grounds cleaning and maintenance occupations (6%)
- Management occupations (6%)
- Health technologists and technicians (6%)
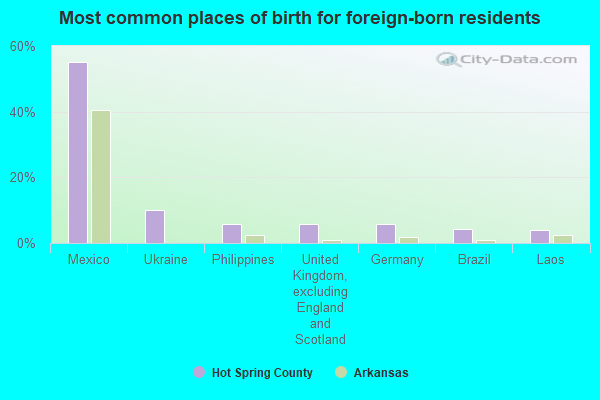
- Mexico (71%)
- Bahamas (7%)
- Philippines (4%)
- United Kingdom, excluding England and Scotland (4%)
- Brazil (3%)
- Germany (3%)
- Canada (2%)
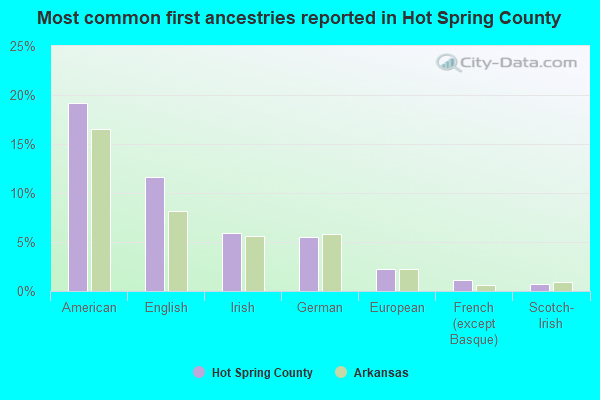
- American (20%)
- English (13%)
- German (6%)
- Irish (5%)
- European (3%)
- Scottish (1%)
- Scotch-Irish (1%)
People in group quarters in Hot Spring County, Arkansas in 2010:
- 1,092 people in state prisons
- 276 people in correctional facilities intended for juveniles
- 203 people in nursing facilities/skilled-nursing facilities
People in group quarters in Hot Spring County, Arkansas in 2000:
- 252 people in nursing homes
- 58 people in other noninstitutional group quarters
- 18 people in mental (psychiatric) hospitals or wards
- 17 people in homes for the mentally ill
- 10 people in local jails and other confinement facilities (including police lockups)
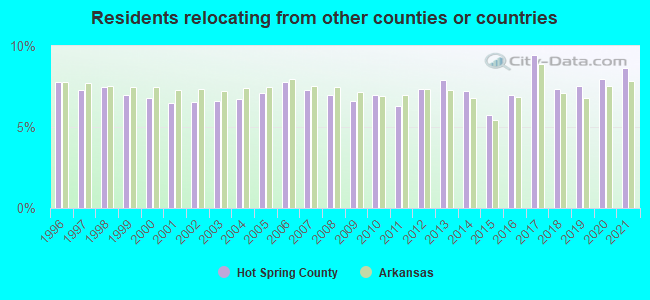
8.63% of this county's 2021 resident taxpayers lived in other counties in 2020 ($38,861 average adjusted gross income)
| Here: | 8.63% |
| Arkansas average: | 7.82% |
10 or fewer of this county's residents moved from foreign countries.
6.71% relocated from other counties in Arkansas ($28,426 average AGI)
1.92% relocated from other states ($10,436 average AGI)
Hot Spring County: 1.92% Arkansas average: 3.41%
Top counties from which taxpayers relocated into this county between 2020 and 2021:
| from Garland County, AR | |
| from Saline County, AR | |
| from Pulaski County, AR | |
| from Clark County, AR | |
| from Jefferson County, AR | |
| from Grant County, AR |
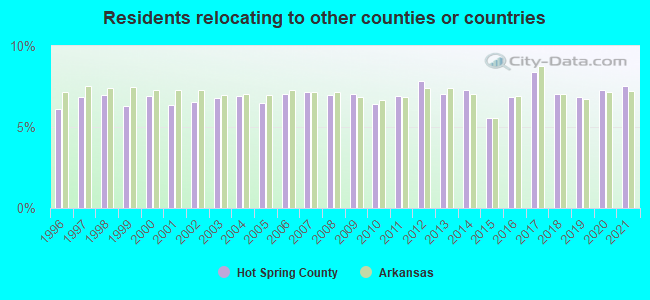
7.55% of this county's 2020 resident taxpayers moved to other counties in 2021 ($39,450 average adjusted gross income)
| Here: | 7.55% |
| Arkansas average: | 7.23% |
10 or fewer of this county's residents moved to foreign countries.
6.34% relocated to other counties in Arkansas ($33,019 average AGI)
1.21% relocated to other states ($6,431 average AGI)
Hot Spring County: 1.21% Arkansas average: 2.79%
Top counties to which taxpayers relocated from this county between 2020 and 2021:
| to Garland County, AR | |
| to Saline County, AR | |
| to Pulaski County, AR | |
| to Clark County, AR | |
| to Grant County, AR |
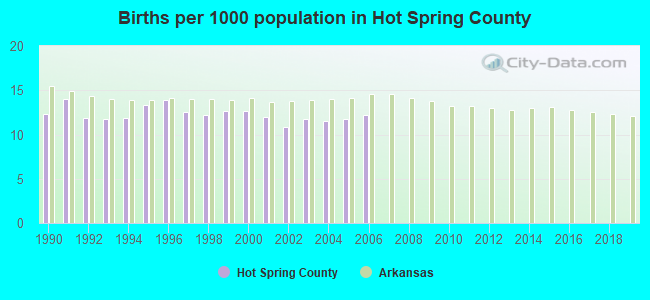
Births per 1000 population from 1990 to 1999: 12.6
Births per 1000 population from 2000 to 2006: 11.8
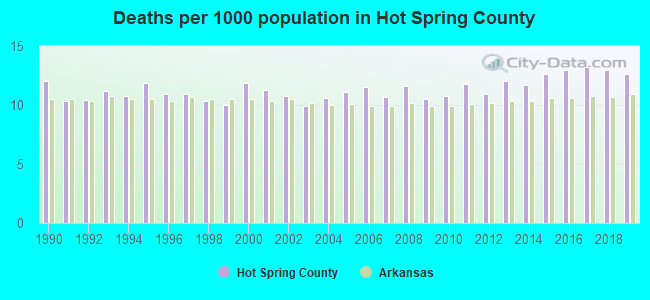
Deaths per 1000 population from 1990 to 1999: 10.9
Deaths per 1000 population from 2000 to 2009: 11.0
Deaths per 1000 population from 2010 to 2020: 12.5
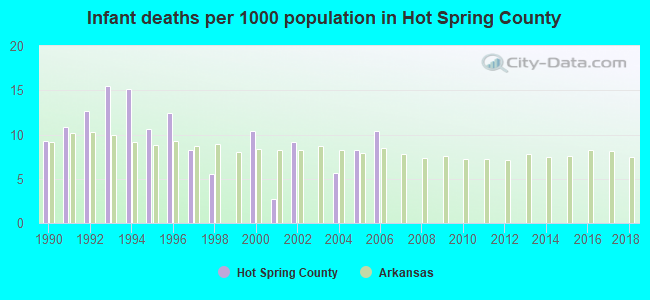
Infant deaths per 1000 live births from 1990 to 1999: 10.0
Infant deaths per 1000 live births from 2000 to 2006: 6.6
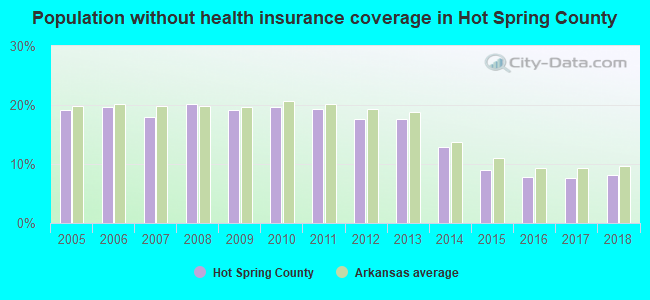
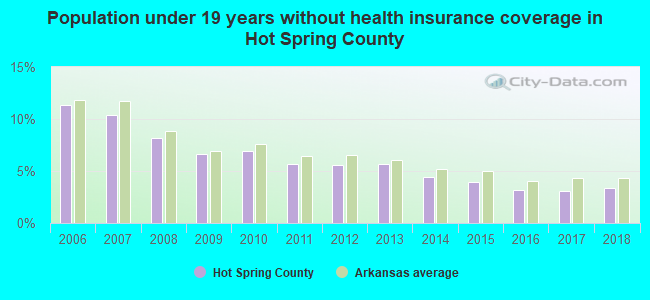
Persons under 19 years old without health insurance coverage in 2018: 3.4%
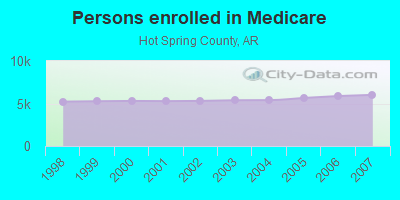
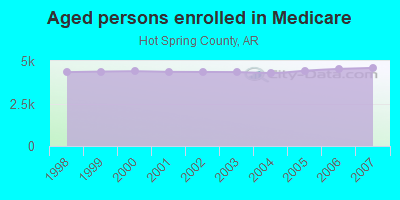
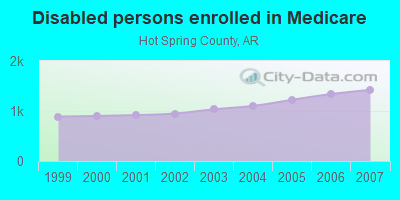
Persons enrolled in hospital insurance and/or supplemental medical insurance (Medicare) in July 1, 2007: 6,015 (4,593 aged, 1,422 disabled)
Children under 18 without health insurance coverage in 2007: 726 (10%)
Most common underlying causes of death in Hot Spring County, Arkansas in 1999 - 2019:
- Bronchus or lung, unspecified - Malignant neoplasms (588)
- Acute myocardial infarction, unspecified (521)
- Atherosclerotic heart disease (491)
- Chronic obstructive pulmonary disease, unspecified (331)
- Stroke, not specified as haemorrhage or infarction (223)
- Alzheimer disease, unspecified (144)
- Unspecified dementia (117)
- Congestive heart failure (110)
- Chronic ischaemic heart disease, unspecified (91)
- Pneumonia, unspecified (77)
Population without health insurance coverage in 2000: 14%
Children under 18 without health insurance coverage in 2000: 11%
Suicides per 1,000,000 population from 2000 to 2006: 177.0. This is less than state average.
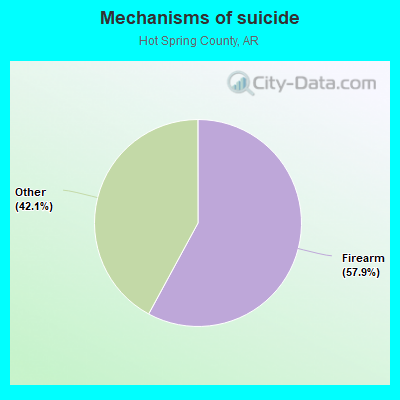
- Firearm - 102.5
- Other - 74.5
Household type by relationship:
Households: 33,424- Male householders: 5,695 (1,538 living alone), Female householders: 6,659 (1,986 living alone)
6,453 spouses (6,257 opposite-sex spouses), 569 unmarried partners, (532 opposite-sex unmarried partners), 8,693 children (7,676 natural, 357 adopted, 659 stepchildren), 1,209 grandchildren, 347 brothers or sisters, 453 parents, 0 foster children, 572 other relatives, 542 non-relatives
- In group quarters: 2,264
Size of family households: 4,168 2-persons, 1,807 3-persons, 1,443 4-persons, 617 5-persons, 243 6-persons, 138 7-or-more-persons.
Size of nonfamily households: 3,526 1-person, 388 2-persons, 3 3-persons.
3,996 married couples with children.
1,682 single-parent households (607 men, 1,075 women).
95.5% of residents of Hot Spring speak English at home.
3.6% of residents speak Spanish at home (73% speak English very well, 27% speak English well).
0.3% of residents speak other Indo-European language at home (63% speak English very well, 22% speak English well, 15% speak English not well).
0.3% of residents speak Asian or Pacific Island language at home (61% speak English very well, 33% speak English well, 6% speak English not well).
In fiscal year 2004:
Federal Government expenditure: $169,587,000 ($5,537 per capita)
Department of Defense expenditure: $14,929,000
Federal direct payments to individuals for retirement and disability: $83,539,000
Federal other direct payments to individuals: $44,227,000
Federal direct payments not to individuals: $640,000
Federal grants: $25,416,000
Federal procurement contracts: $4,127,000 ($2,879,000 Department of Defense)
Federal salaries and wages: $11,638,000 ($7,536,000 Department of Defense)
Federal Government direct loans: $637,000
Federal guaranteed/insured loans: $6,651,000
Federal Government insurance: $6,875,000
Population change from April 1, 2000 to July 1, 2005:
Births: 1,883| Here: | 60 per 1000 residents |
| State: | 72 per 1000 residents |
Deaths: 1,688
| Here: | 54 per 1000 residents |
| State: | 53 per 1000 residents |
Net international migration: +121
| Here: | +4 per 1000 residents |
| State: | +8 per 1000 residents |
Net internal migration: +640
| Here: | +20 per 1000 residents |
| State: | +13 per 1000 residents |
Total withdrawal of fresh water for public supply: 2.19 millions of gallons per day (all from surface)
| Here: | 6.0 |
| State: | 6.1 |
| Here: | 4.8 |
| State: | 4.3 |
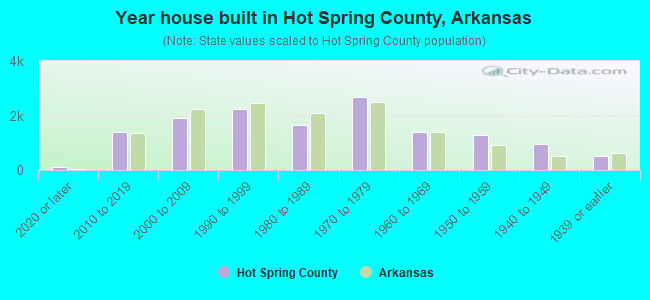
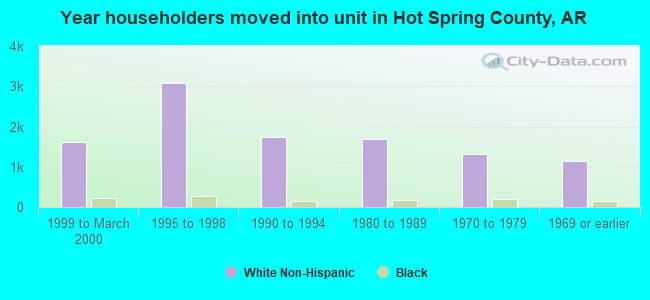
- Year house built in Hot Spring County, Arkansas
- 982020 or later
- 1,4052010 to 2019
- 1,7732000 to 2009
- 2,0161990 to 1999
- 1,8151980 to 1989
- 2,6221970 to 1979
- 1,7161960 to 1969
- 1,2921950 to 1959
- 9761940 to 1949
- 4101939 or earlier
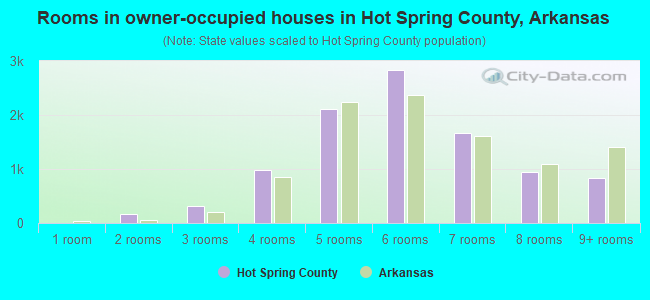
- Rooms in owner-occupied houses in Hot Spring County, Arkansas
- 51 room
- 1422 rooms
- 4703 rooms
- 9644 rooms
- 2,2325 rooms
- 2,4926 rooms
- 1,7327 rooms
- 9128 rooms
- 8339+ rooms
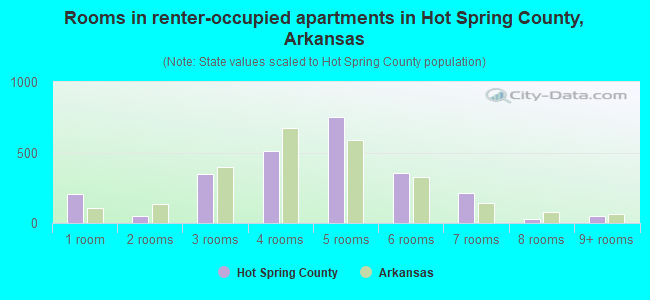
- Rooms in renter-occupied apartments in Hot Spring County, Arkansas
- 2051 room
- 192 rooms
- 1623 rooms
- 6494 rooms
- 7635 rooms
- 4296 rooms
- 2057 rooms
- 528 rooms
- 469+ rooms
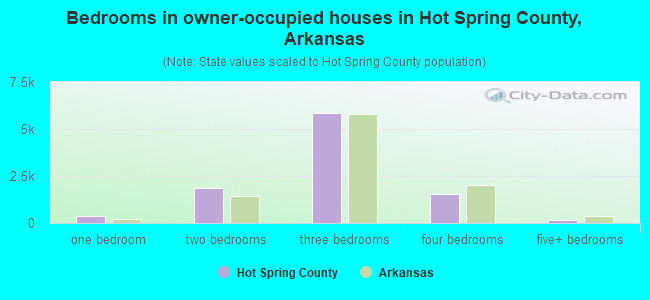
- Bedrooms in owner-occupied houses in Hot Spring County, Arkansas
- 5no bedroom
- 4061 bedroom
- 2,0152 bedrooms
- 5,7423 bedrooms
- 1,3694 bedrooms
- 1925+ bedrooms
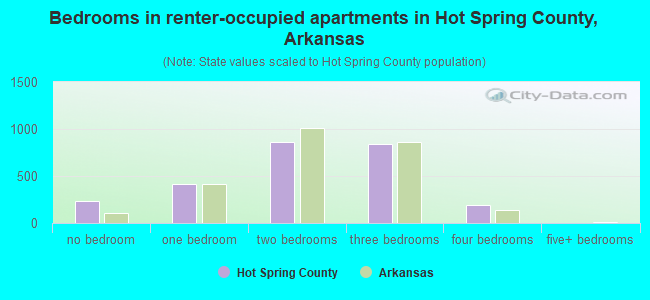
- Bedrooms in renter-occupied apartments in Hot Spring County, Arkansas
- 207no bedroom
- 2591 bedroom
- 1,0662 bedrooms
- 8303 bedrooms
- 2294 bedrooms
- 45+ bedrooms
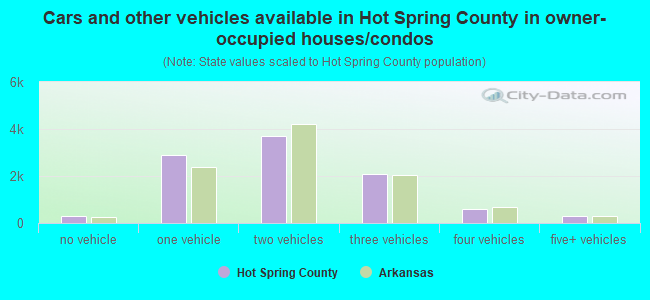
- Cars and other vehicles available in Hot Spring County in owner-occupied houses/condos
- 327no vehicle
- 2,7261 vehicle
- 3,8452 vehicles
- 1,8903 vehicles
- 6474 vehicles
- 3135+ vehicles
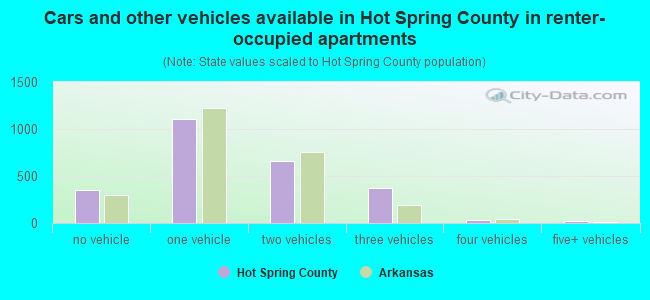
- Cars and other vehicles available in Hot Spring County in renter-occupied apartments
- 452no vehicle
- 1,0961 vehicle
- 6542 vehicles
- 3443 vehicles
- 184 vehicles
- 355+ vehicles
89.8% of Hot Spring County residents lived in the same house 1 years ago.
Out of people who lived in different houses, 28% lived in this county.
Out of people who lived in different counties, 76% lived in Arkansas.
| Hot Spring County: | 89.8% |
| State average: | 87.0% |
Place of birth for U.S.-born residents:
- This state: 24,760
- Other state: 8,017
- Northeast: 435
- Midwest: 1,501
- South: 3,815
- West: 2,313
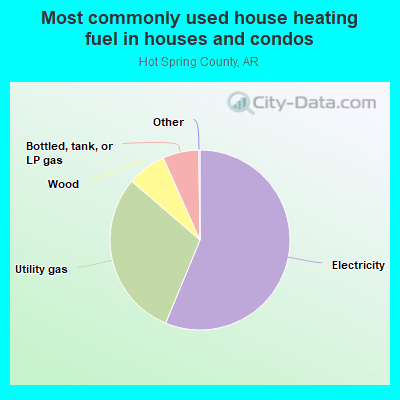
- 55.5%Electricity
- 30.4%Utility gas
- 7.5%Wood
- 6.1%Bottled, tank, or LP gas
- 0.2%No fuel used
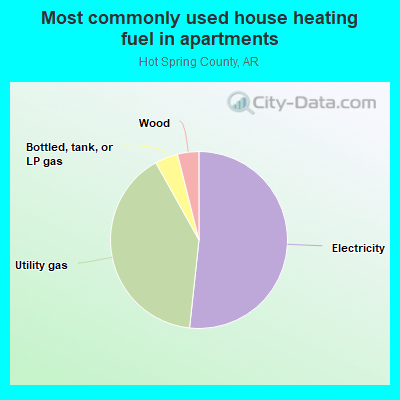
- 54.4%Electricity
- 37.6%Utility gas
- 4.6%Wood
- 3.0%Bottled, tank, or LP gas
- 0.4%No fuel used
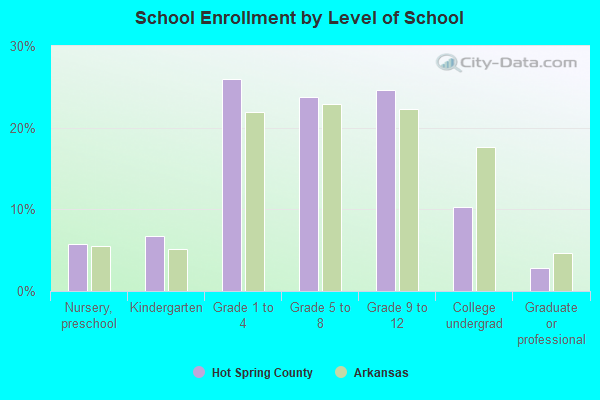
Private vs. public school enrollment:
| Here: | 4.9% |
| Arkansas: | 10.5% |
| Here: | 7.1% |
| Arkansas: | 8.7% |
| Here: | 9.1% |
| Arkansas: | 19.4% |
Hot Spring County government finances - Expenditure in 2018:
- Charges - Other: $544,000
Other: $408,000
- Construction - Health - Other: $226,000
- Current Operations - Regular Highways: $3,435,000
Regular Highways: $2,407,000
Police Protection: $1,059,000
Police Protection: $977,000
Correctional Institutions: $858,000
General - Other: $830,000
Correctional Institutions: $824,000
Central Staff Services: $803,000
General - Other: $750,000
Central Staff Services: $726,000
Financial Administration: $672,000
Financial Administration: $539,000
Libraries: $520,000
Judicial and Legal Services: $488,000
General Public Buildings: $445,000
Judicial and Legal Services: $406,000
Libraries: $404,000
General Public Buildings: $368,000
Protective Inspection and Regulation - Other: $366,000
Protective Inspection and Regulation - Other: $338,000
Public Welfare - Other: $120,000
Public Welfare - Other: $97,000
Health - Other: $57,000
Local Fire Protection: $44,000
Parks and Recreation: $42,000
Health - Other: $33,000
Local Fire Protection: $30,000
Solid Waste Management: $21,000
Solid Waste Management: $20,000
- Federal Intergovernmental - General Local Government Support: $67,000
General Local Government Support: $65,000
Other: $29,000
Other: $23,000
Highways: $1,000
Highways: $1,000
- Intergovernmental to Local - Other - Solid Waste Management: $2,078,000
Other - Solid Waste Management: $1,812,000
Other - General - Other: $1,488,000
Other - General - Other: $1,229,000
- Local Intergovernmental - Other: $173,000
Other: $96,000
- Miscellaneous - General Revenue - Other: $700,000
General Revenue - Other: $512,000
Fines and Forfeits: $509,000
Fines and Forfeits: $436,000
Rents: $279,000
Rents: $266,000
Interest Earnings: $257,000
Interest Earnings: $86,000
- Other Capital Outlay - Regular Highways: $112,000
General - Other: $51,000
General - Other: $38,000
- Other Funds - Cash and Securities: $11,819,000
Cash and Securities: $10,898,000
- State Intergovernmental - Highways: $1,861,000
Highways: $1,844,000
General Local Government Support: $774,000
General Local Government Support: $748,000
Health and Hospitals: $226,000
Other: $224,000
Other: $166,000
Health and Hospitals: $30,000
- Tax - General Sales and Gross Receipts: $5,192,000
General Sales and Gross Receipts: $4,948,000
Property: $4,108,000
Property: $4,039,000
Public Utilities Sales: $283,000
Public Utilities Sales: $279,000
Hot Spring County government finances - Revenue in 2018:
- Charges - Other: $544,000
Other: $408,000
- Construction - Health - Other: $226,000
- Current Operations - Regular Highways: $3,435,000
Regular Highways: $2,407,000
Police Protection: $1,059,000
Police Protection: $977,000
Correctional Institutions: $858,000
General - Other: $830,000
Correctional Institutions: $824,000
Central Staff Services: $803,000
General - Other: $750,000
Central Staff Services: $726,000
Financial Administration: $672,000
Financial Administration: $539,000
Libraries: $520,000
Judicial and Legal Services: $488,000
General Public Buildings: $445,000
Judicial and Legal Services: $406,000
Libraries: $404,000
General Public Buildings: $368,000
Protective Inspection and Regulation - Other: $366,000
Protective Inspection and Regulation - Other: $338,000
Public Welfare - Other: $120,000
Public Welfare - Other: $97,000
Health - Other: $57,000
Local Fire Protection: $44,000
Parks and Recreation: $42,000
Health - Other: $33,000
Local Fire Protection: $30,000
Solid Waste Management: $21,000
Solid Waste Management: $20,000
- Federal Intergovernmental - General Local Government Support: $67,000
General Local Government Support: $65,000
Other: $29,000
Other: $23,000
Highways: $1,000
Highways: $1,000
- Intergovernmental to Local - Other - Solid Waste Management: $2,078,000
Other - Solid Waste Management: $1,812,000
Other - General - Other: $1,488,000
Other - General - Other: $1,229,000
- Local Intergovernmental - Other: $173,000
Other: $96,000
- Miscellaneous - General Revenue - Other: $700,000
General Revenue - Other: $512,000
Fines and Forfeits: $509,000
Fines and Forfeits: $436,000
Rents: $279,000
Rents: $266,000
Interest Earnings: $257,000
Interest Earnings: $86,000
- Other Capital Outlay - Regular Highways: $112,000
General - Other: $51,000
General - Other: $38,000
- Other Funds - Cash and Securities: $11,819,000
Cash and Securities: $10,898,000
- State Intergovernmental - Highways: $1,861,000
Highways: $1,844,000
General Local Government Support: $774,000
General Local Government Support: $748,000
Health and Hospitals: $226,000
Other: $224,000
Other: $166,000
Health and Hospitals: $30,000
- Tax - General Sales and Gross Receipts: $5,192,000
General Sales and Gross Receipts: $4,948,000
Property: $4,108,000
Property: $4,039,000
Public Utilities Sales: $283,000
Public Utilities Sales: $279,000
Hot Spring County government finances - Debt in 2018:
- Charges - Other: $544,000
Other: $408,000
- Construction - Health - Other: $226,000
- Current Operations - Regular Highways: $3,435,000
Regular Highways: $2,407,000
Police Protection: $1,059,000
Police Protection: $977,000
Correctional Institutions: $858,000
General - Other: $830,000
Correctional Institutions: $824,000
Central Staff Services: $803,000
General - Other: $750,000
Central Staff Services: $726,000
Financial Administration: $672,000
Financial Administration: $539,000
Libraries: $520,000
Judicial and Legal Services: $488,000
General Public Buildings: $445,000
Judicial and Legal Services: $406,000
Libraries: $404,000
General Public Buildings: $368,000
Protective Inspection and Regulation - Other: $366,000
Protective Inspection and Regulation - Other: $338,000
Public Welfare - Other: $120,000
Public Welfare - Other: $97,000
Health - Other: $57,000
Local Fire Protection: $44,000
Parks and Recreation: $42,000
Health - Other: $33,000
Local Fire Protection: $30,000
Solid Waste Management: $21,000
Solid Waste Management: $20,000
- Federal Intergovernmental - General Local Government Support: $67,000
General Local Government Support: $65,000
Other: $29,000
Other: $23,000
Highways: $1,000
Highways: $1,000
- Intergovernmental to Local - Other - Solid Waste Management: $2,078,000
Other - Solid Waste Management: $1,812,000
Other - General - Other: $1,488,000
Other - General - Other: $1,229,000
- Local Intergovernmental - Other: $173,000
Other: $96,000
- Miscellaneous - General Revenue - Other: $700,000
General Revenue - Other: $512,000
Fines and Forfeits: $509,000
Fines and Forfeits: $436,000
Rents: $279,000
Rents: $266,000
Interest Earnings: $257,000
Interest Earnings: $86,000
- Other Capital Outlay - Regular Highways: $112,000
General - Other: $51,000
General - Other: $38,000
- Other Funds - Cash and Securities: $11,819,000
Cash and Securities: $10,898,000
- State Intergovernmental - Highways: $1,861,000
Highways: $1,844,000
General Local Government Support: $774,000
General Local Government Support: $748,000
Health and Hospitals: $226,000
Other: $224,000
Other: $166,000
Health and Hospitals: $30,000
- Tax - General Sales and Gross Receipts: $5,192,000
General Sales and Gross Receipts: $4,948,000
Property: $4,108,000
Property: $4,039,000
Public Utilities Sales: $283,000
Public Utilities Sales: $279,000
Hot Spring County government finances - Cash and Securities in 2018:
- Charges - Other: $544,000
Other: $408,000
- Construction - Health - Other: $226,000
- Current Operations - Regular Highways: $3,435,000
Regular Highways: $2,407,000
Police Protection: $1,059,000
Police Protection: $977,000
Correctional Institutions: $858,000
General - Other: $830,000
Correctional Institutions: $824,000
Central Staff Services: $803,000
General - Other: $750,000
Central Staff Services: $726,000
Financial Administration: $672,000
Financial Administration: $539,000
Libraries: $520,000
Judicial and Legal Services: $488,000
General Public Buildings: $445,000
Judicial and Legal Services: $406,000
Libraries: $404,000
General Public Buildings: $368,000
Protective Inspection and Regulation - Other: $366,000
Protective Inspection and Regulation - Other: $338,000
Public Welfare - Other: $120,000
Public Welfare - Other: $97,000
Health - Other: $57,000
Local Fire Protection: $44,000
Parks and Recreation: $42,000
Health - Other: $33,000
Local Fire Protection: $30,000
Solid Waste Management: $21,000
Solid Waste Management: $20,000
- Federal Intergovernmental - General Local Government Support: $67,000
General Local Government Support: $65,000
Other: $29,000
Other: $23,000
Highways: $1,000
Highways: $1,000
- Intergovernmental to Local - Other - Solid Waste Management: $2,078,000
Other - Solid Waste Management: $1,812,000
Other - General - Other: $1,488,000
Other - General - Other: $1,229,000
- Local Intergovernmental - Other: $173,000
Other: $96,000
- Miscellaneous - General Revenue - Other: $700,000
General Revenue - Other: $512,000
Fines and Forfeits: $509,000
Fines and Forfeits: $436,000
Rents: $279,000
Rents: $266,000
Interest Earnings: $257,000
Interest Earnings: $86,000
- Other Capital Outlay - Regular Highways: $112,000
General - Other: $51,000
General - Other: $38,000
- Other Funds - Cash and Securities: $11,819,000
Cash and Securities: $10,898,000
- State Intergovernmental - Highways: $1,861,000
Highways: $1,844,000
General Local Government Support: $774,000
General Local Government Support: $748,000
Health and Hospitals: $226,000
Other: $224,000
Other: $166,000
Health and Hospitals: $30,000
- Tax - General Sales and Gross Receipts: $5,192,000
General Sales and Gross Receipts: $4,948,000
Property: $4,108,000
Property: $4,039,000
Public Utilities Sales: $283,000
Public Utilities Sales: $279,000
Supplemental Security Income (SSI) in 2006:
- Total number of recipients: 930
- Number of aged recipients: 79
- Number of blind and disabled recipients: 851
- Number of recipients under 18: 191
- Number of recipients between 18 and 64: 573
- Number of recipients older than 64: 166
- Number of recipients also receiving OASDI: 371
- Amount of payments (thousands of dollars): 381
| Most common first names in Hot Spring County, AR among deceased individuals | ||
| Name | Count | Lived (average) |
|---|---|---|
| James | 289 | 72.6 years |
| William | 215 | 75.0 years |
| John | 200 | 75.4 years |
| Mary | 164 | 76.8 years |
| Robert | 102 | 71.0 years |
| Charles | 91 | 70.2 years |
| George | 89 | 77.4 years |
| Willie | 77 | 77.4 years |
| Henry | 69 | 74.9 years |
| Thomas | 65 | 75.0 years |
| Most common last names in Hot Spring County, AR among deceased individuals | ||
| Last name | Count | Lived (average) |
|---|---|---|
| Smith | 140 | 75.1 years |
| Williams | 114 | 77.8 years |
| Jones | 103 | 76.0 years |
| Davis | 81 | 75.0 years |
| Hughes | 71 | 74.7 years |
| Johnson | 68 | 74.3 years |
| Bailey | 63 | 74.8 years |
| Taylor | 56 | 75.4 years |
| Moore | 53 | 74.2 years |
| Brown | 51 | 69.9 years |
| Businesses in Hot Spring County, AR | ||||
| Name | Count | Name | Count | |
|---|---|---|---|---|
| AT&T | 1 | Nike | 2 | |
| AutoZone | 1 | Pizza Hut | 1 | |
| Baskin-Robbins | 1 | RadioShack | 1 | |
| Burger King | 1 | SONIC Drive-In | 1 | |
| Chevrolet | 1 | Sears | 1 | |
| Comfort Inn | 1 | Subway | 2 | |
| Cricket Wireless | 1 | Super 8 | 1 | |
| FedEx | 1 | Taco Bell | 1 | |
| Ford | 1 | U-Haul | 2 | |
| GameStop | 1 | UPS | 2 | |
| H&R Block | 1 | Waffle House | 1 | |
| Holiday Inn | 1 | Walgreens | 1 | |
| KFC | 1 | Walmart | 1 | |
| La-Z-Boy | 1 | Wendy's | 1 | |
| McDonald's | 2 | |||