Estimated zip code population in 2022: 29,835 Zip code population in 2010: 23,482 Zip code population in 2000: 16,546
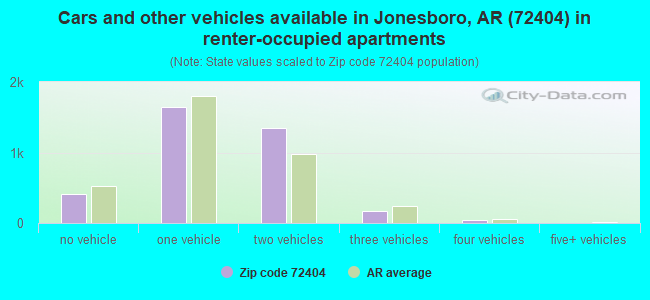
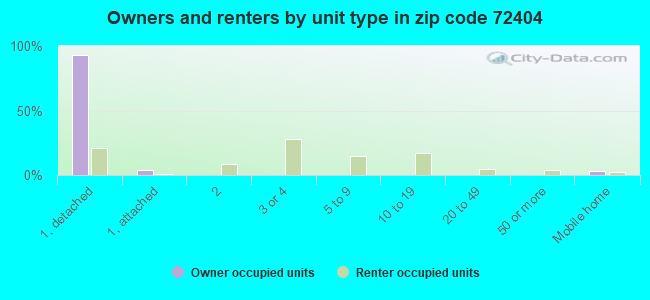
Houses and condos: 12,494 Renter-occupied apartments: 3,655
% of renters here:
31%
State:
34%
March 2022 cost of living index in zip code 72404: 81.8 (low, U.S. average is 100)
Land area: 126.0 sq. mi. Water area: 0.6 sq. mi.
Population density: 237 people per square mile
(very low).
OSM Map
General Map
Google Map
MSN Map
OSM Map
General Map
Google Map
MSN Map
OSM Map
General Map
Google Map
MSN Map
OSM Map
General Map
Google Map
MSN Map
Please wait while loading the map...
Real estate property taxes paid for housing units in 2022:
This zip code:
0.6% ($1,436)
Arkansas:
0.5% ($977)
Median real estate property taxes paid for housing units with mortgages in 2022: $1,612 (0.6%) Median real estate property taxes paid for housing units with no mortgage in 2022: $1,178 (0.5%)
Business Search- 14 Million verified businesses
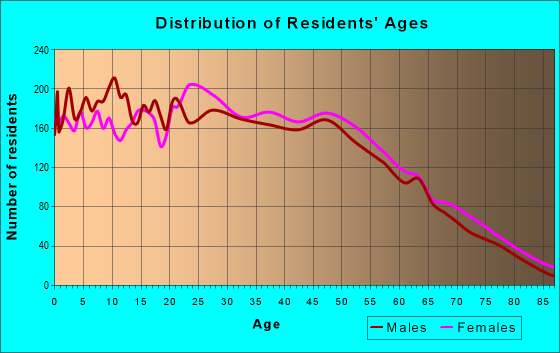
Males: 14,572
(48.8%)
Females: 15,262
(51.2%)
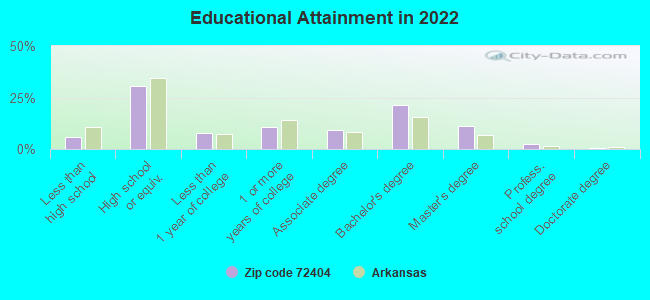
For population 25 years and over in 72404:
High school or higher: 94.8%
Bachelor's degree or higher: 35.9%
Graduate or professional degree: 14.6%
Unemployed: 5.9%
Mean travel time to work (commute): 18.8 minutes
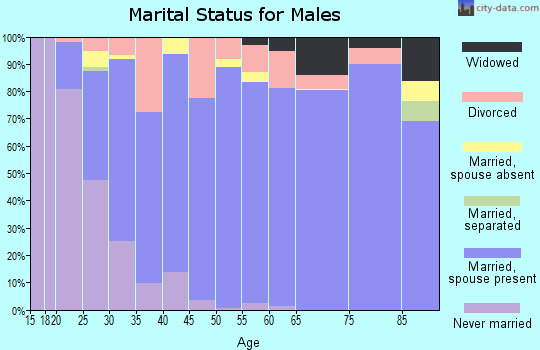
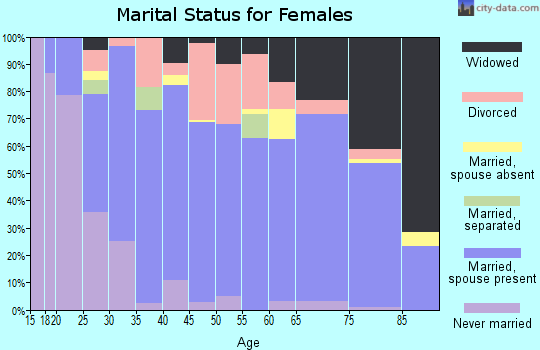
For population 15 years and over in 72404:
Never married: 27.5%
Now married: 56.7%
Separated: 0.8%
Widowed: 4.7%
Divorced: 10.3%
Zip code 72404 compared to state average:
Hispanic race population percentage below state average.
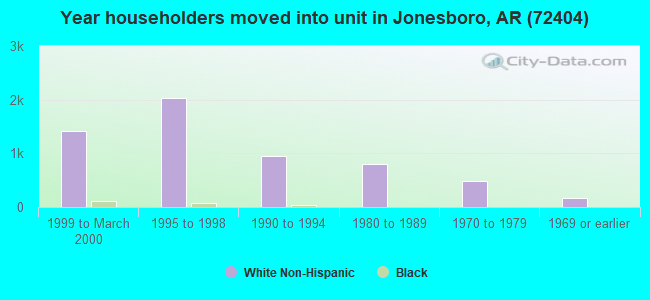
Length of stay since moving in above state average.
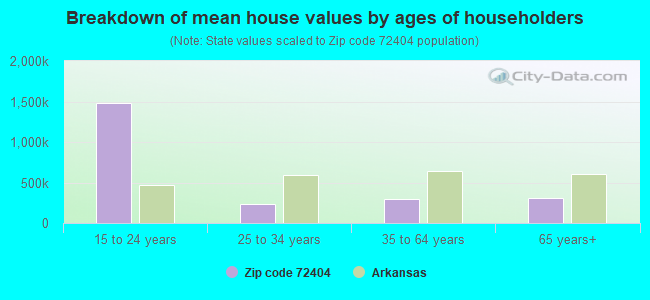
Estimated median house/condo value in 2022: $240,804
72404:
$240,804
Arkansas:
$179,800
According to our research of Arkansas and other state lists, there were 15 registered sex offenders living in 72404 zip code as of April 27, 2024. The ratio of all residents to sex offenders in zip code 72404 is 1,713 to 1. The ratio of registered sex offenders to all residents in this zip code is much lower than the state average.
Median resident age:
This zip code:
37.5 years
Arkansas median age:
38.9 years
Average household size:
This zip code:
2.5 people
Arkansas:
2.4 people
Averages for the 2020 tax year for zip code 72404, filed in 2021:
Average Adjusted Gross Income (AGI) in 2020: $79,978 (Individual Income Tax Returns)
Here:
$79,978
State:
$64,872
Salary/wage: $63,317 (reported on 84.9% of returns)
Here:
$63,317
State:
$50,644
(% of AGI for various income ranges: 1299.5% for AGIs below $25k, 3784.0% for AGIs $25k-50k, 6895.7% for AGIs $50k-75k, 10341.9% for AGIs $75k-100k, 18715.0% for AGIs $100k-200k, 77804.6% for AGIs over 200k)
Taxable interest for individuals: $2,050 (reported on 29.1% of returns)
This zip code:
$2,050
Arkansas:
$1,857
(% of AGI for various income ranges: 12.8% for AGIs below $25k, 16.9% for AGIs $25k-50k, 54.1% for AGIs $50k-75k, 98.9% for AGIs $75k-100k, 137.4% for AGIs $100k-200k, 1544.6% for AGIs over 200k)
Ordinary dividends: $7,729 (reported on 15.0% of returns)
Here:
$7,729
State:
$21,681
(% of AGI for various income ranges: 12.6% for AGIs below $25k, 26.4% for AGIs $25k-50k, 64.7% for AGIs $50k-75k, 89.0% for AGIs $75k-100k, 191.7% for AGIs $100k-200k, 3990.8% for AGIs over 200k)
Net capital gain/loss in AGI: +$28,062 (reported on 14.8% of returns)
Here:
+$28,062
State:
+$22,815
(% of AGI for various income ranges: 19.1% for AGIs below $25k, 22.9% for AGIs $25k-50k, 86.7% for AGIs $50k-75k, 148.6% for AGIs $75k-100k, 589.7% for AGIs $100k-200k, 16750.4% for AGIs over 200k)
Profit/loss from business: +$15,626 (reported on 19.8% of returns)
Here:
+$15,626
State:
+$9,743
(% of AGI for various income ranges: 90.7% for AGIs below $25k, 161.6% for AGIs $25k-50k, 334.9% for AGIs $50k-75k, 370.7% for AGIs $75k-100k, 826.0% for AGIs $100k-200k, 6752.3% for AGIs over 200k)
Taxable individual retirement arrangement distribution: $20,318 (reported on 6.5% of returns)
72404:
$20,318
Arkansas:
$18,502
(% of AGI for various income ranges: 26.8% for AGIs below $25k, 54.0% for AGIs $25k-50k, 188.7% for AGIs $50k-75k, 313.1% for AGIs $75k-100k, 601.0% for AGIs $100k-200k, 1503.1% for AGIs over 200k)
Self-employed (Keogh) retirement plans: $28,050 (reported on 0.5% of returns)
72404:
$28,050
Arkansas:
$24,438
(% of AGI for various income ranges: 647.3% for AGIs over 200k)
Total itemized deductions: $37,069 (reported on 8.9% of returns)
Here:
$37,069
State:
$52,840
(% of AGI for various income ranges: 38.0% for AGIs below $25k, 75.6% for AGIs $25k-50k, 291.5% for AGIs $50k-75k, 388.9% for AGIs $75k-100k, 1004.5% for AGIs $100k-200k, 8623.5% for AGIs over 200k)
Charity contributions: $17,986 (reported on 7.6% of returns)
Here:
$17,986
State:
$35,735
(% of AGI for various income ranges: 4.1% for AGIs below $25k, 17.3% for AGIs $25k-50k, 67.2% for AGIs $50k-75k, 88.3% for AGIs $75k-100k, 315.2% for AGIs $100k-200k, 4673.1% for AGIs over 200k)
Taxes paid: $7,823 (reported on 8.9% of returns)
72404:
$7,823
State:
$7,196
(% of AGI for various income ranges: 4.4% for AGIs below $25k, 11.2% for AGIs $25k-50k, 47.9% for AGIs $50k-75k, 80.8% for AGIs $75k-100k, 286.2% for AGIs $100k-200k, 1669.6% for AGIs over 200k)
Earned income credit: $2,596 (reported on 17.8% of returns)
Here:
$2,596
State:
$2,546
(% of AGI for various income ranges: 120.3% for AGIs below $25k, 80.3% for AGIs $25k-50k, 1.7% for AGIs $50k-75k)
Percentage of individuals using paid preparers for their 2020 taxes: 94.9%
Here:
95%
State:
94%
(% for various income ranges: 95.2% for AGIs below $25k, 94.8% for AGIs $25k-50k, 94.6% for AGIs $50k-75k, 94.7% for AGIs $75k-100k, 94.8% for AGIs $100k-200k, 95.0% for AGIs over 200k)
Averages for the 2012 tax year for zip code 72404, filed in 2013:
Average Adjusted Gross Income (AGI) in 2012: $68,729 (Individual Income Tax Returns)
Here:
$68,729
State:
$52,148
Salary/wage: $54,689 (reported on 87.7% of returns)
Here:
$54,689
State:
$41,669
(% of AGI for various income ranges: 81.2% for AGIs below $25k, 82.2% for AGIs $25k-50k, 80.2% for AGIs $50k-75k, 79.5% for AGIs $75k-100k, 75.9% for AGIs $100k-200k, 51.9% for AGIs over 200k)
Taxable interest for individuals: $1,739 (reported on 35.1% of returns)
This zip code:
$1,739
Arkansas:
$1,648
(% of AGI for various income ranges: 1.1% for AGIs below $25k, 0.6% for AGIs $25k-50k, 0.7% for AGIs $50k-75k, 0.7% for AGIs $75k-100k, 0.7% for AGIs $100k-200k, 1.2% for AGIs over 200k)
Ordinary dividends: $8,067 (reported on 16.0% of returns)
Here:
$8,067
State:
$20,675
(% of AGI for various income ranges: 0.9% for AGIs below $25k, 0.7% for AGIs $25k-50k, 0.7% for AGIs $50k-75k, 0.6% for AGIs $75k-100k, 1.1% for AGIs $100k-200k, 3.9% for AGIs over 200k)
Net capital gain/loss in AGI: +$20,124 (reported on 13.2% of returns)
Here:
+$20,124
State:
+$15,222
(% of AGI for various income ranges: 0.4% for AGIs $25k-50k, 0.5% for AGIs $50k-75k, 0.9% for AGIs $75k-100k, 1.7% for AGIs $100k-200k, 9.6% for AGIs over 200k)
Profit/loss from business: +$15,274 (reported on 18.4% of returns)
Here:
+$15,274
State:
+$9,665
(% of AGI for various income ranges: 6.8% for AGIs below $25k, 3.6% for AGIs $25k-50k, 2.6% for AGIs $50k-75k, 3.9% for AGIs $75k-100k, 4.2% for AGIs $100k-200k, 4.3% for AGIs over 200k)
Taxable individual retirement arrangement distribution: $15,494 (reported on 7.7% of returns)
72404:
$15,494
Arkansas:
$13,644
(% of AGI for various income ranges: 1.6% for AGIs below $25k, 1.9% for AGIs $25k-50k, 2.0% for AGIs $50k-75k, 2.3% for AGIs $75k-100k, 2.3% for AGIs $100k-200k, 1.0% for AGIs over 200k)
Self-employment retirement plans: $20,580 (reported on 0.5% of returns)
72404:
$20,580
Arkansas:
$20,153
Total itemized deductions: $25,267 (18% of AGI, reported on 34.5% of returns)
Here:
$25,267
State:
$23,276
Here:
18.0% of AGI
State:
19.1% of AGI
(% of AGI for various income ranges: 6.9% for AGIs below $25k, 9.2% for AGIs $25k-50k, 12.1% for AGIs $50k-75k, 13.5% for AGIs $75k-100k, 15.8% for AGIs $100k-200k, 12.7% for AGIs over 200k)
Charity contributions: $6,597 (reported on 28.9% of returns)
Here:
$6,597
State:
$5,996
(% of AGI for various income ranges: 0.9% for AGIs below $25k, 1.6% for AGIs $25k-50k, 2.1% for AGIs $50k-75k, 2.5% for AGIs $75k-100k, 3.2% for AGIs $100k-200k, 3.6% for AGIs over 200k)
Taxes paid: $9,623 (reported on 34.4% of returns)
72404:
$9,623
State:
$7,941
(% of AGI for various income ranges: 1.0% for AGIs below $25k, 1.9% for AGIs $25k-50k, 3.0% for AGIs $50k-75k, 4.3% for AGIs $75k-100k, 6.1% for AGIs $100k-200k, 6.5% for AGIs over 200k)
Earned income credit: $2,335 (reported on 17.7% of returns)
Here:
$2,335
State:
$2,455
(% of AGI for various income ranges: 6.8% for AGIs below $25k, 1.3% for AGIs $25k-50k)
Percentage of individuals using paid preparers for their 2012 taxes: 62.7%
Here:
63%
State:
61%
(% for various income ranges: 57.5% for AGIs below $25k, 61.6% for AGIs $25k-50k, 61.5% for AGIs $50k-75k, 64.3% for AGIs $75k-100k, 70.6% for AGIs $100k-200k, 88.2% for AGIs over 200k)
Averages for the 2004 tax year for zip code 72404, filed in 2005:
Average Adjusted Gross Income (AGI) in 2004: $53,872 (Individual Income Tax Returns)
Here:
$53,872
State:
$39,270
Salary/wage: $45,436 (reported on 88.4% of returns)
Here:
$45,436
State:
$34,079
(% of AGI for various income ranges: 111.2% for AGIs below $10k, 81.4% for AGIs $10k-25k, 84.9% for AGIs $25k-50k, 84.2% for AGIs $50k-75k, 81.5% for AGIs $75k-100k, 62.8% for AGIs over 100k)
Taxable interest for individuals: $1,506 (reported on 43.1% of returns)
This zip code:
$1,506
Arkansas:
$1,904
(% of AGI for various income ranges: 4.6% for AGIs below $10k, 2.2% for AGIs $10k-25k, 0.9% for AGIs $25k-50k, 0.8% for AGIs $50k-75k, 1.3% for AGIs $75k-100k, 1.2% for AGIs over 100k)
Taxable dividends: $2,886 (reported on 21.4% of returns)
Here:
$2,886
State:
$5,995
(% of AGI for various income ranges: 3.1% for AGIs below $10k, 0.7% for AGIs $10k-25k, 0.4% for AGIs $25k-50k, 0.3% for AGIs $50k-75k, 0.5% for AGIs $75k-100k, 1.9% for AGIs over 100k)
Net capital gain/loss: +$9,222 (reported on 17.7% of returns)
Here:
+$9,222
State:
+$10,430
(% of AGI for various income ranges: 0.4% for AGIs below $10k, 0.5% for AGIs $10k-25k, 0.6% for AGIs $25k-50k, 0.5% for AGIs $50k-75k, 1.1% for AGIs $75k-100k, 5.9% for AGIs over 100k)
Profit/loss from business: +$14,519 (reported on 18.6% of returns)
Here:
+$14,519
State:
+$7,823
(% of AGI for various income ranges: 12.3% for AGIs below $10k, 4.9% for AGIs $10k-25k, 3.8% for AGIs $25k-50k, 3.2% for AGIs $50k-75k, 4.2% for AGIs $75k-100k, 6.2% for AGIs over 100k)
Profit/loss from farming: +$7,466 (reported on 1.9% of returns)
Here:
+$7,466
State:
-$5,941
(% of AGI for various income ranges: -0.5% for AGIs below $10k, 0.2% for AGIs $10k-25k, -0.3% for AGIs $25k-50k, 0.0% for AGIs $50k-75k, -0.2% for AGIs $75k-100k, 0.7% for AGIs over 100k)
IRA payment deduction: $3,291 (reported on 3.1% of returns)
72404:
$3,291
Arkansas:
$3,204
(% of AGI for various income ranges: 0.3% for AGIs $10k-25k, 0.2% for AGIs $25k-50k, 0.2% for AGIs $50k-75k, 0.2% for AGIs $75k-100k, 0.1% for AGIs over 100k)
Self-employed pension: $15,149 (reported on 0.9% of returns)
Here:
$15,149
Arkansas:
$14,742
Total itemized deductions: $19,954 (19% of AGI, reported on 37.5% of returns)
Here:
$19,954
State:
$18,389
Here:
19.4% of AGI
State:
21.0% of AGI
(% of AGI for various income ranges: 7.9% for AGIs below $10k, 8.4% for AGIs $10k-25k, 11.0% for AGIs $25k-50k, 13.9% for AGIs $50k-75k, 17.6% for AGIs $75k-100k, 14.8% for AGIs over 100k)
Charity contributions deductions: $4,841 (4% of AGI, reported on 32.8% of returns)
Here:
$4,841
State:
$4,725
Here:
4.4% of AGI
State:
5.1% of AGI
(% of AGI for various income ranges: 0.5% for AGIs below $10k, 1.1% for AGIs $10k-25k, 1.8% for AGIs $25k-50k, 2.3% for AGIs $50k-75k, 3.2% for AGIs $75k-100k, 3.9% for AGIs over 100k)
Total tax: $9,079 (reported on 76.0% of returns)
72404:
$9,079
State:
$6,047
(% of AGI for various income ranges: 3.6% for AGIs below $10k, 3.9% for AGIs $10k-25k, 6.5% for AGIs $25k-50k, 8.5% for AGIs $50k-75k, 10.0% for AGIs $75k-100k, 19.2% for AGIs over 100k)
Earned income credit: $1,760 (reported on 14.9% of returns)
Here:
$1,760
State:
$1,909
Percentage of individuals using paid preparers for their 2004 taxes: 66.4%
Here:
66%
State:
67%
(% for various income ranges: 58.4% for AGIs below $10k, 68.3% for AGIs $10k-25k, 65.3% for AGIs $25k-50k, 65.8% for AGIs $50k-75k, 68.0% for AGIs $75k-100k, 78.5% for AGIs over 100k)
Likely homosexual households (counted as self-reported same-sex unmarried-partner households)
Lesbian couples: 0.1% of all households
Gay men: 0.1% of all households
Household received Food Stamps/SNAP in the past 12 months: 642 Household did not receive Food Stamps/SNAP in the past 12 months: 11,170
Women who had a birth in the past 12 months: 220 (188 now married, 35 unmarried) Women who did not have a birth in the past 12 months: 7,183 (3,592 now married, 3,596 unmarried)
Housing units in zip code 72404 with a mortgage: 5,348 (421 second mortgage, 9 home equity loan, 243 both second mortgage and home equity loan) Houses without a mortgage: 29
Median monthly owner costs for units with a mortgage: $1,447 Median monthly owner costs for units without a mortgage: $421
Residents with income below the poverty level in 2022:
This zip code:
11.9%
Whole state:
16.8%
Residents with income below 50% of the poverty level in 2022:
This zip code:
7.7%
Whole state:
8.5%
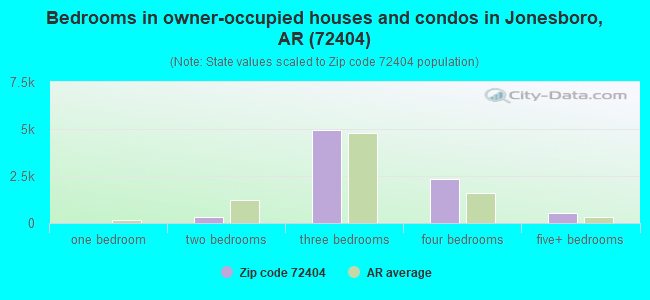
Median number of rooms in houses and condos:
Here:
6.7
State:
6.1
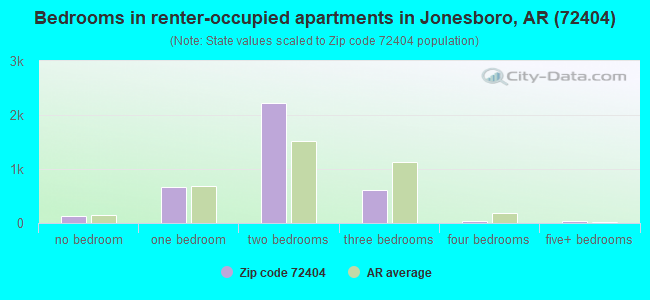
Median number of rooms in apartments:
Here:
3.9
State:
4.3
Notable locations in this zip code not listed on our city pages
Notable locations in zip code 72404: Arkansas Childrens Colony (A), Craig Hills Public Golf Course (B), Legacy Landfill (C), Southridge Fire Department Station 1 (D), Southridge Fire Department Station 2 (E), Valley View Fire Department (F), Bono Fire Department Westside Station (G), Jonesboro Fire Station 4 (H), Jonesboro Fire Station 5 (I), Medic One Ambulance Service - Jonesboro (J). Display/hide their locations on the map
Churches in zip code 72404 include: Big Creek Valley Church (A), County Line Church (B), Wood Springs Church (C), Friendship Church (D), Hay Memorial Church (E), Oak Grove Church (F), Union Grove United Methodist Church (G), Pine Hill Church (H), New Hope Baptist Church (I). Display/hide their locations on the map
Cemeteries: Bishop Cemetery (1), Kelly Cemetery (2), Pine Hill Cemetery (3), White Cemetery (4), Mount Pisgah Cemetery (5), Gibson Cemetery (6), Otwell Cemetery (7). Display/hide their locations on the map
Reservoirs: Big Creek Site 14 Reservoir (A), Big Creek Site 13 Reservoir (B), Cole Pond (C), Craighead Forest Lake (D), Farmers Lake (E), Poinsett Watershed Site 20 Reservoir (F), Big Creek Site 22 Reservoir (G), Mary Simpson Pond (H). Display/hide their locations on the map
Streams, rivers, and creeks: Higginbottom Creek (A), Coward Slough (B), Steep Cut Creek (C), Shelton Creek (D), Big Creek (E). Display/hide their locations on the map
4,672 married couples with children.
1,469 single-parent households (310 men, 1,159 women).
94.8% of residents of 72404 zip code speak English at home.
3.1% of residents speak Spanish at home (70% very well, 14% well, 16% not well).
0.8% of residents speak other Indo-European language at home (87% very well, 13% well).
1.0% of residents speak Asian or Pacific Island language at home (61% very well, 35% well, 5% not well).
0.1% of residents speak other language at home (69% very well, 31% well).
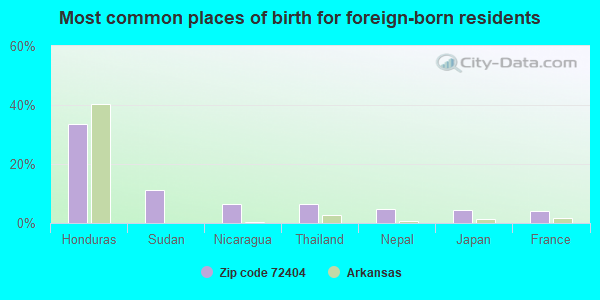
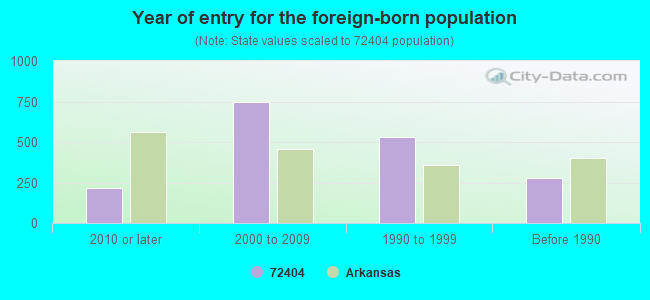
Foreign born population: 1,449 (4.9%) (48.2% of them are naturalized citizens)
Facilities with environmental interests located in this zip code:
EASTSIDE WW TREATMENT PLANT (5205 INGELS RD. in JONESBORO, AR)
National Pollutant Discharge Elimination System MAJOR (Tracking pollutant discharge elimination systems) - permit - ICIS-, ENFORCEMENT/COMPLIANCE ACTIVITY National Pollutant Discharge Elimination System NON-MAJOR (Tracking pollutant discharge elimination systems) - permit Business SIC classification: SEWERAGE SYSTEMS; MANAGEMENT SERVICES Alternative names: CWL EAST SIDE WASTEWATER TREATMENT PLANT, EASTSIDE WASTEWATER TREATMENT, EASTSIDE WWTP, JONESBORO CITY WATER & LIGHT-E
HUNTER GLEN SUBDIVISION (5469 HWY 1 S in JONESBORO, AR)
National Pollutant Discharge Elimination System NON-MAJOR (Tracking pollutant discharge elimination systems) - permit STATE MASTER (PDS) - WATER-AR0048658, National Pollutant Discharge Elimination System Permit, WATER-ARR10B117, NPDES STORMWATER PERMIT Business SIC classification: LAND SUBDIVIDERS AND DEVELOPERS, EXCEPT CEMETERIES Alternative names: HUNTERS GLEN OWNERS ASSOC., HUNTERS GLEN OWNERS ASSOCIATIO
CENTRAL PONTIAC (2907 E PARKER RD in JONESBORO, AR)
Conditionally Exempt Small Quantity Generators, less than 100 kg/month of hazardous waste (Resource Conservation and Recovery Act (tracking hazardous waste)) - notification Business NAICS classification: ALL OTHER TRANSIT AND GROUND PASSENGER TRANSPORTATION. Organizations: MARK DOTY (CONTACT/OPERATOR)
, CENTRAL CHEVROLET CO INC (CONTACT/OWNER)
Alternative names: CENTRAL PONTIAC GMC NISSAN
HELENA CHEMICAL CO - JONESBORO (311 JOE N MARTIN EXPRESSWAY in JONESBORO, AR)
(Resource Conservation and Recovery Act (tracking hazardous waste))
CHAPEL HILL PH. I & II (CHAPEL HILL in JONESBORO, AR)
National Pollutant Discharge Elimination System NON-MAJOR (Tracking pollutant discharge elimination systems) - permit Business SIC classification: MANAGEMENT SERVICES Alternative names: TRUST HOMES, LLC
HOME DEPOT 1406 (711 W PARKER in JONESBORO, AR)
Conditionally Exempt Small Quantity Generators, less than 100 kg/month of hazardous waste (Resource Conservation and Recovery Act (tracking hazardous waste)) Organizations: HOME DEPOT USA (CONTACT/OPERATOR)
SHERWIN WILLIAMS AUTO FINISHES #9723 (3208 MEAD DR in JONESBORO, AR)
Conditionally Exempt Small Quantity Generators, less than 100 kg/month of hazardous waste (Resource Conservation and Recovery Act (tracking hazardous waste)) Organizations: SHERWIN-WILLIAMS AUTOMOTIVE FINISHES (CONTACT/OPERATOR)
, JIM MEADE (CONTACT/OWNER)
SHOPPES ON HILLTOP (3410 EAST JOHNSON AVE. HWY.49 in JONESBORO, AR)
National Pollutant Discharge Elimination System NON-MAJOR (Tracking pollutant discharge elimination systems) - permit Business SIC classification: GENERAL CONTRACTORS-NONRESIDENTIAL BUILDINGS, OTHER THAN INDUSTRIAL BUILDINGS AND WAREHOUSES Alternative names: QUINN FAMILY LTD.PARTNERSHIPII
STADIUM AUTO BODY INC (4606 STADIUM BLVD in JONESBORO, AR)
Conditionally Exempt Small Quantity Generators, less than 100 kg/month of hazardous waste (Resource Conservation and Recovery Act (tracking hazardous waste)) - notification Organizations: MEREDITH KEVIN (CONTACT/OWNER)
Housing units lacking complete plumbing facilities: 0.8% Housing units lacking complete kitchen facilities: 1.1%
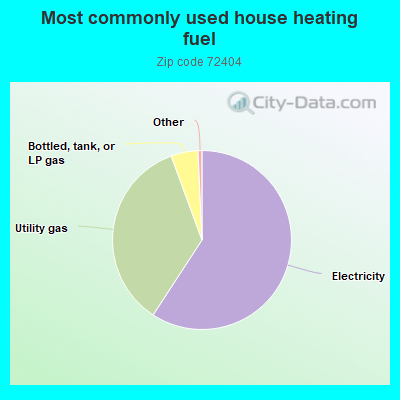
59.2%Electricity
35.2%Utility gas
4.9%Bottled, tank, or LP gas
Place of birth for U.S.-born residents:
This state: 20,181
Northeast: 191
Midwest: 2,527
South: 4,214
West: 769
44% of the 72404 zip code residents lived in the same house 5 years ago. Out of people who lived in different houses, 54% lived in this county. Out of people who lived in different counties, 50% lived in Arkansas.
86% of the 72404 zip code residents lived in the same house 1 year ago. Out of people who lived in different houses, 51% moved from this county. Out of people who lived in different houses, 26% moved from different county within same state. Out of people who lived in different houses, 19% moved from different state. Out of people who lived in different houses, 1% moved from abroad.
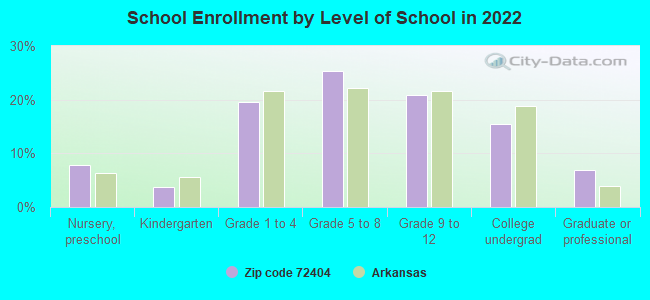
Private vs. public school enrollment:
Students in private schools in grades 1 to 8 (elementary and middle school): 173
Here:
5.0%
Arkansas:
10.5%
Students in private schools in grades 9 to 12 (high school): 21
Here:
1.3%
Arkansas:
8.7%
Students in private undergraduate colleges: 165
Here:
14.1%
Arkansas:
19.4%
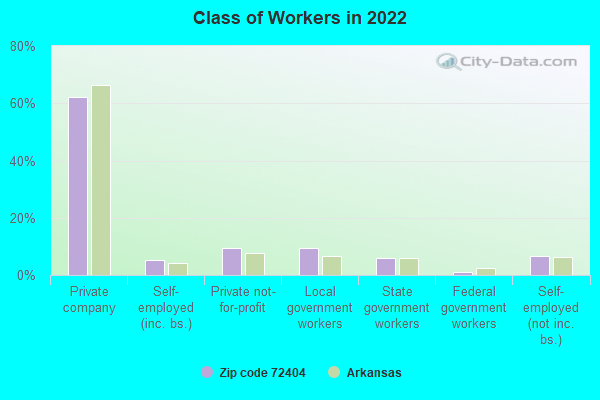
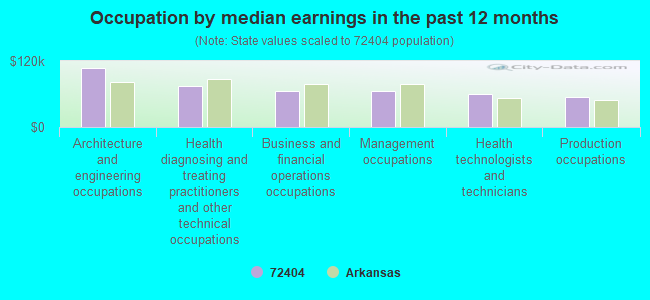
Occupation by median earnings in the past 12 months ($)
108,055Architecture and engineering occupations
73,734Health diagnosing and treating practitioners and other technical occupations
65,890Business and financial operations occupations
65,315Management occupations
59,580Health technologists and technicians
54,193Production occupations
Companies with federal contracts located in this zip code (JONESBORO, AR):
GILLIS FARMS INC (1607 PEAR TREE RD; small business) : $981,999 in 14 contractsfrom 2002 to 2005
Contracts for Maintenance, Repair or Alteration of Real Property -- Other Conservation and Development Facilities by U.S. Army Corps of Engineers - civil program financing only, Army Signed by year:2000: $0; 2001: $0; 2002: $75,000; 2003: $769,989; 2004: $171,522; 2005: -$34,512; 2006: $0.
Biggest contracts:
$177,386 with U.S. Army Corps of Engineers - civil program financing only for Maintenance, Repair or Alteration of Real Property -- Other Conservation and Development Facilities. Signed on 2003-07-18. Completion date: 2003-11-17.
$145,903, same as above.Signed on 2003-09-17. Completion date: 2003-11-17.
$105,850 with Army for Maintenance, Repair or Alteration of Real Property -- Other Conservation and Development Facilities. Signed on 2003-10-09. Completion date: 2003-11-17.
$105,850 with U.S. Army Corps of Engineers - civil program financing only for Maintenance, Repair or Alteration of Real Property -- Other Conservation and Development Facilities. Signed on 2003-10-09. Completion date: 2003-11-17.
ARKANSAS AUDIOMEDICAL, INC (706 GLADIOLUS DR; small business) : $21,285 in 3 contractsfrom 2003 to 2006
$7,860 with Army for Other Medical Services. Signed on 2006-03-10. Completion date: 2006-09-29.
$7,800 with Army for Medical and Health Studies. Signed on 2004-06-16. Completion date: 2004-06-16.
$5,625 with Army for Dependent Medicare Services. Signed on 2003-02-03. Completion date: 2002-12-01.
HEARTLAND ROOFING SERVICES COR (5447 SOUTHWEST DRIVE; small business)
$13,800 with U.S. Army Corps of Engineers - civil program financing only for Maintenance, Repair or Alteration of Real Property -- Dams. Taking place in MO. Signed on 2002-06-13. Completion date: 2002-06-28.
OPTUS, INC (3423 ONE PL; small business) : $13,498 in 5 contractsfrom 2002 to 2005
Contracts for Telephone and Telegraph Equipment by Army Signed by year:2000: $0; 2001: $0; 2002: $3,970; 2003: $0; 2004: $4,764; 2005: $4,764; 2006: $0.
Biggest contracts:
$4,764 with Army for Telephone and Telegraph Equipment. Signed on 2005-10-27. Completion date: 2004-09-30.
$4,764, same as above.Signed on 2004-10-07. Completion date: 2004-09-30.
$3,798, same as above.Signed on 2002-12-06. Completion date: 2003-09-30.
$172, same as above.Signed on 2002-12-03. Completion date: 2003-09-30.
GIBSON, EULAS (2847 CR204; small business) : $12,600 in 7 contractsfrom 2003 to 2006
Contracts for Landscaping/Groundskeeping Services by Army Signed by year:2000: $0; 2001: $0; 2002: $0; 2003: $4,500; 2004: $4,500; 2005: $600; 2006: $3,000.
Biggest contracts:
$4,500 with Army for Landscaping/Groundskeeping Services. Signed on 2004-11-01. Completion date: 2005-10-31.
$4,500, same as above.Signed on 2003-10-30. Completion date: 2004-11-01.
$2,400, same as above.Signed on 2006-03-29. Completion date: 2006-10-31.
$600, same as above.Signed on 2006-01-22. Completion date: 2006-02-28.
ROADSIDE ATTRACTIONS, LLC (3828 S CULBERHOUSE RD; small business) : $11,033 in 2 contractsin 2006
$6,578 with Army for Food Items For Resale. Signed on 2006-06-08. Completion date: 2006-06-11.
$4,455, same as above.Signed on 2006-05-15. Completion date: 2006-05-14.
Top industries in this zip code by the number of employees in 2005:
2002 - 2018 National Fire Incident Reporting System (NFIRS) incidents
According to the data from the years 2002 - 2018 the average number of fire incidents per year is 108. The highest number of reported fire incidents - 193 took place in 2007, and the least - 48 in 2015. The data has a growing trend.
When looking into fire subcategories, the most incidents belonged to: Outside Fires (62.0%), and Structure Fires (24.8%).
Fire incident types reported to NFIRS in Zip Code 72404


+$7,466
-$5,941
(% of AGI for various income ranges: -0.5% for AGIs below $10k, 0.2% for AGIs $10k-25k, -0.3% for AGIs $25k-50k, 0.0% for AGIs $50k-75k, -0.2% for AGIs $75k-100k, 0.7% for AGIs over 100k) Nearest zip codes: 72467, 72401, 72427, 72479, 72416, 72421.
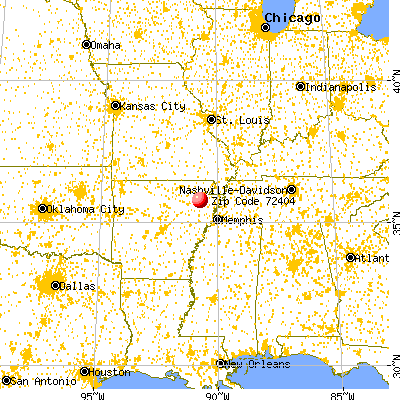


 According to the data from the years 2002 - 2018 the average number of fire incidents per year is 108. The highest number of reported fire incidents - 193 took place in 2007, and the least - 48 in 2015. The data has a growing trend.
 When looking into fire subcategories, the most incidents belonged to: Outside Fires (62.0%), and Structure Fires (24.8%).