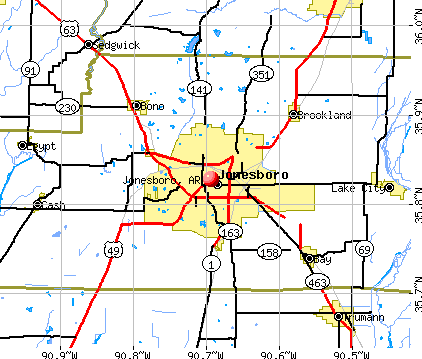
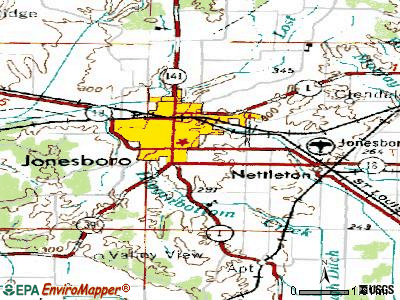
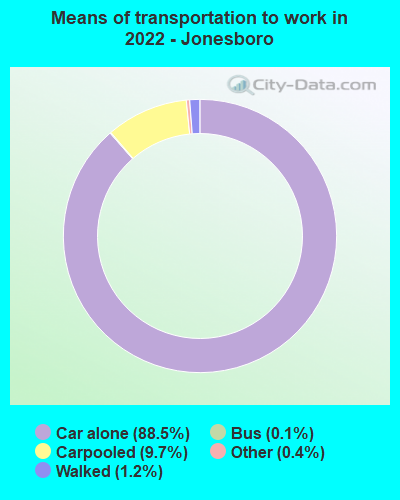
Jonesboro, Arkansas
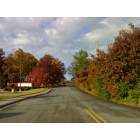
Jonesboro: BEAUTIFUL
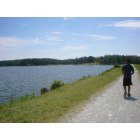
Jonesboro: Running trail
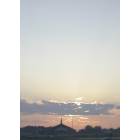
Jonesboro: Walnut Street Baptist Church @ Sunrise
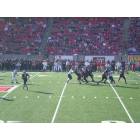
Jonesboro: A Day at the Game - Red Wolf Stadium
Jonesboro: Craighead Forrest Park
Jonesboro: various images from around the city
- add
your
Submit your own pictures of this city and show them to the world
- OSM Map
- General Map
- Google Map
- MSN Map
Population change since 2000: +43.9%
| Males: 37,097 | |
| Females: 42,779 |
| Median resident age: | 34.1 years |
| Arkansas median age: | 38.9 years |
Zip codes: 72401, 72404, 72467.
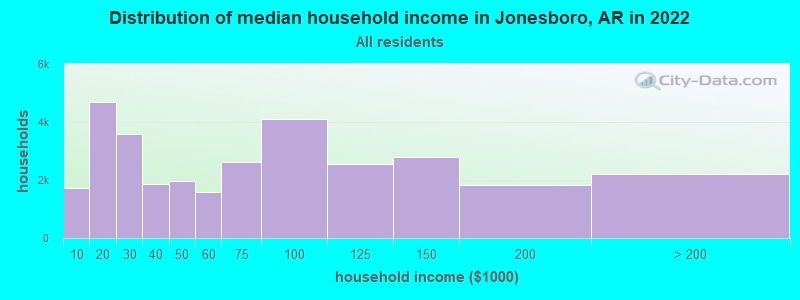
Jonesboro Zip Code Map| Jonesboro: | $61,057 |
| AR: | $55,432 |
Estimated per capita income in 2022: $34,666 (it was $17,884 in 2000)
Jonesboro city income, earnings, and wages data
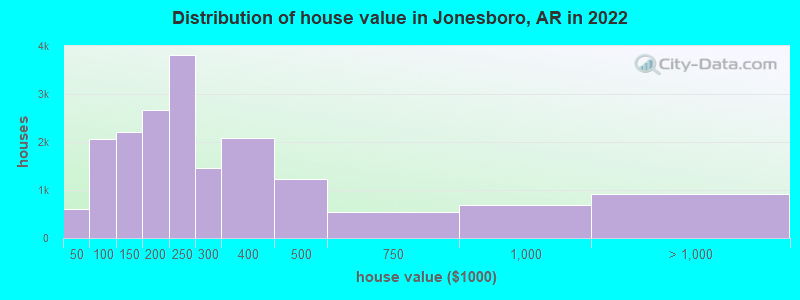
Estimated median house or condo value in 2022: $222,200 (it was $85,000 in 2000)
| Jonesboro: | $222,200 |
| AR: | $179,800 |
Median gross rent in 2022: $864.
(14.9% for White Non-Hispanic residents, 44.6% for Black residents, 21.4% for Hispanic or Latino residents, 40.1% for American Indian residents, 31.3% for other race residents, 23.0% for two or more races residents)
Detailed information about poverty and poor residents in Jonesboro, AR


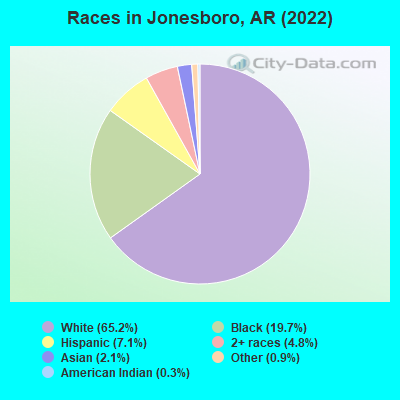
- 51,99365.2%White alone
- 15,72519.7%Black alone
- 5,6887.1%Hispanic
- 3,7974.8%Two or more races
- 1,6862.1%Asian alone
- 6840.9%Other race alone
- 2310.3%American Indian alone
- 280.04%Native Hawaiian and Other
Pacific Islander alone
According to our research of Arkansas and other state lists, there were 91 registered sex offenders living in Jonesboro, Arkansas as of April 26, 2024.
The ratio of all residents to sex offenders in Jonesboro is 804 to 1.
The ratio of registered sex offenders to all residents in this city is lower than the state average.
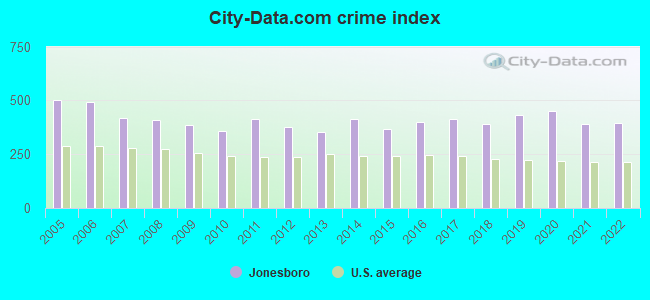
The City-Data.com crime index weighs serious crimes and violent crimes more heavily. Higher means more crime, U.S. average is 246.1. It adjusts for the number of visitors and daily workers commuting into cities.
- means the value is smaller than the state average.- means the value is about the same as the state average.
- means the value is bigger than the state average.
- means the value is much bigger than the state average.
Crime rate in Jonesboro detailed stats: murders, rapes, robberies, assaults, burglaries, thefts, arson
Full-time law enforcement employees in 2021, including police officers: 195 (166 officers - 151 male; 15 female).
| Officers per 1,000 residents here: | 2.04 |
| Arkansas average: | 2.25 |
 Recent articles from our blog. Our writers, many of them Ph.D. graduates or candidates, create easy-to-read articles on a wide variety of topics.

 | Why is Jonesboro growing so fast? (14 replies) |
| What is Jonesboro like? (9 replies) |
| Fayetteville or Jonesboro for relocation? (10 replies) |
| Tell me about Jonesboro (24 replies) |
| Moving to Jonesboro (47 replies) |
| What's Jonesboro like as a place to live? (11 replies) |
Latest news from Jonesboro, AR collected exclusively by city-data.com from local newspapers, TV, and radio stations
Ancestries: American (16.3%), English (11.0%), Irish (5.8%), German (4.6%), European (2.1%), Italian (1.0%).
Current Local Time: CST time zone
Incorporated on 02/10/1883
Elevation: 326 feet
Land area: 79.6 square miles.
Population density: 1,003 people per square mile (low).
3,661 residents are foreign born (2.7% Latin America, 1.3% Asia).
| This city: | 4.6% |
| Arkansas: | 5.0% |
Median real estate property taxes paid for housing units with mortgages in 2022: $1,262 (0.5%)
Median real estate property taxes paid for housing units with no mortgage in 2022: $1,251 (0.6%)
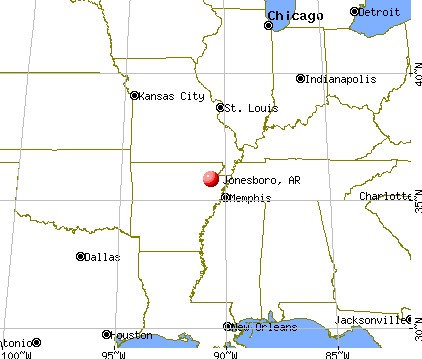
Nearest city with pop. 200,000+: Memphis, TN  (63.8 miles , pop. 650,100).
Nearest city with pop. 1,000,000+: Dallas, TX (406.1 miles , pop. 1,188,580).
Nearest cities:
), ), ), )Latitude: 35.83 N, Longitude: 90.69 W
Daytime population change due to commuting: +13,507 (+16.9%)
Workers who live and work in this city: 29,476 (81.2%)
Area code: 870
Jonesboro, Arkansas accommodation & food services, waste management - Economy and Business Data
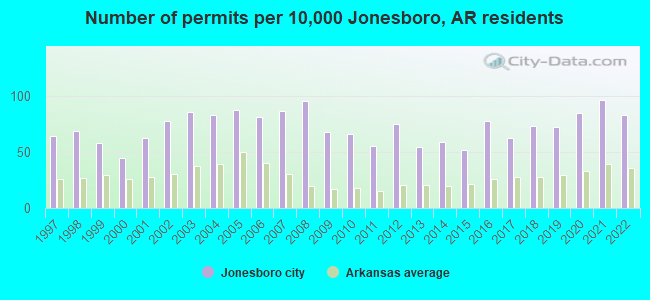
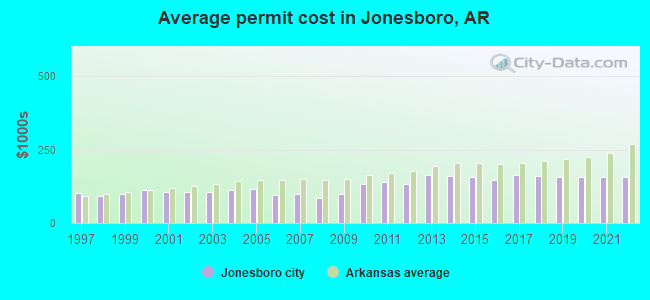
Single-family new house construction building permits:
- 2022: 459 buildings, average cost: $156,600
- 2021: 533 buildings, average cost: $156,600
- 2020: 467 buildings, average cost: $156,700
- 2019: 401 buildings, average cost: $156,100
- 2018: 403 buildings, average cost: $158,600
- 2017: 343 buildings, average cost: $162,000
- 2016: 430 buildings, average cost: $147,800
- 2015: 288 buildings, average cost: $156,400
- 2014: 327 buildings, average cost: $159,400
- 2013: 299 buildings, average cost: $164,900
- 2012: 413 buildings, average cost: $132,100
- 2011: 304 buildings, average cost: $138,900
- 2010: 366 buildings, average cost: $133,400
- 2009: 377 buildings, average cost: $99,400
- 2008: 527 buildings, average cost: $84,600
- 2007: 480 buildings, average cost: $98,300
- 2006: 448 buildings, average cost: $95,100
- 2005: 482 buildings, average cost: $115,800
- 2004: 458 buildings, average cost: $111,400
- 2003: 472 buildings, average cost: $106,000
- 2002: 428 buildings, average cost: $106,000
- 2001: 343 buildings, average cost: $104,700
- 2000: 246 buildings, average cost: $111,700
- 1999: 322 buildings, average cost: $100,000
- 1998: 380 buildings, average cost: $92,200
- 1997: 355 buildings, average cost: $101,900
| Here: | 3.0% |
| Arkansas: | 3.4% |
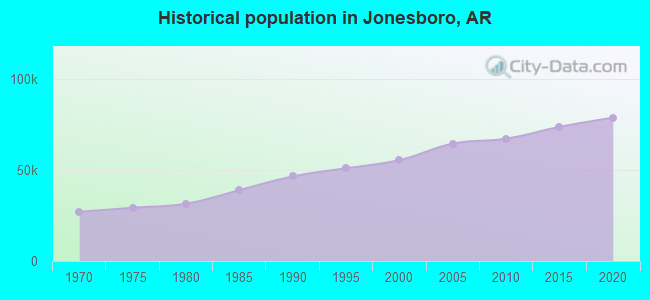
Population change in the 1990s: +8,351 (+17.7%).
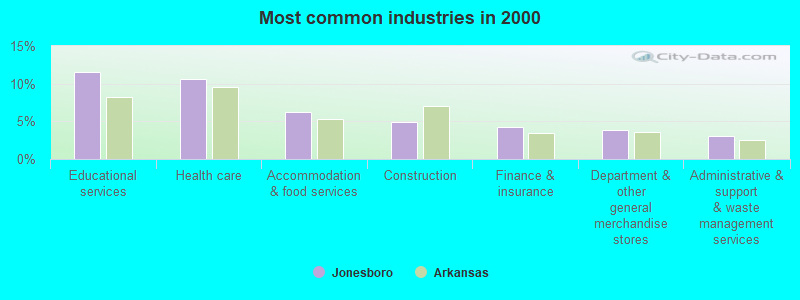
- Educational services (11.5%)
- Health care (10.6%)
- Accommodation & food services (6.2%)
- Construction (4.9%)
- Finance & insurance (4.2%)
- Department & other general merchandise stores (3.9%)
- Administrative & support & waste management services (3.1%)
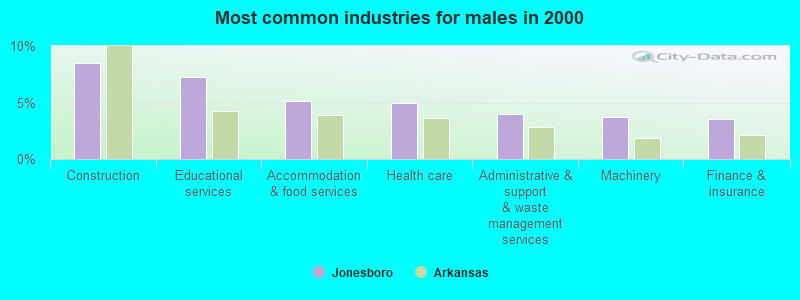
- Construction (8.5%)
- Educational services (7.3%)
- Accommodation & food services (5.1%)
- Health care (4.9%)
- Administrative & support & waste management services (4.0%)
- Machinery (3.7%)
- Finance & insurance (3.6%)
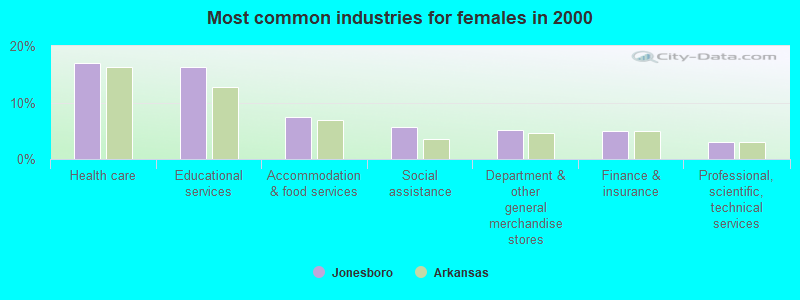
- Health care (17.0%)
- Educational services (16.2%)
- Accommodation & food services (7.5%)
- Social assistance (5.7%)
- Department & other general merchandise stores (5.1%)
- Finance & insurance (4.9%)
- Professional, scientific, technical services (3.0%)
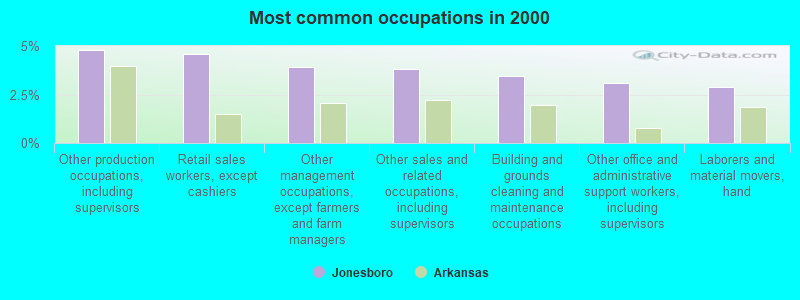
- Other production occupations, including supervisors (4.8%)
- Retail sales workers, except cashiers (4.6%)
- Other management occupations, except farmers and farm managers (3.9%)
- Other sales and related occupations, including supervisors (3.8%)
- Building and grounds cleaning and maintenance occupations (3.5%)
- Other office and administrative support workers, including supervisors (3.1%)
- Laborers and material movers, hand (2.9%)
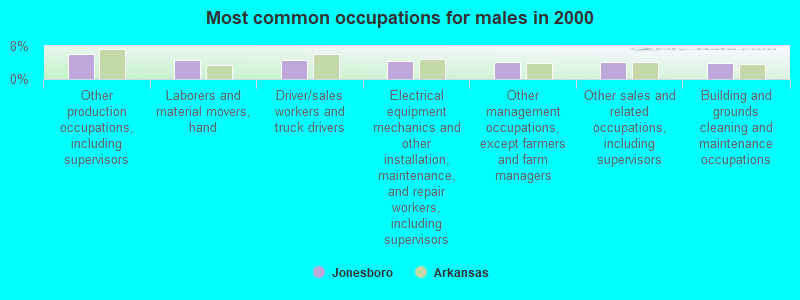
- Other production occupations, including supervisors (6.1%)
- Laborers and material movers, hand (4.6%)
- Driver/sales workers and truck drivers (4.5%)
- Electrical equipment mechanics and other installation, maintenance, and repair workers, including supervisors (4.3%)
- Other management occupations, except farmers and farm managers (4.2%)
- Other sales and related occupations, including supervisors (4.1%)
- Building and grounds cleaning and maintenance occupations (4.0%)
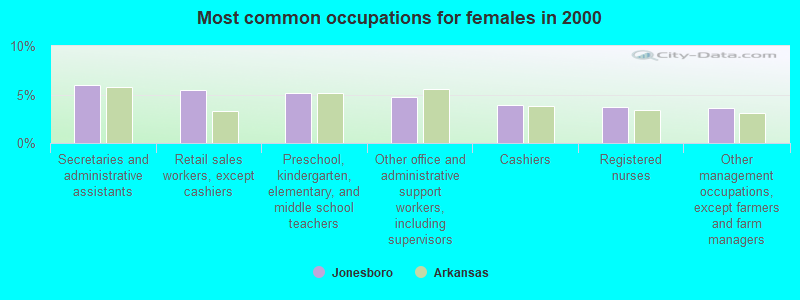
- Secretaries and administrative assistants (6.0%)
- Retail sales workers, except cashiers (5.4%)
- Preschool, kindergarten, elementary, and middle school teachers (5.2%)
- Other office and administrative support workers, including supervisors (4.7%)
- Cashiers (3.9%)
- Registered nurses (3.7%)
- Other management occupations, except farmers and farm managers (3.6%)
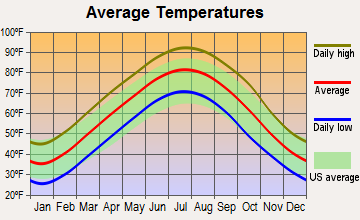
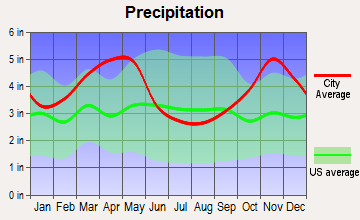
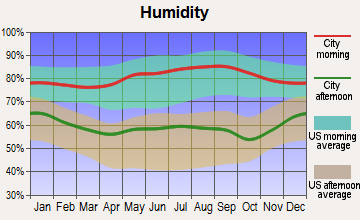
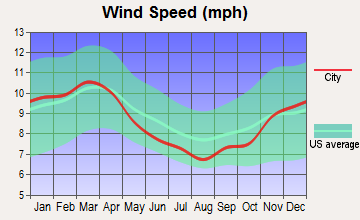
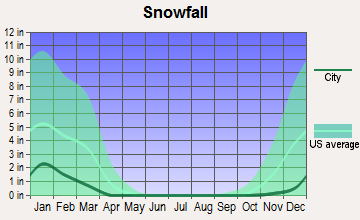
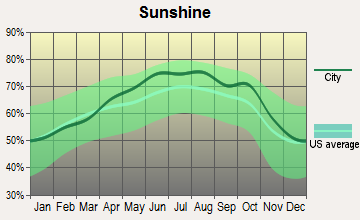
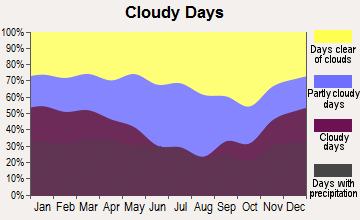
Average climate in Jonesboro, Arkansas
Based on data reported by over 4,000 weather stations
|
|

Tornado activity:
Jonesboro-area historical tornado activity is near Arkansas state average. It is 124% greater than the overall U.S. average.
On 5/26/1973, a category F4 (max. wind speeds 207-260 mph) tornado 0.8 miles away from the Jonesboro city center killed 3 people and injured 289 people and caused between $5000 and $50,000 in damages.
On 3/15/1984, a category F4 tornado 23.6 miles away from the city center killed 5 people and injured 12 people and caused between $5,000,000 and $50,000,000 in damages.
Earthquake activity:
Jonesboro-area historical earthquake activity is significantly above Arkansas state average. It is 444% greater than the overall U.S. average.On 3/25/1976 at 00:41:20, a magnitude 5.0 (4.9 MB, 5.0 LG, Class: Moderate, Intensity: VI - VII) earthquake occurred 24.5 miles away from the city center
On 5/4/1991 at 01:18:54, a magnitude 5.0 (4.4 MB, 4.6 LG, 5.0 LG, Depth: 3.1 mi) earthquake occurred 70.4 miles away from Jonesboro center
On 9/26/1990 at 13:18:51, a magnitude 5.0 (4.7 MB, 4.8 LG, 5.0 LG, Depth: 7.7 mi) earthquake occurred 112.8 miles away from the city center
On 4/27/1989 at 16:47:49, a magnitude 4.7 (4.6 MB, 4.7 LG, 4.3 LG, Class: Light, Intensity: IV - V) earthquake occurred 53.3 miles away from Jonesboro center
On 3/25/1976 at 01:00:11, a magnitude 4.5 (4.1 MB, 4.5 LG) earthquake occurred 19.3 miles away from Jonesboro center
On 5/4/2001 at 06:42:12, a magnitude 4.7 (4.2 MB, 4.7 LG, 4.5 LG) earthquake occurred 94.8 miles away from the city center
Magnitude types: regional Lg-wave magnitude (LG), body-wave magnitude (MB)
Natural disasters:
The number of natural disasters in Craighead County (22) is greater than the US average (15).Major Disasters (Presidential) Declared: 17
Emergencies Declared: 2
Causes of natural disasters: Storms: 16, Floods: 13, Tornadoes: 9, Winds: 2, Winter Storms: 2, Hurricane: 1, Ice Storm: 1, Tropical Storm: 1, Other: 1 (Note: some incidents may be assigned to more than one category).
Hospitals in Jonesboro:
- JONESBORO HUMAN DEVELOPMENT CENTER (4701 COLONY DRIVE)
- NEA BAPTIST MEMORIAL HOSPITAL (Voluntary non-profit - Private, 3024 STADIUM BOULEVARD)
- OUTPATIENT SURGERY CENTER OF JONESBORO (110 EAST MATTHEWS)
- ST BERNARDS MEDICAL CENTER (Voluntary non-profit - Private, 225 E JACKSON)
- ST BERNARDS REGIONAL MED CTR H (1726 MARIE CIRCLE)
Nursing Homes in Jonesboro:
- CRAIGHEAD NURSING CENTER (5101 HARRISBURG RD)
- GERIATRICS NURSING CENTER (800 SOUTHWEST DR)
- JONESBORO HEALTHCARE CENTER (800 SOUTHWEST DRIVE)
- RIDGECREST HEALTH AND REHABILITATION (3016 N. CHURCH STREET)
- ROSE CARE CENTER OF JONESBORO (3016 N CHURCH ST)
- SKILCARE NURSING CENTER (2911 BROWNS LANE)
- ST ELIZABETH'S PLACE (3010 MIDDLEFIELD DRIVE)
Dialysis Facilities in Jonesboro:
Home Health Centers in Jonesboro:
Airports and heliports located in Jonesboro:
- Jonesboro Municipal Airport (JBR) (Runways: 2, Air Taxi Ops: 2,606, Itinerant Ops: 5,500, Local Ops: 12,000, Military Ops: 50)
- Classic Airstrip Airport (23AR) (Runways: 1)
- Nea Baptist Hospital Heliport (AR60)
- Regional Medical Center Heliport (0AR5)
Colleges/Universities in Jonesboro:
- Arkansas State University-Main Campus (Full-time enrollment: 12,323; Location: 2105 E. Aggie Road; Public; Website: www2.astate.edu; Offers Doctor's degree)
- Arkansas State University-System Office (Location: 2400 East Highland Drive, 3rd Floor, Suite 300; Public; Website: www.asusystem.edu; Offers Doctor's degree)
Other colleges/universities with over 2000 students near Jonesboro:
- Southwest Tennessee Community College (about 61 miles; Memphis, TN; Full-time enrollment: 8,043)
- Rhodes College (about 62 miles; Memphis, TN; FT enrollment: 2,052)
- University of Memphis (about 64 miles; Memphis, TN; FT enrollment: 17,427)
- Three Rivers Community College (about 68 miles; Poplar Bluff, MO; FT enrollment: 3,360)
- Harding University (about 71 miles; Searcy, AR; FT enrollment: 5,360)
- Dyersburg State Community College (about 75 miles; Dyersburg, TN; FT enrollment: 2,211)
- Arkansas State University-Beebe (about 86 miles; Beebe, AR; FT enrollment: 3,387)
Public high schools in Jonesboro:
- WESTSIDE HIGH SCHOOL (Location: 1630 HWY 91 W, Grades: 8-12)
- ANNIE CAMP JR. HIGH SCHOOL (Location: 1814 W NETTLETON AVE, Grades: 7-9)
- DOUGLAS MACARTHUR JHS (Location: 1615 WILKINS AVE, Grades: 7-9)
- THE ACADEMIES AT JONESBORO HIGH SCHOOL (Location: 301 HURRICANE DR, Grades: 10-12, Charter school)
- JONESBORO VOCATIONAL CENTER (Location: 1727 S MAIN ST, Grades: 9-12)
- NETTLETON HIGH SCHOOL (Location: 4201 CHIEFTAIN LANE, Grades: 9-12)
- NETTLETON JUNIOR HIGH SCHOOL (Location: 4208 CHIEFTAIN LANE, Grades: 7-9)
- VALLEY VIEW HIGH SCHOOL (Location: 2118 VALLEY VIEW DR, Grades: 10-12)
- VALLEY VIEW JUNIOR HIGH SCHOOL (Location: 2118 VALLEY VIEW DRIVE, Grades: 7-9)
Private high school in Jonesboro:
Biggest public elementary/middle schools in Jonesboro:
- WESTSIDE MIDDLE SCHOOL (Location: 1800 HWY 91 W, Grades: 5-7)
- WESTSIDE ELEMENTARY SCHOOL (Location: 1834 HWY 91 W, Grades: PK-4)
- INTERNATIONAL STUDIES MAGNET (Location: 1218 COBB ST, Grades: 1-6)
- VISUAL & PERFORMING ART MAGNET (Location: 1804 HILLCREST DR, Grades: 1-6)
- MATH & SCIENCE MAGNET SCHOOL (Location: 213 E THOMAS GREEN RD, Grades: 1-6)
- HEALTH/WELLNESS ENVI MAGNET (Location: 1001 ROSEMOND AVE, Grades: 1-6)
- MICROSOCIETY MAGNET SCHOOL (Location: 1110 W WASHINGTON AVE, Grades: 1-6)
- NETTLETON INTERMEDIATE CENTER (Location: 3801 VERA ST, Grades: 3-5)
- FOX MEADOW ELEMENTARY (Location: 2305 FOX MEADOW LANE, Grades: KG-2)
- UNIVERSITY HGTS. ELEM. SCHOOL (Location: 300 BOWLING LANE, Grades: KG-2)
Private elementary/middle schools in Jonesboro:
Points of interest:
Notable locations in Jonesboro: Northeast District Livestock Show and Fairgrounds (A), Jonesboro Industrial Park (B), Jonesboro Industrial Development Corporation Industrial Park (C), Jonesboro Country Club (D), Arkansas Childrens Colony (E), Airport Industrial Park (F), Craig Hills Public Golf Course (G), Southridge Fire Department Station 2 (H), Arkansas State Police Troop C (I), Arkansas Game and Fish Commission Law Enforcement - Northeast Regional Office (J), Federal Bureau of Investigation Jonesboro Resident Office (K), Arkansas State University Police Department (L), Jonesboro Police Department (M), Arkansas Services Center (N), Craighead County Sheriff's Office (O), Jonesboro Fire Station 3 (P), Jonesboro Fire Station 4 (Q), Booker T Washington Community Center (R), Craighead County and Jonesboro Public Library (S), Craighead County Courthouse (T). Display/hide their locations on the map
Shopping Centers: Indian Mall Shopping Center (1), Highland Square Shopping Center (2), Caraway Plaza Shopping Center (3), Airport Center Shopping Center (4), West Mart Center Shopping Center (5). Display/hide their locations on the map
Churches in Jonesboro include: Cottage Home Church (A), Blessed Sacrement Catholic Church (B), Carter Temple Christian Methodist Episcopal Church (C), Church of Christ (D), First Baptist Church (E), First Christian Church (F), First Nazarene Church (G), First United Methodist Church (H), First United Pentecostal Church (I). Display/hide their locations on the map
Cemeteries: Sharp Cemetery (1), Kelly Cemetery (2), Pine Hill Cemetery (3), Philadelphia Cemetery (4), Mount Sinai Cemetery (5), Temple of Israel Cemetery (6), McDaniel Cemetery (7). Display/hide their locations on the map
Reservoirs: Big Creek Site 14 Reservoir (A), Big Creek Site 13 Reservoir (B), Craighead Forest Lake (C), Poinsett Watershed Site 20 Reservoir (D), Big Pond (E), Big Creek Site 22 Reservoir (F), Mary Simpson Pond (G), Big Creek Site 21 Reservoir (H). Display/hide their locations on the map
Creeks: Lost Creek (A), Higginbottom Creek (B), Christian Creek (C). Display/hide their locations on the map
Parks in Jonesboro include: West Washington Avenue Historic District (1), Southside Softball Complex (2), Northside Park (3), Craighead Forest County Park (4), Southwest Park (5), Hope Park (6), Indian Stadium (7). Display/hide their locations on the map
Tourist attractions: Happy Talk (Cultural Attractions- Events- & Facilities; 315 West Oak Avenue) (1), Artistic Pools & Design (Water Parks & Slides; 2404 Twin Oaks Avenue) (2), Total Project Cableing (Water Parks & Slides; 2404 Twin Oaks Avenue) (3), Silverball Game Room (Amusement & Theme Parks; 1901 South Caraway Road) (4), Jonesboro Music CO (Amusement & Theme Parks; 205A Bearden Drive) (5), TSI Amusements (Amusement & Theme Parks; 3106 Old Greensboro Road) (6), Kidsports Family Fun & Fitness (Amusement & Theme Parks; 2220 Grant Avenue Suite D) (7), Kidsports (Arcades & Amusements; 2220 Grant Avenue) (8), Travel With US (Tours & Charters; 2718 East Nettleton Avenue) (9). Display/hide their approximate locations on the map
Hotels: Ramada Limited (3000 Apache Drive) (1), West Washington Guest House (534 West Washington Avenue) (2), Motel 6 (2300 South Caraway Road) (3), Deluxe Inn (402 South Gee Street) (4), JAMI Bee Motel (3423 East Nettleton Avenue) (5), Baymont Inn (2910 Kazi Street) (6), Scottish Inns (3116 Mead Drive) (7), Hampton Inn Jonesboro (2900 Phillips Drive) (8), Super 8 Motel (2500 South Caraway Road) (9). Display/hide their approximate locations on the map
Courts: Craighead-County - County Probate Court Clerk (511 South Main Street) (1), Craighead-County - Court Administrator (511 Union Street) (2), Craighead-County - District Court- Civil & Small Claims (511 South Main Street) (3), Frequently Called City County State And Federal Government Num - Chancery Court C (511 South Main Street) (4), Arkansas-State - Vocational Technical Education Dept- Industrial Training Co-Ordin (5504 Krueger Drive) (5), Craighead-County - Treasurer (511 South Main Street) (6), Jonesboro-City - Municipal Court Clerk (410 West Washington Avenue) (7), U S Government - Courts- Federal Court Clerk (615 South Main Street) (8), Craighead-County - District Court- Jonesboro Tickets Info (511 South Main Street) (9). Display/hide their approximate locations on the map
Birthplace of: Clint Catalyst - Writer, Paul Caraway - General, Rocky Williform - Businessman, Alan Belcher - Martial artist, John Grisham - (born 1955), legal thrillers, Sally Kern - Politician, Rodger Bumpass - Voice actor, Wes Bentley - Actor, Jim Carroll (American football) - Football player, John Wesley Snyder (US Cabinet Secretary) - Secretary of the Treasury.
Drinking water stations with addresses in Jonesboro that have no violations reported:
- JONESBORO WATER SYSTEM (Population served: 72,835, Primary Water Source Type: Groundwater)
- JONESBORO WATER SYSTEM (Population served: 72,835, Primary Water Source Type: Groundwater)
- JONESBORO WATER SYSTEM (Population served: 72,835, Primary Water Source Type: Groundwater)
| This city: | 2.5 people |
| Arkansas: | 2.5 people |
| This city: | 63.7% |
| Whole state: | 67.6% |
| This city: | 6.2% |
| Whole state: | 5.7% |
Likely homosexual households (counted as self-reported same-sex unmarried-partner households)
- Lesbian couples: 0.3% of all households
- Gay men: 0.3% of all households
People in group quarters in Jonesboro in 2010:
- 1,948 people in college/university student housing
- 800 people in nursing facilities/skilled-nursing facilities
- 330 people in local jails and other municipal confinement facilities
- 108 people in state prisons
- 103 people in emergency and transitional shelters (with sleeping facilities) for people experiencing homelessness
- 56 people in other noninstitutional facilities
- 44 people in residential treatment centers for adults
- 21 people in group homes intended for adults
- 2 people in workers' group living quarters and job corps centers
People in group quarters in Jonesboro in 2000:
- 1,509 people in college dormitories (includes college quarters off campus)
- 480 people in nursing homes
- 200 people in local jails and other confinement facilities (including police lockups)
- 178 people in other noninstitutional group quarters
- 141 people in homes for the mentally retarded
- 28 people in other types of correctional institutions
- 16 people in homes or halfway houses for drug/alcohol abuse
- 10 people in homes for the mentally ill
- 7 people in other group homes
- 3 people in hospitals/wards and hospices for chronically ill
- 3 people in other hospitals or wards for chronically ill
- 2 people in religious group quarters
Banks with most branches in Jonesboro (2011 data):
- Liberty Bank of Arkansas: 7 branches. Info updated 2008/10/31: Bank assets: $2,807.0 mil, Deposits: $2,160.9 mil, local headquarters, positive income, Commercial Lending Specialization, 46 total offices, Holding Company: Liberty Bancshares, Inc
- BancorpSouth Bank: South Main Branch, Johnson Avenue Branch, West Parker Road Branch, American State Bank Branch. Info updated 2007/07/18: Bank assets: $12,990.3 mil, Deposits: $10,863.8 mil, headquarters in Tupelo, MS, positive income, Commercial Lending Specialization, 271 total offices, Holding Company: Bancorpsouth, Inc.
- Iberiabank: Jonesboro Branch, 3513 E. Johnson Ave Branch, Jonesboro Branch, Jonesboro Main Branch. Info updated 2011/06/08: Bank assets: $11,676.7 mil, Deposits: $9,387.9 mil, headquarters in Lafayette, LA, positive income, Commercial Lending Specialization, 187 total offices, Holding Company: Iberiabank Corporation
- Regions Bank: Southwest Drive Branch, Washington Branch, Jonesboro Branch, East Nettleton Branch. Info updated 2011/02/24: Bank assets: $123,368.2 mil, Deposits: $98,301.3 mil, headquarters in Birmingham, AL, positive income, Commercial Lending Specialization, 1778 total offices, Holding Company: Regions Financial Corporation
- Heritage Bank, National Association: at 2009 Browns Lane, Southwest Drive Branch, Downtown Branch, South Caraway Road Branch. Info updated 2010/07/08: Bank assets: $241.9 mil, Deposits: $193.8 mil, local headquarters, positive income, Commercial Lending Specialization, 8 total offices, Holding Company: First National Security Company
- First National Bank: Jonesboro/Hilltop Branch, Elk Park Branch, Highland Drive Branch. Info updated 2006/11/03: Bank assets: $676.3 mil, Deposits: $536.7 mil, headquarters in Paragould, AR, positive income, Agricultural Specialization, 9 total offices, Holding Company: First Paragould Bankshares, Inc.
- Simmons First Bank of Northeast Arkansas: Mid-City Branch, Southwest Drive Branch, Simmons First Bank Of Northeast Arka. Info updated 2011/01/04: Bank assets: $340.3 mil, Deposits: $295.0 mil, local headquarters, positive income, Commercial Lending Specialization, 5 total offices, Holding Company: Simmons First National Corporation
- Focus Bank: Jonesboro Branch, Hilltop Branch, Jonesboro Southwest Drive Facility. Info updated 2006/08/10: Bank assets: $659.4 mil, Deposits: $506.7 mil, headquarters in Charleston, MO, positive income, Commercial Lending Specialization, 13 total offices, Holding Company: Security State Bancshares, Inc.
- Bank of America, National Association: Highland Branch at 2500 East Highland Drive, branch established on 1992/03/13; Southwest Branch at 630 Southwest Drive, branch established on 1970/05/22. Info updated 2009/11/18: Bank assets: $1,451,969.3 mil, Deposits: $1,077,176.8 mil, headquarters in Charlotte, NC, positive income, 5782 total offices, Holding Company: Bank Of America Corporation
- 4 other banks with 5 local branches
For population 15 years and over in Jonesboro:

- Never married: 33.9%
- Now married: 48.0%
- Separated: 1.2%
- Widowed: 5.0%
- Divorced: 11.9%
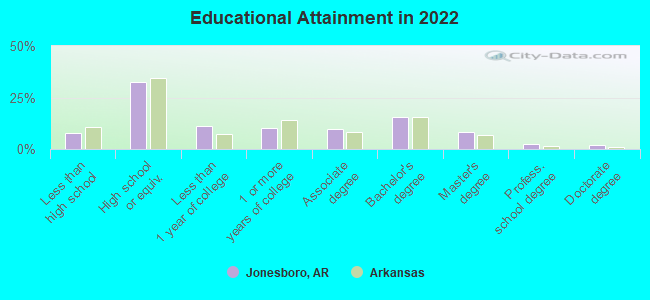
For population 25 years and over in Jonesboro:
- High school or higher: 92.1%
- Bachelor's degree or higher: 28.1%
- Graduate or professional degree: 12.7%
- Unemployed: 6.4%
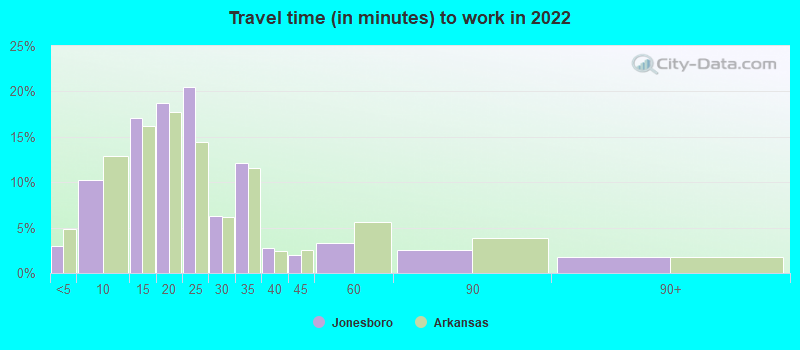
- Mean travel time to work (commute): 18.7 minutes
| Here: | 11.2 |
| Arkansas average: | 11.4 |
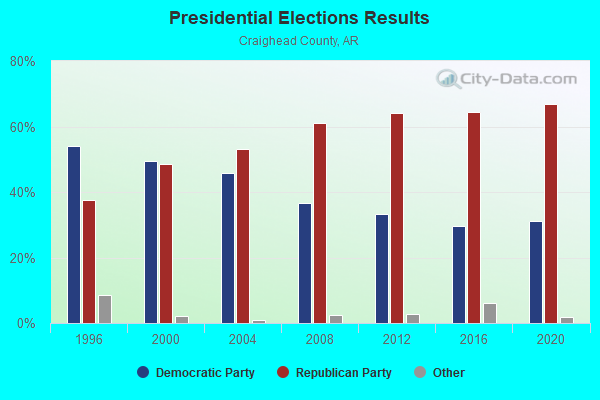
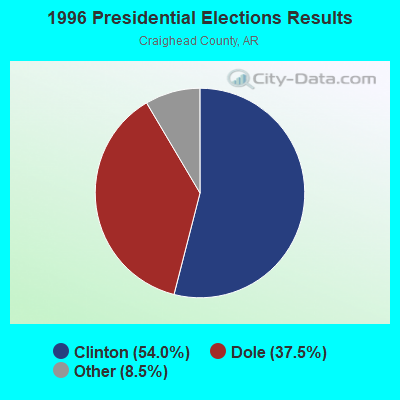
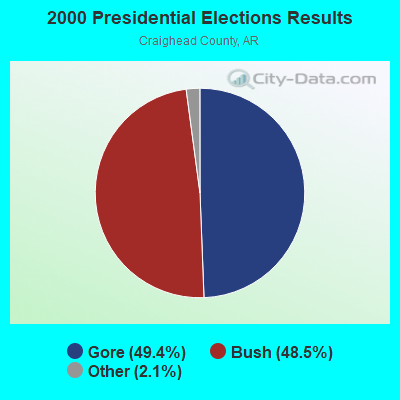
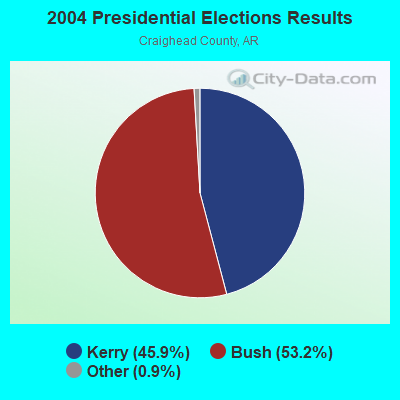
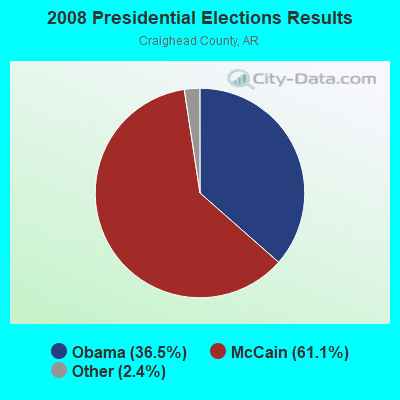
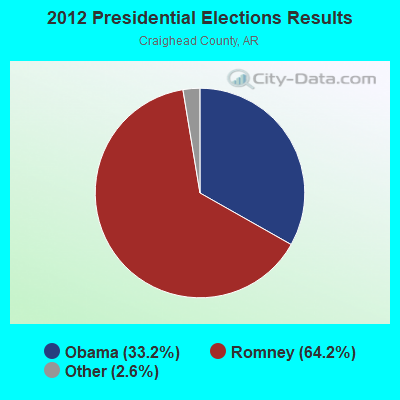
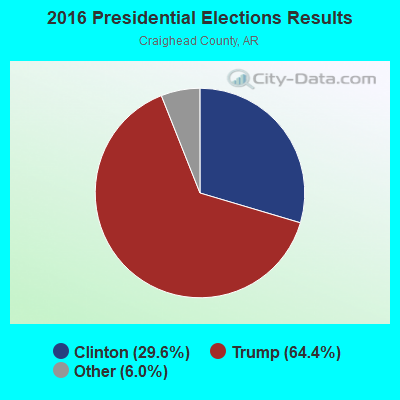
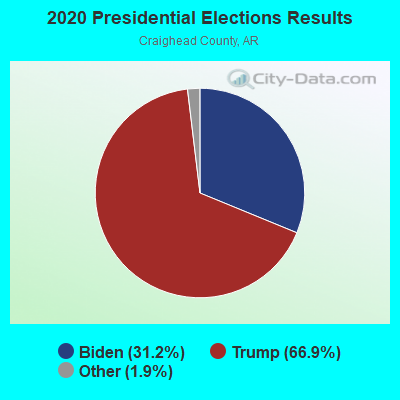
Graphs represent county-level data. Detailed 2008 Election Results
Religion statistics for Jonesboro, AR (based on Craighead County data)
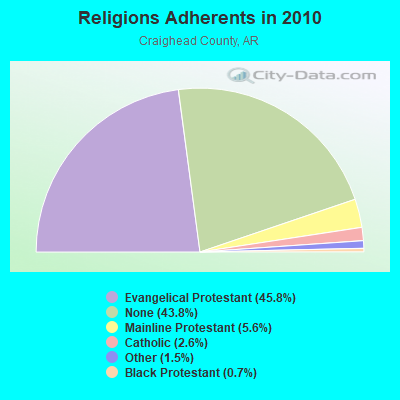
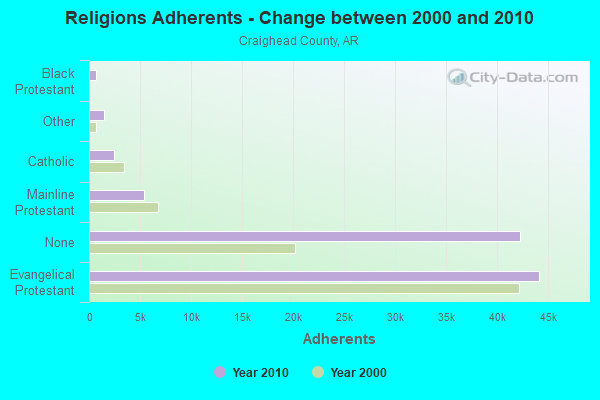
| Religion | Adherents | Congregations |
|---|---|---|
| Evangelical Protestant | 44,184 | 129 |
| Mainline Protestant | 5,408 | 24 |
| Catholic | 2,470 | 2 |
| Other | 1,477 | 10 |
| Black Protestant | 655 | 5 |
| None | 42,249 | - |
Food Environment Statistics:
| Craighead County: | 2.42 / 10,000 pop. |
| Arkansas: | 2.02 / 10,000 pop. |
| Craighead County: | 0.33 / 10,000 pop. |
| Arkansas: | 0.25 / 10,000 pop. |
| Here: | 0.22 / 10,000 pop. |
| Arkansas: | 0.59 / 10,000 pop. |
| Here: | 4.52 / 10,000 pop. |
| Arkansas: | 4.94 / 10,000 pop. |
| Here: | 8.16 / 10,000 pop. |
| Arkansas: | 6.66 / 10,000 pop. |
| This county: | 8.6% |
| Arkansas: | 9.8% |
| This county: | 29.3% |
| Arkansas: | 29.1% |
| Here: | 13.4% |
| State: | 13.6% |
Health and Nutrition:
| Jonesboro: | 48.0% |
| Arkansas: | 48.2% |
| Jonesboro: | 44.3% |
| Arkansas: | 44.2% |
| Jonesboro: | 28.5 |
| State: | 28.9 |
| This city: | 21.3% |
| Arkansas: | 21.6% |
| This city: | 11.3% |
| State: | 11.3% |
| Jonesboro: | 6.8 |
| Arkansas: | 6.8 |
| This city: | 32.0% |
| State: | 34.0% |
| Jonesboro: | 55.2% |
| State: | 54.4% |
| This city: | 78.8% |
| Arkansas: | 78.0% |
More about Health and Nutrition of Jonesboro, AR Residents
| Local government employment and payroll (March 2022) | |||||
| Function | Full-time employees | Monthly full-time payroll | Average yearly full-time wage | Part-time employees | Monthly part-time payroll |
|---|---|---|---|---|---|
| Electric Power | 122 | $724,992 | $71,311 | 3 | $3,183 |
| Police Protection - Officers | 113 | $418,062 | $44,396 | 0 | $0 |
| Firefighters | 110 | $516,088 | $56,301 | 0 | $0 |
| Police - Other | 72 | $318,330 | $53,055 | 0 | $0 |
| Streets and Highways | 60 | $208,869 | $41,774 | 0 | $0 |
| Other and Unallocable | 49 | $244,880 | $59,971 | 10 | $11,195 |
| Water Supply | 41 | $241,714 | $70,746 | 0 | $0 |
| Solid Waste Management | 38 | $134,124 | $42,355 | 3 | $4,398 |
| Sewerage | 38 | $191,826 | $60,577 | 1 | $664 |
| Other Government Administration | 23 | $129,425 | $67,526 | 16 | $10,467 |
| Parks and Recreation | 20 | $77,272 | $46,363 | 0 | $0 |
| Transit | 16 | $54,381 | $40,786 | 0 | $0 |
| Fire - Other | 14 | $96,658 | $82,850 | 0 | $0 |
| Correction | 13 | $52,587 | $48,542 | 0 | $0 |
| Financial Administration | 12 | $61,170 | $61,170 | 3 | $5,976 |
| Health | 10 | $31,381 | $37,657 | 0 | $0 |
| Judicial and Legal | 7 | $33,659 | $57,701 | 0 | $0 |
| Housing and Community Development (Local) | 6 | $32,406 | $64,812 | 1 | $3,162 |
| Totals for Government | 764 | $3,567,823 | $56,039 | 37 | $39,046 |
Jonesboro government finances - Expenditure in 2021 (per resident):
- Construction - General - Other: $3,520,000 ($44.07)
Regular Highways: $2,727,000 ($34.14)
Air Transportation: $2,684,000 ($33.60)
Parks and Recreation: $1,738,000 ($21.76)
Central Staff Services: $542,000 ($6.79)
Transit Utilities: $281,000 ($3.52)
Health - Other: $215,000 ($2.69)
- Current Operations - Electric Utilities: $66,629,000 ($834.16)
Police Protection: $13,601,000 ($170.28)
Local Fire Protection: $10,598,000 ($132.68)
Water Utilities: $6,428,000 ($80.47)
Sewerage: $5,461,000 ($68.37)
Regular Highways: $4,870,000 ($60.97)
Solid Waste Management: $3,304,000 ($41.36)
Parks and Recreation: $3,208,000 ($40.16)
Central Staff Services: $2,136,000 ($26.74)
General - Other: $1,431,000 ($17.92)
Transit Utilities: $1,325,000 ($16.59)
Health - Other: $901,000 ($11.28)
General Public Buildings: $830,000 ($10.39)
Protective Inspection and Regulation - Other: $756,000 ($9.46)
Housing and Community Development: $704,000 ($8.81)
Financial Administration: $587,000 ($7.35)
Judicial and Legal Services: $506,000 ($6.33)
Air Transportation: $376,000 ($4.71)
Miscellaneous Commercial Activities - Other: $259,000 ($3.24)
- Electric Utilities - Interest on Debt: $526,000 ($6.59)
- General - Interest on Debt: $10,811,000 ($135.35)
- Intergovernmental to Local - Other - Libraries: $2,752,000 ($34.45)
Other - Correctional Institutions: $2,487,000 ($31.14)
Other - Solid Waste Management: $1,581,000 ($19.79)
Other - Judicial and Legal Services: $443,000 ($5.55)
- Other Capital Outlay - Electric Utilities: $22,823,000 ($285.73)
Sewerage: $10,355,000 ($129.64)
Water Utilities: $1,710,000 ($21.41)
Police Protection: $1,611,000 ($20.17)
Local Fire Protection: $1,448,000 ($18.13)
Regular Highways: $883,000 ($11.05)
Parks and Recreation: $314,000 ($3.93)
Central Staff Services: $311,000 ($3.89)
Health - Other: $144,000 ($1.80)
General - Other: $117,000 ($1.46)
General Public Building: $88,000 ($1.10)
Solid Waste Management: $60,000 ($0.75)
- Total Salaries and Wages: $14,611,000 ($182.92)
Jonesboro government finances - Revenue in 2021 (per resident):
- Charges - Sewerage: $8,749,000 ($109.53)
Parks and Recreation: $471,000 ($5.90)
Air Transportation: $328,000 ($4.11)
Other: $216,000 ($2.70)
Regular Highways: $182,000 ($2.28)
Solid Waste Management: $88,000 ($1.10)
Miscellaneous Commercial Activities: $40,000 ($0.50)
- Federal Intergovernmental - Health and Hospitals: $2,665,000 ($33.36)
Other: $992,000 ($12.42)
Housing and Community Development: $787,000 ($9.85)
Transit Utilities: $724,000 ($9.06)
Air Transportation: $204,000 ($2.55)
- Local Intergovernmental - General Local Government Support: $15,903,000 ($199.10)
Other: $1,528,000 ($19.13)
- Miscellaneous - Interest Earnings: $16,761,000 ($209.84)
General Revenue - Other: $11,292,000 ($141.37)
Fines and Forfeits: $1,941,000 ($24.30)
Special Assessments: $1,847,000 ($23.12)
Sale of Property: $312,000 ($3.91)
Rents: $182,000 ($2.28)
- Revenue - Electric Utilities: $80,660,000 ($1009.82)
Water Utilities: $10,981,000 ($137.48)
Transit Utilities: $57,000 ($0.71)
- State Intergovernmental - Highways: $5,819,000 ($72.85)
General Local Government Support: $1,127,000 ($14.11)
Housing and Community Development: $103,000 ($1.29)
Other: $88,000 ($1.10)
Transit Utilities: $71,000 ($0.89)
- Tax - General Sales and Gross Receipts: $22,811,000 ($285.58)
Property: $6,275,000 ($78.56)
Public Utilities Sales: $1,684,000 ($21.08)
Occupation and Business License - Other: $1,189,000 ($14.89)
Other License: $740,000 ($9.26)
Alcoholic Beverage Sales: $567,000 ($7.10)
Other Selective Sales: $548,000 ($6.86)
Jonesboro government finances - Debt in 2021 (per resident):
- Long Term Debt - Beginning Outstanding - Public Debt for Private Purpose: $268,085,000 ($3356.26)
Outstanding Nonguaranteed - Industrial Revenue: $266,030,000 ($3330.54)
Outstanding Unspecified Public Purpose: $26,093,000 ($326.67)
Issue, Unspecified Public Purpose: $26,093,000 ($326.67)
Retired Nonguaranteed - Public Debt for Private Purpose: $2,055,000 ($25.73)
Jonesboro government finances - Cash and Securities in 2021 (per resident):
- Bond Funds - Cash and Securities: $19,825,000 ($248.20)
- Other Funds - Cash and Securities: $218,189,000 ($2731.60)
- Sinking Funds - Cash and Securities: $266,030,000 ($3330.54)
| Businesses in Jonesboro, AR | ||||
| Name | Count | Name | Count | |
|---|---|---|---|---|
| AT&T | 3 | KFC | 3 | |
| Academy Sports + Outdoors | 1 | Kincaid | 1 | |
| Ace Hardware | 1 | Kmart | 1 | |
| Advance Auto Parts | 2 | Kohl's | 1 | |
| Aeropostale | 1 | Kroger | 1 | |
| American Eagle Outfitters | 1 | La-Z-Boy | 2 | |
| Arby's | 1 | Lane Bryant | 1 | |
| Ashley Furniture | 1 | Lane Furniture | 5 | |
| AutoZone | 2 | Little Caesars Pizza | 1 | |
| Barnes & Noble | 1 | Lowe's | 1 | |
| Baskin-Robbins | 2 | Marriott | 1 | |
| Bath & Body Works | 1 | MasterBrand Cabinets | 1 | |
| Baymont Inn | 1 | Maurices | 1 | |
| Bed Bath & Beyond | 1 | McDonald's | 4 | |
| Blockbuster | 1 | Motel 6 | 1 | |
| Burger King | 3 | New York & Co | 1 | |
| Casual Male XL | 1 | Nike | 8 | |
| Charlotte Russe | 1 | Nissan | 1 | |
| Chevrolet | 1 | Office Depot | 1 | |
| Chick-Fil-A | 2 | OfficeMax | 1 | |
| Chico's | 1 | Old Navy | 1 | |
| Chuck E. Cheese's | 1 | Olive Garden | 1 | |
| Church's Chicken | 1 | Outback | 1 | |
| Cinnabon | 1 | Outback Steakhouse | 1 | |
| Coldwater Creek | 1 | Papa John's Pizza | 1 | |
| Comfort Suites | 1 | Payless | 2 | |
| Cracker Barrel | 1 | Penske | 1 | |
| Cricket Wireless | 2 | Pier 1 Imports | 1 | |
| Curves | 1 | Pizza Hut | 2 | |
| DHL | 2 | Popeyes | 1 | |
| Days Inn | 1 | Quiznos | 1 | |
| Domino's Pizza | 2 | RadioShack | 2 | |
| DressBarn | 1 | Red Lobster | 1 | |
| Dressbarn | 1 | Ruby Tuesday | 1 | |
| Econo Lodge | 1 | Rue21 | 1 | |
| Express | 1 | Ryan's Grill | 1 | |
| FedEx | 8 | SONIC Drive-In | 6 | |
| Finish Line | 1 | Sam's Club | 1 | |
| Firestone Complete Auto Care | 1 | Sears | 2 | |
| Ford | 1 | Shoe Carnival | 1 | |
| GNC | 1 | Spencer Gifts | 1 | |
| GameStop | 2 | Sprint Nextel | 1 | |
| Gap | 1 | Starbucks | 1 | |
| Goodwill | 1 | Subway | 5 | |
| H&R Block | 4 | Super 8 | 1 | |
| Hardee's | 1 | T-Mobile | 2 | |
| Haworth | 1 | T.J.Maxx | 1 | |
| Hilton | 1 | Taco Bell | 3 | |
| Hobby Lobby | 1 | Target | 1 | |
| Holiday Inn | 3 | Toyota | 1 | |
| Hollister Co. | 1 | U-Haul | 2 | |
| Home Depot | 1 | UPS | 11 | |
| Honda | 1 | Vans | 2 | |
| Hot Topic | 1 | Verizon Wireless | 1 | |
| Hyundai | 1 | Victoria's Secret | 1 | |
| IHOP | 1 | Waffle House | 2 | |
| JCPenney | 1 | Walgreens | 2 | |
| JoS. A. Bank | 1 | Walmart | 2 | |
| Jones New York | 5 | Wendy's | 3 | |
| Journeys | 1 | YMCA | 1 | |
| Justice | 1 | |||
Strongest AM radio stations in Jonesboro:
- KBTM (1230 AM; 1 kW; JONESBORO, AR; Owner: CAPSTAR TX LIMITED PARTNERSHIP)
- KNEA (970 AM; 1 kW; JONESBORO, AR; Owner: CLEAR CHANNEL BROADCASTING LICENSES, INC.)
- WDIA (1070 AM; 50 kW; MEMPHIS, TN; Owner: CLEAR CHANNEL BROADCASTING LICENSES, INC.)
- WCRV (640 AM; 50 kW; COLLIERVILLE, TN; Owner: BOTT BROADCASTING COMPANY/TENNESSEE)
- WGSF (1030 AM; 50 kW; MEMPHIS, TN; Owner: FLINN BROADCASTING CORPORATION)
- WMQM (1600 AM; 50 kW; LAKELAND, TN; Owner: WMQM, INC.)
- KOTC (830 AM; daytime; 10 kW; KENNETT, MO; Owner: EAGLE BLUFF ENTERPRISES)
- WJCE (680 AM; 10 kW; MEMPHIS, TN; Owner: ENTERCOM MEMPHIS LICENSE, LLC)
- KGHT (880 AM; 50 kW; SHERIDAN, AR; Owner: METROPOLITAN RADIO GROUP, INC.)
- KAAY (1090 AM; 50 kW; LITTLE ROCK, AR; Owner: CITADEL BROADCASTING COMPANY)
- KWAM (990 AM; 10 kW; MEMPHIS, TN; Owner: CONCORD MEDIA GROUP, INC.)
- WHBQ (560 AM; 5 kW; MEMPHIS, TN; Owner: FLINN BROADCASTING CORPORATION)
- KLCN (910 AM; 5 kW; BLYTHEVILLE, AR; Owner: SUDBURY SERVICES, INC.)
Strongest FM radio stations in Jonesboro:
- KFIN (107.9 FM; JONESBORO, AR; Owner: CAPSTAR TX LIMITED PARTNERSHIP)
- KASU (91.9 FM; JONESBORO, AR; Owner: ARKANSAS STATE UNIVERSITY)
- KIYS (101.9 FM; JONESBORO, AR; Owner: ,CAPSTAR TX LIMITED PARTNERSHIP)
- KDEZ (100.5 FM; JONESBORO, AR; Owner: SAGA COMMUNICATIONS OF ARKANSAS, LLC)
- KBZR (95.9 FM; HARRISBURG, AR; Owner: CLEAR CHANNEL BROADCASTING LICENSES, INC.)
- KDXY (104.9 FM; LAKE CITY, AR; Owner: SAGA COMMUNICATIONS OF ARKANSAS, LLC)
- KAOG (90.5 FM; JONESBORO, AR; Owner: AMERICAN FAMILY ASSOCIATION)
- KJBX (106.7 FM; TRUMANN, AR; Owner: SAGA COMMUNICATIONS OF ARKANSAS, LLC)
- KDRS-FM (107.1 FM; PARAGOULD, AR; Owner: MOR MEDIA, INC.)
- WJZN (98.9 FM; MUNFORD, TN; Owner: MEMPHIS III LIMITED PARTNERSHIP)
- WYPL (89.3 FM; MEMPHIS, TN; Owner: MEMPHIS/SHELBY COUNTY PUBLIC LIBRARY & INFO CNTR.)
- KJLV (105.3 FM; HOXIE, AR; Owner: EDUCATIONAL MEDIA FOUNDATION)
- KJBR (93.7 FM; MARKED TREE, AR; Owner: EDUCATIONAL MEDIA FOUNDATION)
- K218DE (91.5 FM; JONESBORO, AR; Owner: CALVARY CHAPEL OF TWIN FALLS, INC.)
- K202CG (88.3 FM; JONESBORO, AR; Owner: FAMILY STATIONS, INC.)
TV broadcast stations around Jonesboro:
- KTEJ (Channel 19; JONESBORO, AR; Owner: ARKANSAS EDUCATIONAL TELEVISION COMMISSION)
- K54ER (Channel 54; JONESBORO, AR; Owner: TRINITY BROADCASTING NETWORK)
- K46EM (Channel 46; BATESVILLE, AR; Owner: MS COMMUNICATIONS, LLC)
- KAIT (Channel 8; JONESBORO, AR; Owner: LIBCO, INC.)
- KVTJ (Channel 48; JONESBORO, AR; Owner: AGAPE CHURCH, INC.)
- K27FC (Channel 27; PARAGOULD, AR; Owner: TRINITY BROADCASTING NETWORK)
- National Bridge Inventory (NBI) Statistics
- 238Number of bridges
- 2,106ft / 642mTotal length
- $4,030,000Total costs
- 1,390,642Total average daily traffic
- 56,194Total average daily truck traffic
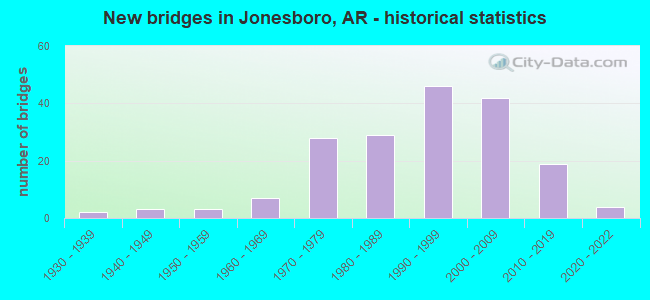
- New bridges - historical statistics
- 21930-1939
- 31940-1949
- 31950-1959
- 71960-1969
- 281970-1979
- 291980-1989
- 461990-1999
- 422000-2009
- 192010-2019
- 42020-2022
FCC Registered Antenna Towers: 476 (See the full list of FCC Registered Antenna Towers)
FCC Registered Commercial Land Mobile Towers: 5 (See the full list of FCC Registered Commercial Land Mobile Towers in Jonesboro, AR)
FCC Registered Private Land Mobile Towers: 5 (See the full list of FCC Registered Private Land Mobile Towers)
FCC Registered Broadcast Land Mobile Towers: 63 (See the full list of FCC Registered Broadcast Land Mobile Towers)
FCC Registered Microwave Towers: 55 (See the full list of FCC Registered Microwave Towers in this town)
FCC Registered Paging Towers: 9 (See the full list of FCC Registered Paging Towers)
FCC Registered Maritime Coast & Aviation Ground Towers: 4 (See the full list of FCC Registered Maritime Coast & Aviation Ground Towers)
FCC Registered Amateur Radio Licenses: 463 (See the full list of FCC Registered Amateur Radio Licenses in Jonesboro)
FAA Registered Aircraft Manufacturers and Dealers: 38 (See the full list of FAA Registered Manufacturers and Dealers in Jonesboro)
FAA Registered Aircraft: 170 (See the full list of FAA Registered Aircraft)
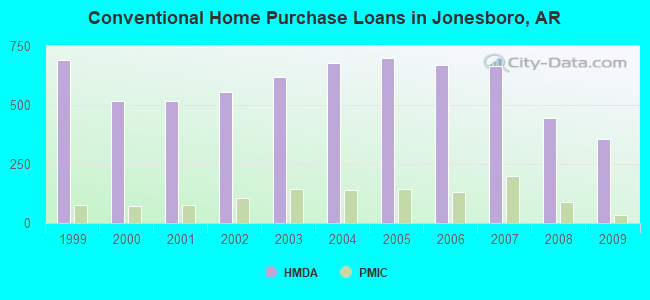
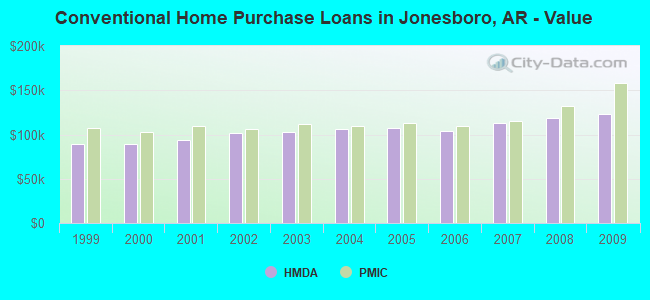
| Home Mortgage Disclosure Act Aggregated Statistics For Year 2009 (Based on 4 full and 5 partial tracts) | ||||||||||||||
| A) FHA, FSA/RHS & VA Home Purchase Loans | B) Conventional Home Purchase Loans | C) Refinancings | D) Home Improvement Loans | E) Loans on Dwellings For 5+ Families | F) Non-occupant Loans on < 5 Family Dwellings (A B C & D) | G) Loans On Manufactured Home Dwelling (A B C & D) | ||||||||
|---|---|---|---|---|---|---|---|---|---|---|---|---|---|---|
| Number | Average Value | Number | Average Value | Number | Average Value | Number | Average Value | Number | Average Value | Number | Average Value | Number | Average Value | |
| LOANS ORIGINATED | 287 | $122,985 | 354 | $123,132 | 772 | $146,234 | 98 | $39,158 | 21 | $362,844 | 327 | $108,069 | 16 | $31,738 |
| APPLICATIONS APPROVED, NOT ACCEPTED | 10 | $109,266 | 6 | $104,690 | 41 | $124,883 | 4 | $15,852 | 0 | $0 | 4 | $60,052 | 3 | $43,370 |
| APPLICATIONS DENIED | 26 | $143,052 | 49 | $96,349 | 177 | $128,303 | 28 | $42,269 | 4 | $1,014,000 | 24 | $69,410 | 14 | $58,759 |
| APPLICATIONS WITHDRAWN | 29 | $121,948 | 27 | $103,324 | 153 | $134,528 | 9 | $77,708 | 0 | $0 | 22 | $68,589 | 2 | $30,660 |
| FILES CLOSED FOR INCOMPLETENESS | 6 | $120,575 | 4 | $179,242 | 17 | $165,359 | 2 | $74,200 | 0 | $0 | 1 | $68,000 | 1 | $49,000 |
Detailed mortgage data for all 9 tracts in Jonesboro, AR
| Private Mortgage Insurance Companies Aggregated Statistics For Year 2009 (Based on 3 full and 5 partial tracts) | ||||||
| A) Conventional Home Purchase Loans | B) Refinancings | C) Non-occupant Loans on < 5 Family Dwellings (A & B) | ||||
|---|---|---|---|---|---|---|
| Number | Average Value | Number | Average Value | Number | Average Value | |
| LOANS ORIGINATED | 33 | $158,750 | 24 | $167,122 | 0 | $0 |
| APPLICATIONS APPROVED, NOT ACCEPTED | 4 | $180,368 | 6 | $151,388 | 1 | $52,970 |
| APPLICATIONS DENIED | 4 | $174,835 | 1 | $291,710 | 0 | $0 |
| APPLICATIONS WITHDRAWN | 0 | $0 | 2 | $121,845 | 0 | $0 |
| FILES CLOSED FOR INCOMPLETENESS | 1 | $72,000 | 0 | $0 | 0 | $0 |
2002 - 2018 National Fire Incident Reporting System (NFIRS) incidents
- Fire incident types reported to NFIRS in Jonesboro, AR
- 5,76056.5%Outside Fires
- 3,06330.1%Structure Fires
- 1,25712.3%Mobile Property/Vehicle Fires
- 1111.1%Other
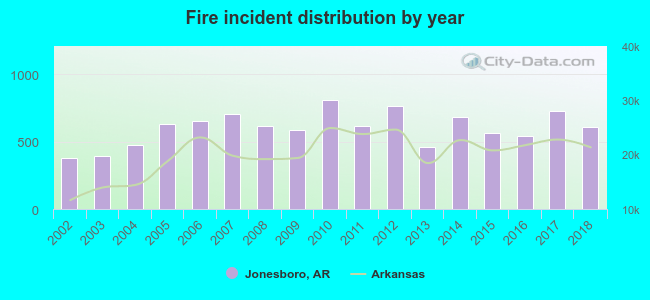 Based on the data from the years 2002 - 2018 the average number of fires per year is 599. The highest number of reported fire incidents - 805 took place in 2010, and the least - 378 in 2002. The data has a rising trend.
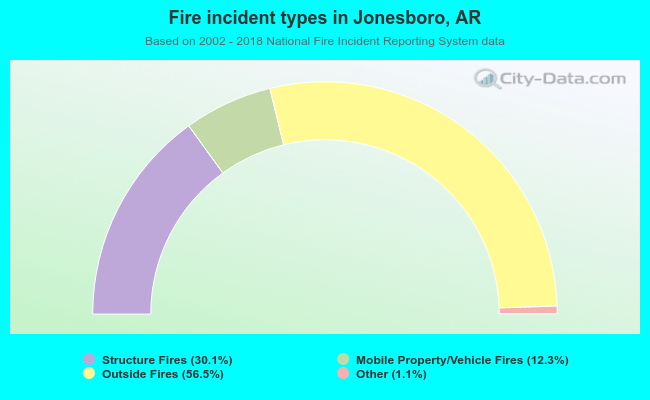 When looking into fire subcategories, the most incidents belonged to: Outside Fires (56.5%), and Structure Fires (30.1%).
Fire-safe hotels and motels in Jonesboro, Arkansas:
- Fairbridge Inn & Suites, 3006 S Caraway, Jonesboro, Arkansas 72401 , Phone: (870) 935-2030, Fax: (870) 935-3440
- Comfort Inn & Suites, 2911 Gilmore Dr, Jonesboro, Arkansas 72401 , Phone: (870) 972-9000, Fax: (870) 931-6407
- Econo Lodge, 2406 Phillips Dr, Jonesboro, Arkansas 72401 , Phone: (870) 932-9339, Fax: (870) 931-5289
- Holiday Inn Express, 2407 Phillips Dr, Jonesboro, Arkansas 72401 , Phone: (870) 932-5554, Fax: (870) 932-2586
- Lexington Suites Of Jonesboro, 2909 Kazi St, Jonesboro, Arkansas 72401 , Phone: (870) 802-3212, Fax: (870) 802-4183
- Days Inn Jonesboro, 2904 Phillips Dr, Jonesboro, Arkansas 72401 , Phone: (870) 972-8686, Fax: (870) 932-5785
- Super 8, 2500 S Caraway Rd, Jonesboro, Arkansas 72401 , Phone: (870) 972-0849, Fax: (870) 972-0464
- Fairfield Inn & Suites By Marriott, 3408 Access Rd, Jonesboro, Arkansas 72401 , Phone: (870) 934-1600, Fax: (714) 333-1831
- 6 other hotels and motels
| Most common first names in Jonesboro, AR among deceased individuals | ||
| Name | Count | Lived (average) |
|---|---|---|
| James | 432 | 72.3 years |
| William | 393 | 75.0 years |
| John | 320 | 73.7 years |
| Mary | 316 | 78.8 years |
| Charles | 204 | 71.9 years |
| Robert | 200 | 73.7 years |
| George | 122 | 74.5 years |
| Ruth | 115 | 80.6 years |
| Willie | 101 | 78.9 years |
| Ruby | 100 | 77.2 years |
| Most common last names in Jonesboro, AR among deceased individuals | ||
| Last name | Count | Lived (average) |
|---|---|---|
| Smith | 227 | 75.1 years |
| Johnson | 153 | 75.8 years |
| Jones | 135 | 73.2 years |
| Williams | 125 | 74.5 years |
| Davis | 124 | 74.9 years |
| Brown | 101 | 72.9 years |
| Taylor | 88 | 73.5 years |
| Moore | 78 | 74.8 years |
| Gibson | 78 | 77.0 years |
| Adams | 68 | 76.2 years |
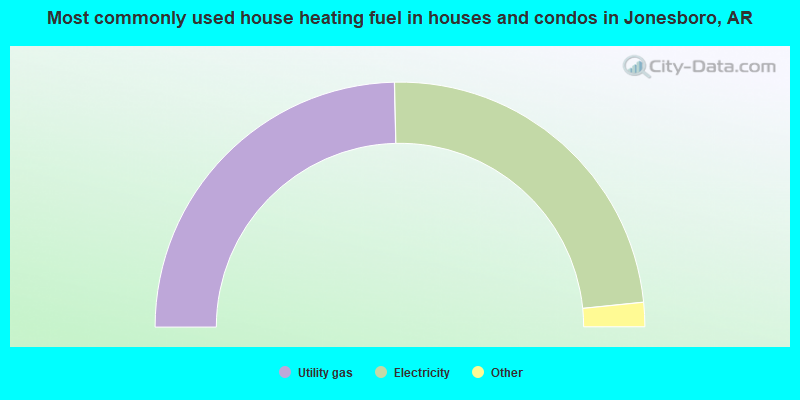
- 49.3%Utility gas
- 47.5%Electricity
- 2.0%Bottled, tank, or LP gas
- 0.8%No fuel used
- 0.1%Wood
- 0.1%Other fuel
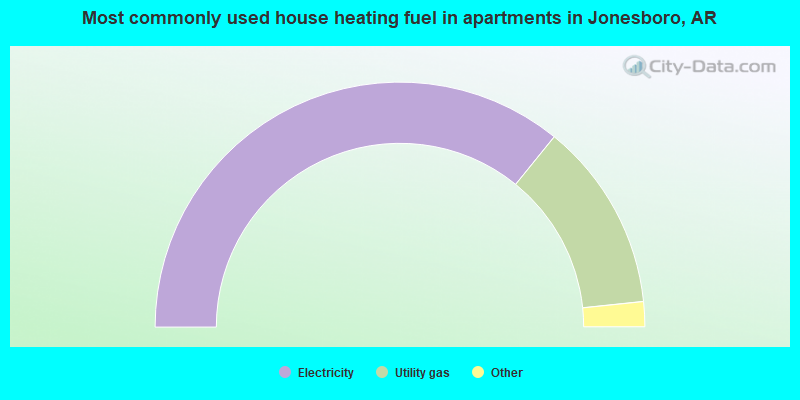
- 71.7%Electricity
- 25.0%Utility gas
- 2.5%Bottled, tank, or LP gas
- 0.6%Other fuel
- 0.2%No fuel used
Jonesboro compared to Arkansas state average:
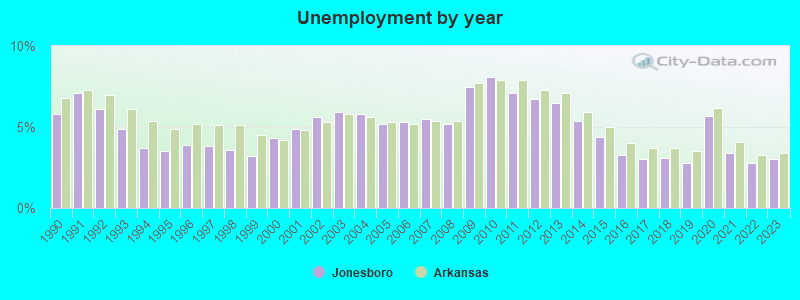
- Unemployed percentage below state average.
- Black race population percentage above state average.
- Median age below state average.
- Number of college students above state average.
- Percentage of population with a bachelor's degree or higher above state average.
Jonesboro on our top lists:
- #4 on the list of "Top 101 cities with largest percentage of females in occupations: health diagnosing and treating practitioners and other technical occupations (population 50,000+)"
- #8 on the list of "Top 101 cities with largest percentage of females in occupations: transportation occupations (population 50,000+)"
- #21 on the list of "Top 100 cities with shortest commuting times (pop. 50,000+)"
- #36 on the list of "Top 101 cities with largest percentage of females in occupations: life, physical, and social science occupations (population 50,000+)"
- #40 on the list of "Top 101 cities with the highest number of burglaries per 100,000 residents, excludes tourist destinations and others with a lot of outsiders visiting based on city industries data (population 50,000+)"
- #45 on the list of "Top 101 cities with the least people having professional degrees (population 50,000+)"
- #53 on the list of "Top 101 cities with most building permits per 10,000 residents (population 50,000+)"
- #59 on the list of "Top 101 cities with largest percentage of males in occupations: management occupations (population 50,000+)"
- #62 on the list of "Top 101 cities with largest percentage of females in industries: health care and social assistance (population 50,000+)"
- #63 on the list of "Top 101 cities with largest percentage of females in occupations: community and social service occupations (population 50,000+)"
- #66 on the list of "Top 101 cities with largest percentage of females in occupations: food preparation and serving related occupations (population 50,000+)"
- #74 on the list of "Top 101 cities with largest percentage of workers with very short commute times (9 minutes or less) (population 50,000+)"
- #76 on the list of "Top 101 cities with the highest percentage of English-only speaking households, population 50,000+"
- #83 on the list of "Top 101 cities with largest percentage of females in industries: retail trade (population 50,000+)"
- #86 on the list of "Top 101 cities with largest percentage of males in industries: leather and allied products (population 50,000+)"
- #86 on the list of "Top 101 cities with the largest city-data.com crime index decrease from 2011 to 2012 (population 50,000+)"
- #86 on the list of "Top 101 cities with largest percentage of females in industries: beverage and tobacco products (population 50,000+)"
- #86 on the list of "Top 101 cities with largest percentage of males in industries: vending machine operators (population 50,000+)"
- #87 on the list of "Top 101 cities with largest percentage of males in industries: water transportation (population 50,000+)"
- #87 on the list of "Top 101 cities with largest percentage of females in industries: leather and allied products (population 50,000+)"
- #66 on the list of "Top 101 counties with the largest number of people moving in compared to moving out (pop. 50,000+)"
- #79 on the list of "Top 101 counties with highest percentage of residents voting for 3rd party candidates in the 2012 Presidential Election (pop. 50,000+)"

|
|
Total of 89 patent applications in 2008-2024.