Estimated zip code population in 2022: 4,611 Zip code population in 2010: 4,979 Zip code population in 2000: 5,613
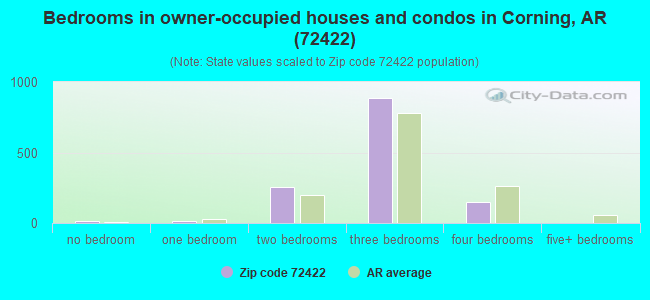
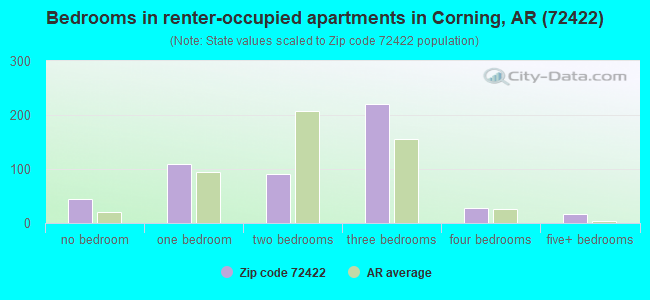
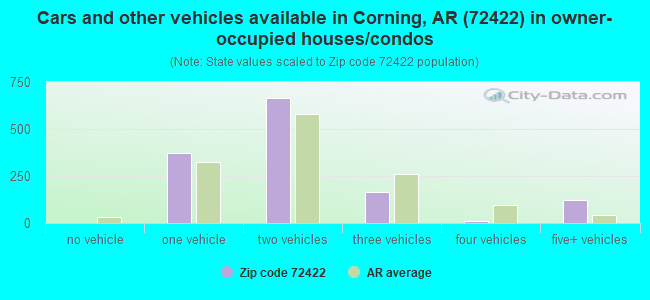
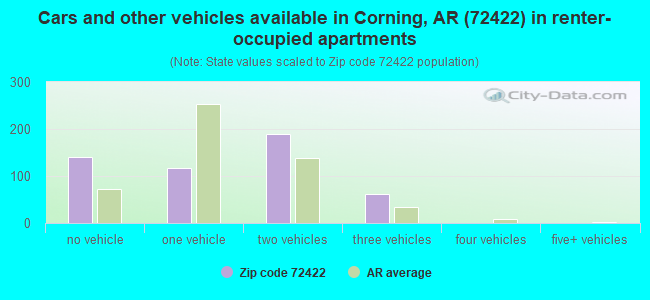
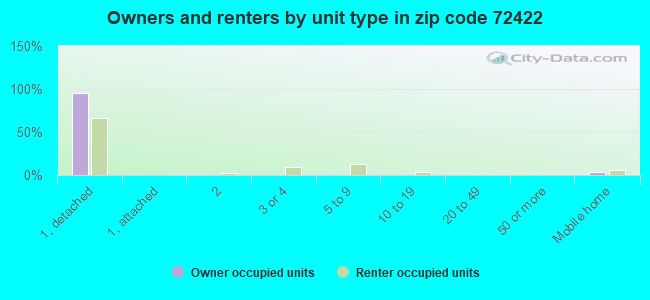
Houses and condos: 2,440 Renter-occupied apartments: 515
% of renters here:
28%
State:
34%
March 2022 cost of living index in zip code 72422: 76.2 (low, U.S. average is 100)
Land area: 175.3 sq. mi. Water area: 0.6 sq. mi.
Population density: 26 people per square mile
(very low).
OSM Map
General Map
Google Map
MSN Map
OSM Map
General Map
Google Map
MSN Map
OSM Map
General Map
Google Map
MSN Map
OSM Map
General Map
Google Map
MSN Map
Please wait while loading the map...
Real estate property taxes paid for housing units in 2022:
This zip code:
0.4% ($420)
Arkansas:
0.5% ($977)
Median real estate property taxes paid for housing units with mortgages in 2022: $431 (0.4%) Median real estate property taxes paid for housing units with no mortgage in 2022: $419 (0.4%)
Business Search- 14 Million verified businesses
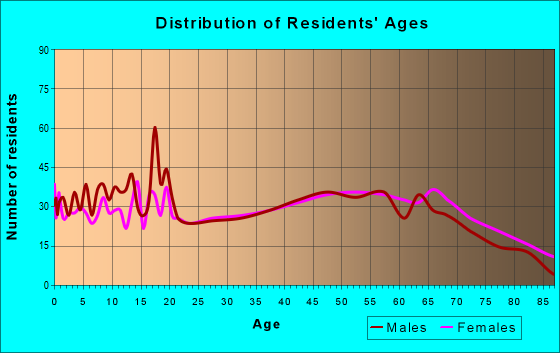
Males: 2,129
(46.2%)
Females: 2,482
(53.8%)
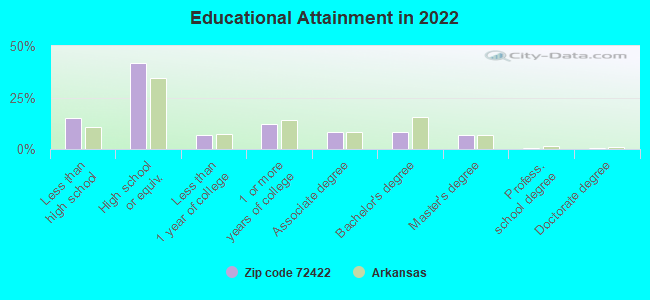
For population 25 years and over in 72422:
High school or higher: 83.9%
Bachelor's degree or higher: 15.5%
Graduate or professional degree: 7.4%
Unemployed: 6.0%
Mean travel time to work (commute): 21.4 minutes
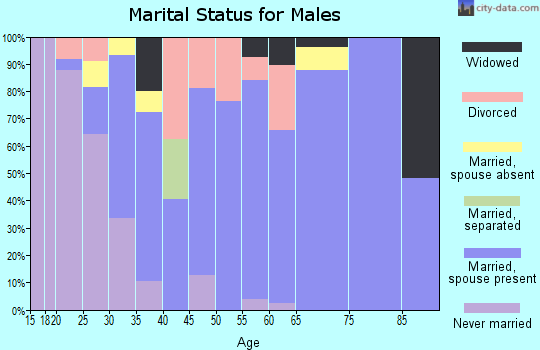
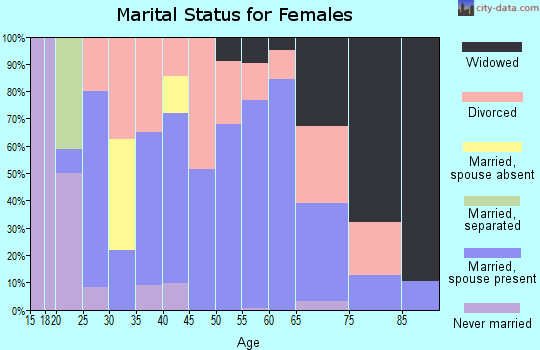
For population 15 years and over in 72422:
Never married: 19.4%
Now married: 54.2%
Separated: 2.6%
Widowed: 10.7%
Divorced: 13.0%
Zip code 72422 compared to state average:
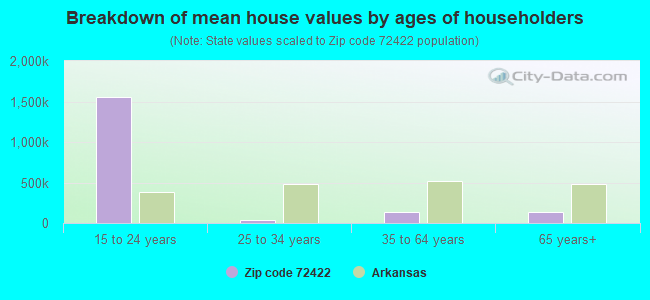
Median house value below state average.
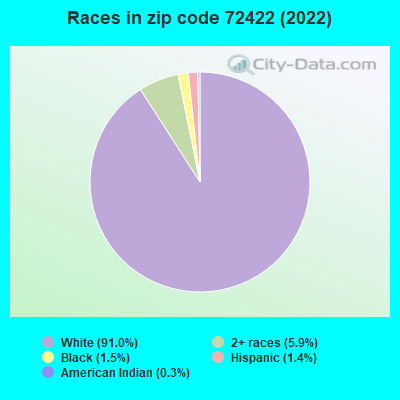
Black race population percentage significantly below state average.
Hispanic race population percentage significantly below state average.
Foreign-born population percentage significantly below state average.
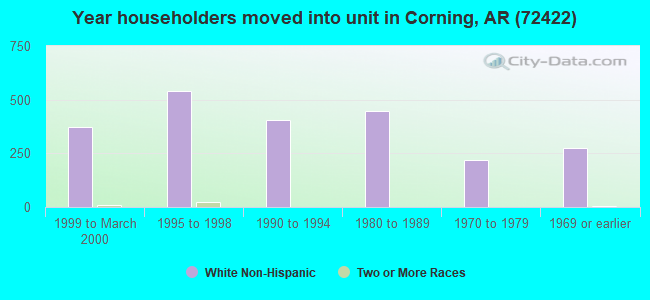
Length of stay since moving in significantly above state average.
Number of college students below state average.
Percentage of population with a bachelor's degree or higher below state average.
Averages for the 2020 tax year for zip code 72422, filed in 2021:
Average Adjusted Gross Income (AGI) in 2020: $44,568 (Individual Income Tax Returns)
Here:
$44,568
State:
$64,872
Salary/wage: $37,156 (reported on 82.8% of returns)
Here:
$37,156
State:
$50,644
(% of AGI for various income ranges: 1107.4% for AGIs below $25k, 3820.8% for AGIs $25k-50k, 6301.1% for AGIs $50k-75k, 9580.0% for AGIs $75k-100k, 21818.3% for AGIs $100k-200k)
Taxable interest for individuals: $1,719 (reported on 27.0% of returns)
This zip code:
$1,719
Arkansas:
$1,857
(% of AGI for various income ranges: 16.3% for AGIs below $25k, 29.5% for AGIs $25k-50k, 57.2% for AGIs $50k-75k, 126.7% for AGIs $75k-100k, 408.3% for AGIs $100k-200k)
Ordinary dividends: $1,900 (reported on 6.3% of returns)
Here:
$1,900
State:
$21,681
(% of AGI for various income ranges: 6.0% for AGIs below $25k, 5.4% for AGIs $25k-50k, 6.7% for AGIs $50k-75k, 238.3% for AGIs $100k-200k)
Net capital gain/loss in AGI: +$4,191 (reported on 6.3% of returns)
Here:
+$4,191
State:
+$22,815
(% of AGI for various income ranges: 14.9% for AGIs $25k-50k, 29.4% for AGIs $50k-75k, 600.0% for AGIs $100k-200k)
Profit/loss from business: +$9,423 (reported on 14.9% of returns)
Here:
+$9,423
State:
+$9,743
(% of AGI for various income ranges: 137.2% for AGIs below $25k, 101.1% for AGIs $25k-50k, 147.8% for AGIs $50k-75k, 517.8% for AGIs $75k-100k, 936.7% for AGIs $100k-200k)
Taxable individual retirement arrangement distribution: $11,600 (reported on 6.3% of returns)
72422:
$11,600
Arkansas:
$18,502
(% of AGI for various income ranges: 33.3% for AGIs below $25k, 51.4% for AGIs $25k-50k, 268.9% for AGIs $50k-75k, 686.7% for AGIs $100k-200k)
Total itemized deductions: $31,550 (reported on 1.1% of returns)
Here:
$31,550
State:
$52,840
(% of AGI for various income ranges: 701.1% for AGIs $75k-100k)
Charity contributions: $13,200 (reported on 1.1% of returns)
Here:
$13,200
State:
$35,735
(% of AGI for various income ranges: 146.7% for AGIs $50k-75k)
Taxes paid: $6,550 (reported on 1.1% of returns)
72422:
$6,550
State:
$7,196
(% of AGI for various income ranges: 145.6% for AGIs $75k-100k)
Earned income credit: $2,326 (reported on 24.7% of returns)
Here:
$2,326
State:
$2,546
(% of AGI for various income ranges: 118.2% for AGIs below $25k, 88.1% for AGIs $25k-50k)
Percentage of individuals using paid preparers for their 2020 taxes: 95.4%
Here:
95%
State:
94%
(% for various income ranges: 94.7% for AGIs below $25k, 97.8% for AGIs $25k-50k, 95.8% for AGIs $50k-75k, 92.9% for AGIs $75k-100k, 92.3% for AGIs $100k-200k, 100.0% for AGIs over 200k)
Averages for the 2012 tax year for zip code 72422, filed in 2013:
Average Adjusted Gross Income (AGI) in 2012: $40,105 (Individual Income Tax Returns)
Here:
$40,105
State:
$52,148
Salary/wage: $30,656 (reported on 84.9% of returns)
Here:
$30,656
State:
$41,669
(% of AGI for various income ranges: 75.6% for AGIs below $25k, 78.2% for AGIs $25k-50k, 73.0% for AGIs $50k-75k, 67.8% for AGIs $75k-100k, 78.8% for AGIs $100k-200k)
Taxable interest for individuals: $1,596 (reported on 29.2% of returns)
This zip code:
$1,596
Arkansas:
$1,648
(% of AGI for various income ranges: 1.4% for AGIs below $25k, 1.4% for AGIs $25k-50k, 0.8% for AGIs $50k-75k, 0.6% for AGIs $75k-100k, 1.0% for AGIs $100k-200k, 1.7% for AGIs over 200k)
Ordinary dividends: $2,057 (reported on 7.6% of returns)
Here:
$2,057
State:
$20,675
(% of AGI for various income ranges: 0.3% for AGIs below $25k, 0.2% for AGIs $25k-50k, 0.3% for AGIs $50k-75k, 1.5% for AGIs $100k-200k)
Net capital gain/loss in AGI: +$6,275 (reported on 6.5% of returns)
Here:
+$6,275
State:
+$15,222
(% of AGI for various income ranges: 0.3% for AGIs below $25k, 0.6% for AGIs $25k-50k, 0.7% for AGIs $50k-75k, 4.6% for AGIs $100k-200k)
Profit/loss from business: +$10,046 (reported on 14.1% of returns)
Here:
+$10,046
State:
+$9,665
(% of AGI for various income ranges: 7.4% for AGIs below $25k, 2.0% for AGIs $25k-50k, 5.0% for AGIs $50k-75k, 6.2% for AGIs $100k-200k)
Taxable individual retirement arrangement distribution: $8,367 (reported on 6.5% of returns)
72422:
$8,367
Arkansas:
$13,644
(% of AGI for various income ranges: 1.2% for AGIs below $25k, 1.7% for AGIs $25k-50k, 1.7% for AGIs $50k-75k, 3.3% for AGIs $75k-100k)
Total itemized deductions: $20,590 (18% of AGI, reported on 11.4% of returns)
Here:
$20,590
State:
$23,276
Here:
18.4% of AGI
State:
19.1% of AGI
(% of AGI for various income ranges: 3.2% for AGIs below $25k, 3.6% for AGIs $25k-50k, 3.7% for AGIs $50k-75k, 7.3% for AGIs $75k-100k, 10.8% for AGIs $100k-200k, 8.8% for AGIs over 200k)
Charity contributions: $5,472 (reported on 9.7% of returns)
Here:
$5,472
State:
$5,996
(% of AGI for various income ranges: 0.9% for AGIs $25k-50k, 0.8% for AGIs $50k-75k, 1.5% for AGIs $75k-100k, 3.2% for AGIs $100k-200k, 2.2% for AGIs over 200k)
Taxes paid: $6,438 (reported on 11.4% of returns)
72422:
$6,438
State:
$7,941
(% of AGI for various income ranges: 0.5% for AGIs $25k-50k, 0.7% for AGIs $50k-75k, 2.0% for AGIs $75k-100k, 4.1% for AGIs $100k-200k, 5.0% for AGIs over 200k)
Earned income credit: $2,412 (reported on 28.1% of returns)
Here:
$2,412
State:
$2,455
(% of AGI for various income ranges: 8.1% for AGIs below $25k, 1.9% for AGIs $25k-50k)
Percentage of individuals using paid preparers for their 2012 taxes: 73.5%
Here:
74%
State:
61%
(% for various income ranges: 69.7% for AGIs below $25k, 77.6% for AGIs $25k-50k, 75.0% for AGIs $50k-75k, 72.7% for AGIs $75k-100k, 77.8% for AGIs $100k-200k, 100.0% for AGIs over 200k)
Averages for the 2004 tax year for zip code 72422, filed in 2005:
Average Adjusted Gross Income (AGI) in 2004: $29,415 (Individual Income Tax Returns)
Here:
$29,415
State:
$39,270
Salary/wage: $24,870 (reported on 84.0% of returns)
Here:
$24,870
State:
$34,079
(% of AGI for various income ranges: 92.4% for AGIs below $10k, 80.6% for AGIs $10k-25k, 79.3% for AGIs $25k-50k, 76.5% for AGIs $50k-75k, 62.4% for AGIs $75k-100k, 37.6% for AGIs over 100k)
Taxable interest for individuals: $2,274 (reported on 34.6% of returns)
This zip code:
$2,274
Arkansas:
$1,904
(% of AGI for various income ranges: 5.4% for AGIs below $10k, 2.2% for AGIs $10k-25k, 2.2% for AGIs $25k-50k, 3.0% for AGIs $50k-75k, 3.1% for AGIs $75k-100k, 3.0% for AGIs over 100k)
Taxable dividends: $1,446 (reported on 10.7% of returns)
Here:
$1,446
State:
$5,995
(% of AGI for various income ranges: 0.4% for AGIs below $10k, 0.2% for AGIs $10k-25k, 0.4% for AGIs $25k-50k, 0.8% for AGIs $50k-75k, 0.0% for AGIs $75k-100k, 1.0% for AGIs over 100k)
Net capital gain/loss: +$2,583 (reported on 8.2% of returns)
Here:
+$2,583
State:
+$10,430
(% of AGI for various income ranges: 0.2% for AGIs below $10k, -0.1% for AGIs $10k-25k, 0.6% for AGIs $25k-50k, 0.6% for AGIs $50k-75k, 2.3% for AGIs over 100k)
Profit/loss from business: +$5,292 (reported on 15.6% of returns)
Here:
+$5,292
State:
+$7,823
(% of AGI for various income ranges: 3.8% for AGIs below $10k, 4.5% for AGIs $10k-25k, 1.7% for AGIs $25k-50k, 3.6% for AGIs $50k-75k, 2.9% for AGIs over 100k)
Profit/loss from farming: +$8,062 (reported on 4.9% of returns)
Here:
+$8,062
State:
-$5,941
(% of AGI for various income ranges: -8.3% for AGIs below $10k, 1.2% for AGIs $10k-25k, 1.4% for AGIs $25k-50k, 0.4% for AGIs $50k-75k, 12.4% for AGIs $75k-100k)
IRA payment deduction: $3,531 (reported on 1.6% of returns)
72422:
$3,531
Arkansas:
$3,204
Total itemized deductions: $18,444 (24% of AGI, reported on 10.8% of returns)
Here:
$18,444
State:
$18,389
Here:
23.8% of AGI
State:
21.0% of AGI
(% of AGI for various income ranges: 3.7% for AGIs $10k-25k, 4.9% for AGIs $25k-50k, 7.0% for AGIs $50k-75k, 9.2% for AGIs $75k-100k, 13.7% for AGIs over 100k)
Charity contributions deductions: $4,382 (5% of AGI, reported on 9.6% of returns)
Here:
$4,382
State:
$4,725
Here:
5.3% of AGI
State:
5.1% of AGI
(% of AGI for various income ranges: 0.7% for AGIs $10k-25k, 0.9% for AGIs $25k-50k, 1.3% for AGIs $50k-75k, 2.0% for AGIs $75k-100k, 3.3% for AGIs over 100k)
Total tax: $3,964 (reported on 66.0% of returns)
72422:
$3,964
State:
$6,047
(% of AGI for various income ranges: 2.5% for AGIs below $10k, 3.9% for AGIs $10k-25k, 5.8% for AGIs $25k-50k, 8.8% for AGIs $50k-75k, 12.5% for AGIs $75k-100k, 20.1% for AGIs over 100k)
Earned income credit: $1,764 (reported on 28.9% of returns)
Here:
$1,764
State:
$1,909
Percentage of individuals using paid preparers for their 2004 taxes: 71.2%
Here:
71%
State:
67%
(% for various income ranges: 66.9% for AGIs below $10k, 69.9% for AGIs $10k-25k, 73.4% for AGIs $25k-50k, 72.9% for AGIs $50k-75k, 74.5% for AGIs $75k-100k, 92.7% for AGIs over 100k)
Household received Food Stamps/SNAP in the past 12 months: 265 Household did not receive Food Stamps/SNAP in the past 12 months: 1,572
Women who had a birth in the past 12 months: 66 (27 now married, 37 unmarried) Women who did not have a birth in the past 12 months: 965 (482 now married, 483 unmarried)
Housing units in zip code 72422 with a mortgage: 436 Median monthly owner costs for units with a mortgage: $860 Median monthly owner costs for units without a mortgage: $341
Residents with income below the poverty level in 2022:
This zip code:
19.2%
Whole state:
16.8%
Residents with income below 50% of the poverty level in 2022:
This zip code:
7.5%
Whole state:
8.5%
Median number of rooms in houses and condos:
Here:
5.5
State:
6.1
Median number of rooms in apartments:
Here:
4.6
State:
4.3
Notable locations in this zip code not listed on our city pages
Notable locations in zip code 72422: Moark Landing (A), Corning National Fish Hatchery (B), Corning Library (C), Corning City Hall (D), Clay County Courthouse (E), Corning Volunteer Fire Department (F), Clay County Sheriff Department (G), Corning Police Department (H), McDougal Volunteer Fire Station (I). Display/hide their locations on the map
Churches in zip code 72422 include: White Valley Church (A), Big T Church (B), Brazil Church (C), French Grove Church (D), Happy Home Church (E), Independent Church (F), Shiloh Church (G), Landmark Church (H), Grassylead Church (I). Display/hide their locations on the map
Cemeteries: Richwoods Cemetery (1), Rogers Cemetery (2), Moark Cemetery (3), Williams Cemetery (4), Masterson Cemetery (5), Cantwell Cemetery (6), Green Cemetery (7). Display/hide their locations on the map
Lakes and reservoirs: Lost Lake (A), Murphy Lake (B), Corning Lake (C), Little Taylor Lake (D), Long Lake (E), Taylor Lake (F), Victory Lake (G), Old River Lake (H). Display/hide their locations on the map
In group quarters: 9 (-1 institutionalized population)
Size of family households: 516 2-persons, 318 3-persons, 240 4-persons, 54 5-persons, 13 6-persons, 35 7-or-more-persons
Size of nonfamily households: 563 1-person, 80 2-persons, 15 5-persons
466 married couples with children.
286 single-parent households (175 men, 111 women).
98.3% of residents of 72422 zip code speak English at home.
2.1% of residents speak Spanish at home (100% very well).
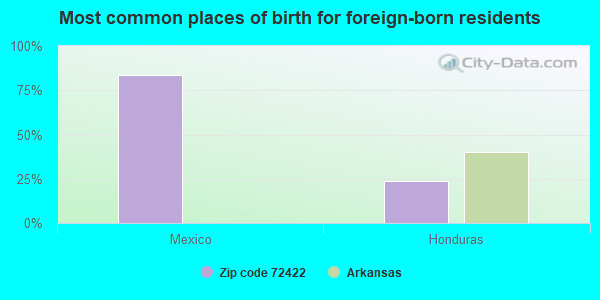
Foreign born population: 68 (1.5%) (74.9% of them are naturalized citizens)
This zip code:
1.5%
Whole state:
5.1%
84%Mexico
24%Honduras
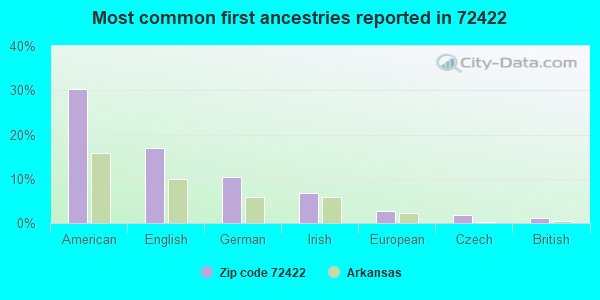
30%American
17%English
10%German
7%Irish
3%European
2%Czech
1%British
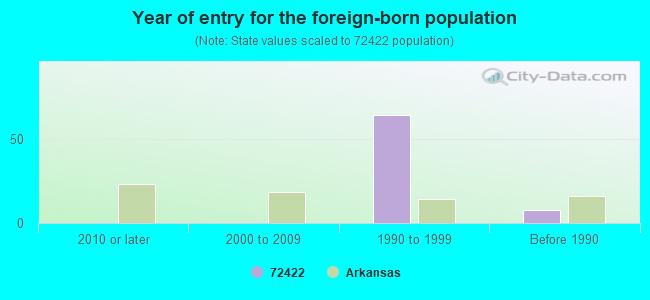
Year of entry for the foreign-born population
02010 or later
02000 to 2009
641990 to 1999
8Before 1990
Facilities with environmental interests located in this zip code:
HARTS OF ARKANSAS (104 LEE STREET in CORNING, AR)
AIR SYNTHETIC MINOR (AIRS/AFS) CRITERIA AND HAZARDOUS AIR POLLUTANT INVENTORY (Inventory of air pollution sources) STATE MASTER (PDS) - AIR-0460-A, AIR PROGRAM, AIR-0460-AR-1, AIR-0460-AR-2, AIR MINOR, AIR-0460-AR-3, AIR-0460-AR-4, AIR-0460-AR-5, RST-11000037, FACILITY, WATER-AR0042595, National Pollutant Discharge Elimination System Permit HAZARDOUS WASTE BIENNIAL REPORTER (Resource Conservation and Recovery Act (tracking hazardous waste)) Small Quantity Generators, between 100 kg and 1000 kg of hazardous waste/month (Resource Conservation and Recovery Act (tracking hazardous waste)) - notification Business SIC classification: WOOD HOUSEHOLD FURNITURE, EXCEPT UPHOLSTERED Business NAICS classification: NONUPHOLSTERED WOOD HOUSEHOLD FURNITURE MANUFACTURING. Organizations: HART FURNITURE MFG. CO. (CONTACT/GENERAL)
, HARTS MFG (CONTACT/OPERATOR)
Alternative names: HART MANUFACTURING, HARTS MANUFACTURING
CENTRAL ELEMENTARY SCHOOL (605 W. FOURTH ST. in CORNING, AR)
(Geographic Names Information System) (National Center for Education Statistics) - STATE ID-1101005 Organizations: CORNING (SCHOOL DISTRICT)
CLAY COUNTY ELECTRIC COOPERATIVE CORP (300 N MISSOURI in CORNING, AR)
(Integrated Compliance Information System) - ICIS-06-2000-1182, FORMAL ENFORCEMENT ACTION COMPLIANCE ACTIVITY (Tracking inspections of insecticide, fungicide, and rodenticide, and toxic substances) Business SIC classification: ELECTRIC SERVICES; ELECTRIC AND OTHER SERVICES COMBINED
STATE MASTER (PDS) - WATER-ARR00B065, NPDES STORMWATER PERMIT Conditionally Exempt Small Quantity Generators, less than 100 kg/month of hazardous waste (Resource Conservation and Recovery Act (tracking hazardous waste)) - notification Alternative names: JOHANSEN BROTHERS SHOES
FLASH MARKET #175 (105 N. MISSOURI STREET in CORNING, AR)
(Integrated Compliance Information System) - ICIS-06-2003-5108, FORMAL ENFORCEMENT ACTION Business SIC classification: GASOLINE SERVICE STATIONS
AHTD-BRDG 3023 HWY 62 & BLACK (HWY 62 & BLACK RIVER in CORNING, AR) . Federal Facility. DEPARTMENT OF TRANSPORTATION
(Resource Conservation and Recovery Act (tracking hazardous waste)) Organizations: ARK HWY & TRANS DEPT (CONTACT/OWNER)
Alternative names: AHTD-HWY 62 & BLACK BRDG 3023
J. W. BLACK LUMBER COMPANY (EAST 1ST ST; HWY 62 in CORNING, AR)
National Pollutant Discharge Elimination System NON-MAJOR (Tracking pollutant discharge elimination systems) - permit Business SIC classification: SAWMILLS AND PLANING MILLS, GENERAL
BASLER ELECTRIC CO (HWY 67 & CREASON RD in CORNING, AR)
Conditionally Exempt Small Quantity Generators, less than 100 kg/month of hazardous waste (Resource Conservation and Recovery Act (tracking hazardous waste)) - notification Organizations: BASLER WILLIAM L (CONTACT/OWNER)
SOLLIS GRAIN BINS (908 N MISSOURI AVE in CORNING, AR)
COMPLIANCE ACTIVITY (Tracking inspections of insecticide, fungicide, and rodenticide, and toxic substances) Business SIC classification: LUMBER AND OTHER BUILDING MATERIALS DEALERS
Housing units lacking complete plumbing facilities: 12.6% Housing units lacking complete kitchen facilities: 4.9%
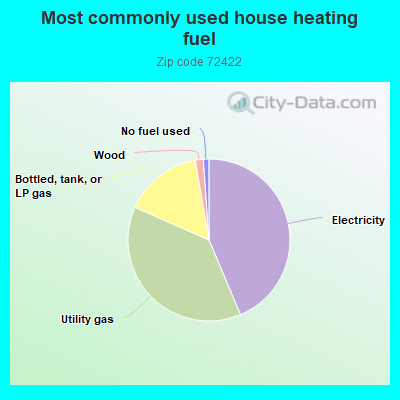
43.7%Electricity
38.0%Utility gas
15.7%Bottled, tank, or LP gas
1.6%Wood
1.1%No fuel used
Population in 1990: 5,469. Population change in the 1990s: +144 (+2.6%).
Place of birth for U.S.-born residents:
This state: 2,460
Northeast: 14
Midwest: 1,613
South: 327
West: 106
61% of the 72422 zip code residents lived in the same house 5 years ago. Out of people who lived in different houses, 65% lived in this county. Out of people who lived in different counties, 50% lived in Arkansas.
89% of the 72422 zip code residents lived in the same house 1 year ago. Out of people who lived in different houses, 45% moved from this county. Out of people who lived in different houses, 21% moved from different county within same state. Out of people who lived in different houses, 33% moved from different state. Out of people who lived in different houses, 2% moved from abroad.
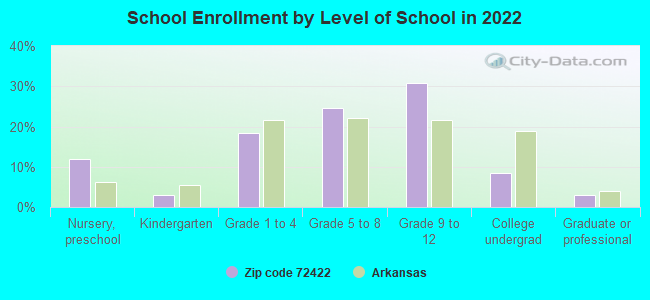
Private vs. public school enrollment:
Students in private schools in grades 1 to 8 (elementary and middle school): 17
Here:
4.3%
Arkansas:
10.5%
Students in private schools in grades 9 to 12 (high school): 96
Here:
32.9%
Arkansas:
8.7%
Students in private undergraduate colleges:
Here:
0.0%
Arkansas:
19.4%
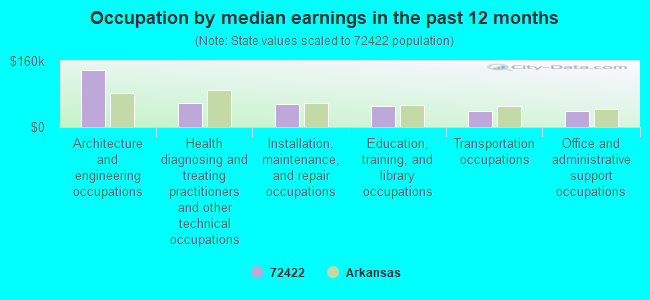
Occupation by median earnings in the past 12 months ($)
137,662Architecture and engineering occupations
57,496Health diagnosing and treating practitioners and other technical occupations
55,104Installation, maintenance, and repair occupations
51,512Education, training, and library occupations
38,859Transportation occupations
38,577Office and administrative support occupations
Top industries in this zip code by the number of employees in 2005:
Health Care and Social Assistance: Nursing Care Facilities (50-99: 1)
Utilities: Electric Power Distribution (50-99: 1)
Finance and Insurance: Commercial Banking (20-49: 1, 1-4: 1)
People in group quarters in 2000:
73 people in nursing homes
Fatal accident statistics in 2014:
Fatal accident count: 2
Vehicles involved in fatal accidents: 3
Fatal accidents caused by drunken drivers: 0
Fatalities: 2
Persons involved in fatal accidents: 3
Pedestrians involved in fatal accidents: 1
Fatal accident statistics in 2012:
Fatal accident count: 1
Vehicles involved in fatal accidents: 1
Fatal accidents caused by drunken drivers: 1
Fatalities: 1
Persons involved in fatal accidents: 3
Pedestrians involved in fatal accidents: 0
2004 - 2018 National Fire Incident Reporting System (NFIRS) incidents
According to the data from the years 2004 - 2018 the average number of fire incidents per year is 22. The highest number of reported fire incidents - 36 took place in 2007, and the least - 0 in 2006. The data has a growing trend.
When looking into fire subcategories, the most incidents belonged to: Structure Fires (44.3%), and Outside Fires (41.2%).
Fire incident types reported to NFIRS in Zip Code 72422


+$8,062
-$5,941
(% of AGI for various income ranges: -8.3% for AGIs below $10k, 1.2% for AGIs $10k-25k, 1.4% for AGIs $25k-50k, 0.4% for AGIs $50k-75k, 12.4% for AGIs $75k-100k) Nearest zip codes: 72435, 72441, 63954, 72470, 72456, 72436.
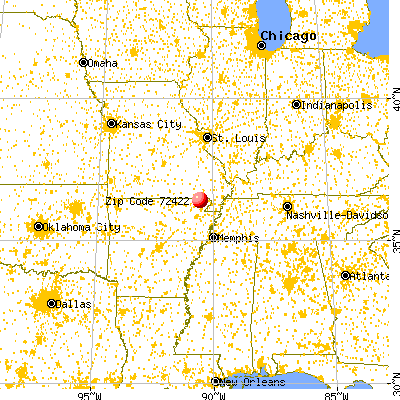


 According to the data from the years 2004 - 2018 the average number of fire incidents per year is 22. The highest number of reported fire incidents - 36 took place in 2007, and the least - 0 in 2006. The data has a growing trend.
 When looking into fire subcategories, the most incidents belonged to: Structure Fires (44.3%), and Outside Fires (41.2%).