Estimated zip code population in 2022: 20,566 Zip code population in 2010: 17,563 Zip code population in 2000: 12,039
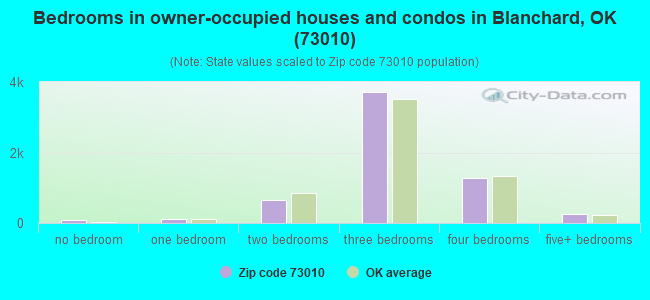
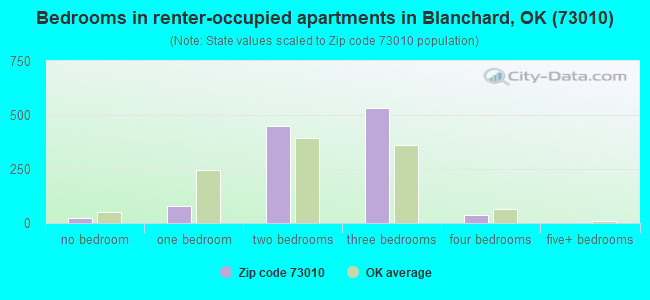
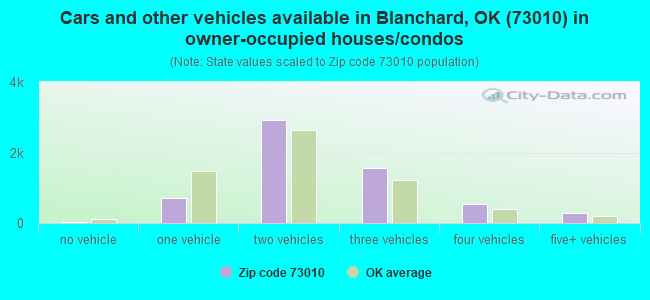
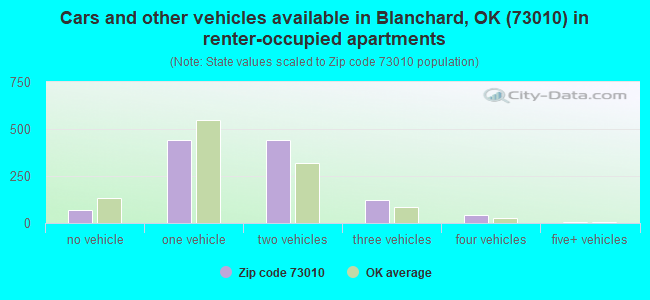
Houses and condos: 7,445 Renter-occupied apartments: 1,128
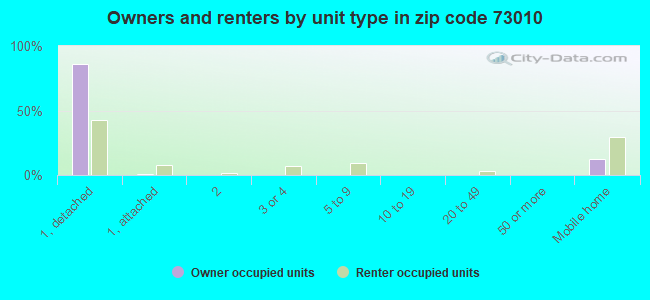
% of renters here:
16%
State:
35%
March 2022 cost of living index in zip code 73010: 80.4 (low, U.S. average is 100)
Land area: 180.9 sq. mi. Water area: 1.1 sq. mi.
Population density: 114 people per square mile
(very low).
OSM Map
General Map
Google Map
MSN Map
OSM Map
General Map
Google Map
MSN Map
OSM Map
General Map
Google Map
MSN Map
OSM Map
General Map
Google Map
MSN Map
Please wait while loading the map...
Real estate property taxes paid for housing units in 2022:
This zip code:
0.8% ($2,071)
Oklahoma:
0.8% ($1,501)
Median real estate property taxes paid for housing units with mortgages in 2022: $2,414 (0.9%) Median real estate property taxes paid for housing units with no mortgage in 2022: $1,363 (0.6%)
Business Search- 14 Million verified businesses
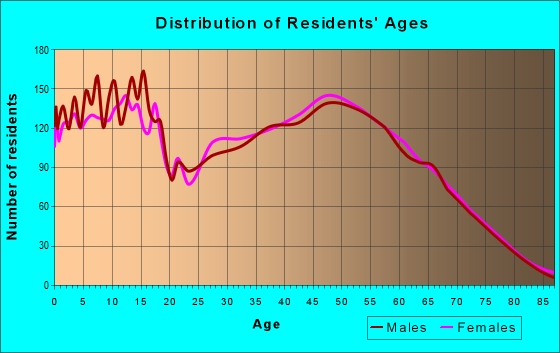
Males: 10,249
(49.8%)
Females: 10,316
(50.2%)
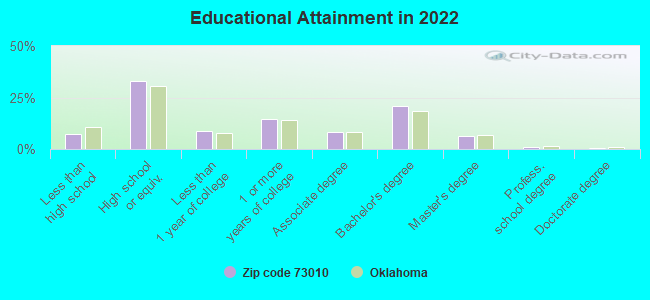
For population 25 years and over in 73010:
High school or higher: 92.7%
Bachelor's degree or higher: 28.4%
Graduate or professional degree: 7.6%
Unemployed: 5.1%
Mean travel time to work (commute): 30.1 minutes
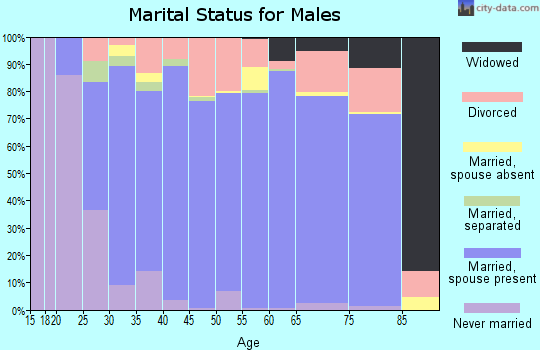
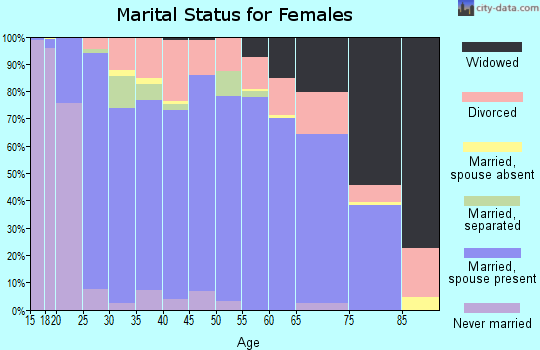
For population 15 years and over in 73010:
Never married: 22.1%
Now married: 63.7%
Separated: 1.3%
Widowed: 4.3%
Divorced: 8.5%
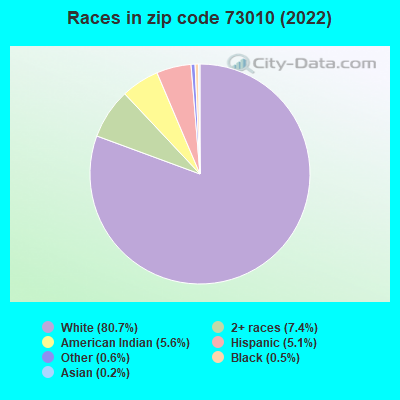
Zip code 73010 compared to state average:
Black race population percentage significantly below state average.
Hispanic race population percentage below state average.
Foreign-born population percentage significantly below state average.
Renting percentage below state average.
Length of stay since moving in significantly above state average.
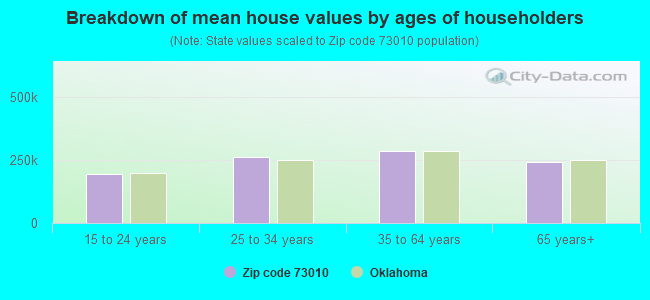
Estimated median house/condo value in 2022: $251,740
73010:
$251,740
Oklahoma:
$191,700
According to our research of Oklahoma and other state lists, there were 42 registered sex offenders living in 73010 zip code as of April 27, 2024. The ratio of all residents to sex offenders in zip code 73010 is 460 to 1. The ratio of registered sex offenders to all residents in this zip code is near the state average.
Median resident age:
This zip code:
38.2 years
Oklahoma median age:
37.1 years
Average household size:
This zip code:
2.8 people
Oklahoma:
2.5 people
Averages for the 2020 tax year for zip code 73010, filed in 2021:
Average Adjusted Gross Income (AGI) in 2020: $70,012 (Individual Income Tax Returns)
Here:
$70,012
State:
$63,060
Salary/wage: $61,727 (reported on 82.8% of returns)
Here:
$61,727
State:
$52,427
(% of AGI for various income ranges: 1103.7% for AGIs below $25k, 3450.5% for AGIs $25k-50k, 6066.2% for AGIs $50k-75k, 9186.2% for AGIs $75k-100k, 17589.3% for AGIs $100k-200k, 50122.3% for AGIs over 200k)
Taxable interest for individuals: $1,078 (reported on 33.6% of returns)
This zip code:
$1,078
Oklahoma:
$1,603
(% of AGI for various income ranges: 15.4% for AGIs below $25k, 16.6% for AGIs $25k-50k, 34.6% for AGIs $50k-75k, 44.6% for AGIs $75k-100k, 64.8% for AGIs $100k-200k, 1021.5% for AGIs over 200k)
Ordinary dividends: $3,215 (reported on 12.0% of returns)
Here:
$3,215
State:
$7,001
(% of AGI for various income ranges: 8.0% for AGIs below $25k, 16.0% for AGIs $25k-50k, 38.5% for AGIs $50k-75k, 36.3% for AGIs $75k-100k, 94.9% for AGIs $100k-200k, 1090.8% for AGIs over 200k)
Net capital gain/loss in AGI: +$13,375 (reported on 11.7% of returns)
Here:
+$13,375
State:
+$19,855
(% of AGI for various income ranges: 11.3% for AGIs below $25k, 12.0% for AGIs $25k-50k, 89.6% for AGIs $50k-75k, 87.9% for AGIs $75k-100k, 361.8% for AGIs $100k-200k, 6463.1% for AGIs over 200k)
Profit/loss from business: +$8,451 (reported on 18.6% of returns)
Here:
+$8,451
State:
+$9,904
(% of AGI for various income ranges: 139.1% for AGIs below $25k, 169.0% for AGIs $25k-50k, 218.7% for AGIs $50k-75k, 118.8% for AGIs $75k-100k, 289.6% for AGIs $100k-200k, 1944.6% for AGIs over 200k)
Taxable individual retirement arrangement distribution: $20,096 (reported on 7.4% of returns)
73010:
$20,096
Oklahoma:
$20,476
(% of AGI for various income ranges: 50.0% for AGIs below $25k, 85.7% for AGIs $25k-50k, 144.1% for AGIs $50k-75k, 249.9% for AGIs $75k-100k, 474.7% for AGIs $100k-200k, 2106.2% for AGIs over 200k)
Total itemized deductions: $35,634 (reported on 7.8% of returns)
Here:
$35,634
State:
$39,736
(% of AGI for various income ranges: 43.1% for AGIs below $25k, 86.3% for AGIs $25k-50k, 227.3% for AGIs $50k-75k, 335.8% for AGIs $75k-100k, 860.3% for AGIs $100k-200k, 6799.2% for AGIs over 200k)
Charity contributions: $10,065 (reported on 6.0% of returns)
Here:
$10,065
State:
$17,288
(% of AGI for various income ranges: 18.2% for AGIs $25k-50k, 32.2% for AGIs $50k-75k, 73.8% for AGIs $75k-100k, 201.9% for AGIs $100k-200k, 1666.9% for AGIs over 200k)
Taxes paid: $7,106 (reported on 7.6% of returns)
73010:
$7,106
State:
$7,046
(% of AGI for various income ranges: 3.9% for AGIs below $25k, 13.4% for AGIs $25k-50k, 38.7% for AGIs $50k-75k, 70.8% for AGIs $75k-100k, 214.7% for AGIs $100k-200k, 1041.5% for AGIs over 200k)
Earned income credit: $2,371 (reported on 14.6% of returns)
Here:
$2,371
State:
$2,435
(% of AGI for various income ranges: 94.1% for AGIs below $25k, 76.5% for AGIs $25k-50k, 2.7% for AGIs $50k-75k)
Percentage of individuals using paid preparers for their 2020 taxes: 94.3%
Here:
94%
State:
94%
(% for various income ranges: 93.0% for AGIs below $25k, 94.0% for AGIs $25k-50k, 94.2% for AGIs $50k-75k, 95.2% for AGIs $75k-100k, 95.5% for AGIs $100k-200k, 97.3% for AGIs over 200k)
Averages for the 2012 tax year for zip code 73010, filed in 2013:
Average Adjusted Gross Income (AGI) in 2012: $59,443 (Individual Income Tax Returns)
Here:
$59,443
State:
$58,581
Salary/wage: $52,484 (reported on 85.3% of returns)
Here:
$52,484
State:
$45,973
(% of AGI for various income ranges: 74.3% for AGIs below $25k, 81.1% for AGIs $25k-50k, 79.0% for AGIs $50k-75k, 80.4% for AGIs $75k-100k, 79.3% for AGIs $100k-200k, 53.9% for AGIs over 200k)
Taxable interest for individuals: $876 (reported on 32.7% of returns)
This zip code:
$876
Oklahoma:
$1,625
(% of AGI for various income ranges: 0.8% for AGIs below $25k, 0.4% for AGIs $25k-50k, 0.6% for AGIs $50k-75k, 0.4% for AGIs $75k-100k, 0.3% for AGIs $100k-200k, 0.7% for AGIs over 200k)
Ordinary dividends: $1,974 (reported on 11.7% of returns)
Here:
$1,974
State:
$6,374
(% of AGI for various income ranges: 0.4% for AGIs below $25k, 0.3% for AGIs $25k-50k, 0.3% for AGIs $50k-75k, 0.3% for AGIs $75k-100k, 0.3% for AGIs $100k-200k, 0.8% for AGIs over 200k)
Net capital gain/loss in AGI: +$9,068 (reported on 9.9% of returns)
Here:
+$9,068
State:
+$24,023
(% of AGI for various income ranges: 0.6% for AGIs below $25k, 0.6% for AGIs $25k-50k, 0.7% for AGIs $50k-75k, 0.7% for AGIs $75k-100k, 1.0% for AGIs $100k-200k, 5.5% for AGIs over 200k)
Profit/loss from business: +$11,360 (reported on 17.6% of returns)
Here:
+$11,360
State:
+$11,913
(% of AGI for various income ranges: 8.3% for AGIs below $25k, 3.9% for AGIs $25k-50k, 2.2% for AGIs $50k-75k, 1.9% for AGIs $75k-100k, 3.3% for AGIs $100k-200k, 3.5% for AGIs over 200k)
Taxable individual retirement arrangement distribution: $12,556 (reported on 7.4% of returns)
73010:
$12,556
Oklahoma:
$15,242
(% of AGI for various income ranges: 2.3% for AGIs below $25k, 1.5% for AGIs $25k-50k, 1.0% for AGIs $50k-75k, 2.0% for AGIs $75k-100k, 2.0% for AGIs $100k-200k, 0.6% for AGIs over 200k)
Total itemized deductions: $21,709 (20% of AGI, reported on 32.3% of returns)
Here:
$21,709
State:
$24,882
Here:
20.2% of AGI
State:
18.8% of AGI
(% of AGI for various income ranges: 7.5% for AGIs below $25k, 8.7% for AGIs $25k-50k, 10.5% for AGIs $50k-75k, 11.6% for AGIs $75k-100k, 13.9% for AGIs $100k-200k, 14.1% for AGIs over 200k)
Charity contributions: $4,277 (reported on 24.7% of returns)
Here:
$4,277
State:
$6,591
(% of AGI for various income ranges: 0.9% for AGIs below $25k, 1.0% for AGIs $25k-50k, 1.6% for AGIs $50k-75k, 1.7% for AGIs $75k-100k, 2.2% for AGIs $100k-200k, 2.3% for AGIs over 200k)
Taxes paid: $6,174 (reported on 32.1% of returns)
73010:
$6,174
State:
$7,196
(% of AGI for various income ranges: 1.0% for AGIs below $25k, 1.5% for AGIs $25k-50k, 2.4% for AGIs $50k-75k, 3.3% for AGIs $75k-100k, 4.6% for AGIs $100k-200k, 4.8% for AGIs over 200k)
Earned income credit: $2,262 (reported on 17.2% of returns)
Here:
$2,262
State:
$2,354
(% of AGI for various income ranges: 6.7% for AGIs below $25k, 1.3% for AGIs $25k-50k)
Percentage of individuals using paid preparers for their 2012 taxes: 57.3%
Here:
57%
State:
56%
(% for various income ranges: 51.0% for AGIs below $25k, 55.3% for AGIs $25k-50k, 60.3% for AGIs $50k-75k, 59.3% for AGIs $75k-100k, 66.7% for AGIs $100k-200k, 78.9% for AGIs over 200k)
Averages for the 2004 tax year for zip code 73010, filed in 2005:
Average Adjusted Gross Income (AGI) in 2004: $42,405 (Individual Income Tax Returns)
Here:
$42,405
State:
$41,245
Salary/wage: $40,083 (reported on 86.1% of returns)
Here:
$40,083
State:
$35,318
(% of AGI for various income ranges: 115.6% for AGIs below $10k, 76.6% for AGIs $10k-25k, 82.9% for AGIs $25k-50k, 86.2% for AGIs $50k-75k, 86.2% for AGIs $75k-100k, 70.6% for AGIs over 100k)
Taxable interest for individuals: $1,137 (reported on 37.8% of returns)
This zip code:
$1,137
Oklahoma:
$1,745
(% of AGI for various income ranges: 3.8% for AGIs below $10k, 1.5% for AGIs $10k-25k, 1.0% for AGIs $25k-50k, 0.6% for AGIs $50k-75k, 0.3% for AGIs $75k-100k, 1.7% for AGIs over 100k)
Taxable dividends: $969 (reported on 13.7% of returns)
Here:
$969
State:
$2,920
(% of AGI for various income ranges: 1.9% for AGIs below $10k, 0.4% for AGIs $10k-25k, 0.3% for AGIs $25k-50k, 0.2% for AGIs $50k-75k, 0.2% for AGIs $75k-100k, 0.4% for AGIs over 100k)
Net capital gain/loss: +$7,047 (reported on 11.8% of returns)
Here:
+$7,047
State:
+$10,653
(% of AGI for various income ranges: -0.2% for AGIs below $10k, 1.0% for AGIs $10k-25k, 0.5% for AGIs $25k-50k, 0.2% for AGIs $50k-75k, 0.9% for AGIs $75k-100k, 6.6% for AGIs over 100k)
Profit/loss from business: +$6,921 (reported on 21.0% of returns)
Here:
+$6,921
State:
+$8,532
(% of AGI for various income ranges: 7.7% for AGIs below $10k, 7.7% for AGIs $10k-25k, 3.6% for AGIs $25k-50k, 2.2% for AGIs $50k-75k, 2.8% for AGIs $75k-100k, 3.1% for AGIs over 100k)
IRA payment deduction: $3,034 (reported on 1.9% of returns)
73010:
$3,034
Oklahoma:
$3,127
(% of AGI for various income ranges: 0.1% for AGIs $25k-50k, 0.2% for AGIs $50k-75k, 0.2% for AGIs $75k-100k, 0.1% for AGIs over 100k)
Self-employed pension: $13,571 (reported on 0.2% of returns)
Here:
$13,571
Oklahoma:
$14,276
Total itemized deductions: $15,523 (22% of AGI, reported on 38.5% of returns)
Here:
$15,523
State:
$17,093
Here:
21.8% of AGI
State:
20.5% of AGI
(% of AGI for various income ranges: 14.2% for AGIs below $10k, 8.5% for AGIs $10k-25k, 12.1% for AGIs $25k-50k, 15.5% for AGIs $50k-75k, 15.6% for AGIs $75k-100k, 15.5% for AGIs over 100k)
Charity contributions deductions: $2,862 (4% of AGI, reported on 31.5% of returns)
Here:
$2,862
State:
$4,240
Here:
3.8% of AGI
State:
4.8% of AGI
(% of AGI for various income ranges: 1.1% for AGIs below $10k, 1.0% for AGIs $10k-25k, 1.5% for AGIs $25k-50k, 2.3% for AGIs $50k-75k, 2.6% for AGIs $75k-100k, 2.7% for AGIs over 100k)
Total tax: $5,387 (reported on 75.0% of returns)
73010:
$5,387
State:
$6,542
(% of AGI for various income ranges: 4.1% for AGIs below $10k, 4.2% for AGIs $10k-25k, 5.8% for AGIs $25k-50k, 7.9% for AGIs $50k-75k, 10.2% for AGIs $75k-100k, 16.9% for AGIs over 100k)
Earned income credit: $1,818 (reported on 17.1% of returns)
Here:
$1,818
State:
$1,830
Percentage of individuals using paid preparers for their 2004 taxes: 62.2%
Here:
62%
State:
63%
(% for various income ranges: 54.6% for AGIs below $10k, 62.5% for AGIs $10k-25k, 63.1% for AGIs $25k-50k, 65.6% for AGIs $50k-75k, 63.8% for AGIs $75k-100k, 67.9% for AGIs over 100k)
Likely homosexual households (counted as self-reported same-sex unmarried-partner households)
Lesbian couples: 0.0% of all households
Gay men: 0.0% of all households
Household received Food Stamps/SNAP in the past 12 months: 438 Household did not receive Food Stamps/SNAP in the past 12 months: 6,695
Women who had a birth in the past 12 months: 129 (124 now married, 7 unmarried) Women who did not have a birth in the past 12 months: 4,784 (2,814 now married, 1,970 unmarried)
Housing units in zip code 73010 with a mortgage: 3,940 (134 second mortgage, 77 both second mortgage and home equity loan) Houses without a mortgage: 94
Median monthly owner costs for units with a mortgage: $1,677 Median monthly owner costs for units without a mortgage: $529
Residents with income below the poverty level in 2022:
This zip code:
7.0%
Whole state:
15.7%
Residents with income below 50% of the poverty level in 2022:
This zip code:
3.8%
Whole state:
8.3%
Median number of rooms in houses and condos:
Here:
6.2
State:
6.1
Median number of rooms in apartments:
Here:
4.8
State:
4.5
Notable locations in this zip code not listed on our city pages
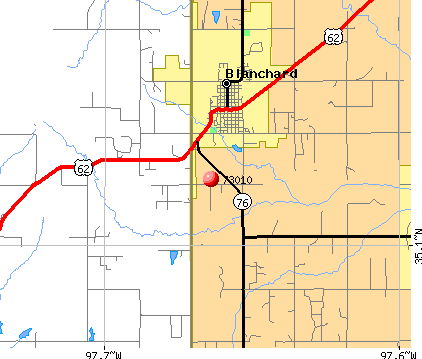
Notable locations in zip code 73010: McClain Grady County Emergency Medical Services District 1 (A), Grady County Fire Department Naples Station (B), Bridge Creek Fire Department (C), Dibble Volunteer Fire Department (D), Blanchard Fire Department (E). Display/hide their locations on the map
Churches in zip code 73010 include: Baptist Church (A), Central Church (B), Pleasant Hill Baptist Church (C), First United Methodist Church (D), First Pentecostal Church (E), First Baptist Church (F), First Assembly of God Church (G), Church of Christ (H), Christ Chapel Freewill Baptist Church (I). Display/hide their locations on the map
Reservoirs: Oknoname 051028 Reservoir (A), Oknoname 051016 Reservoir (B), Winter Creek Site 1a Reservoir (C), Winter Creek Site 1b Reservoir (D), Winter Creek Site 1 Reservoir (E), Winter Creek Site 2 Reservoir (F), Winter Creek Site 3 Reservoir (G), Winter Creek Site 4 Reservoir (H). Display/hide their locations on the map
Creeks: Buffalo Creek (A), West Winter Creek (B), Bridge Creek (C), Stinson Creek (D), North Fork Walnut Creek (E), East Winter Creek (F). Display/hide their locations on the map
In group quarters: 41 (-1 institutionalized population)
Size of family households: 2,629 2-persons, 1,383 3-persons, 997 4-persons, 615 5-persons, 154 6-persons, 107 7-or-more-persons
Size of nonfamily households: 1,073 1-person, 259 2-persons, 4 4-persons
3,593 married couples with children.
773 single-parent households (360 men, 413 women).
97.9% of residents of 73010 zip code speak English at home.
1.8% of residents speak Spanish at home (82% very well, 2% well, 13% not well, 3% not at all).
0.1% of residents speak other Indo-European language at home (100% very well).
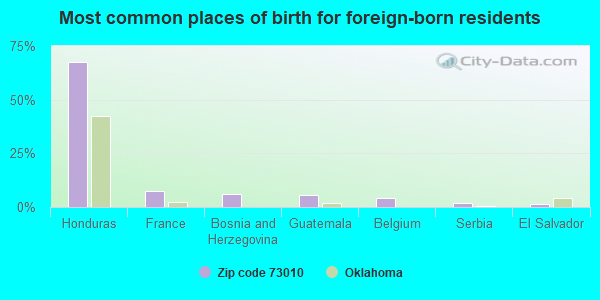
Foreign born population: 211 (1.0%) (52.5% of them are naturalized citizens)
This zip code:
1.0%
Whole state:
6.0%
68%Honduras
8%France
6%Bosnia and Herzegovina
6%Guatemala
4%Belgium
2%Serbia
1%El Salvador
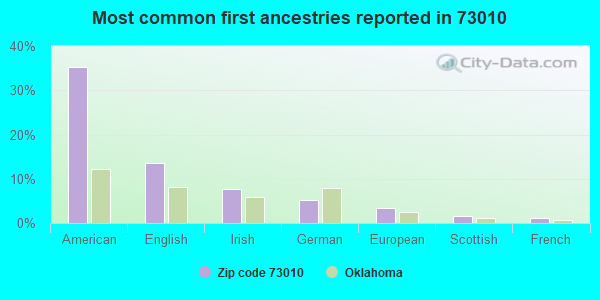
35%American
13%English
8%Irish
5%German
3%European
2%Scottish
1%French
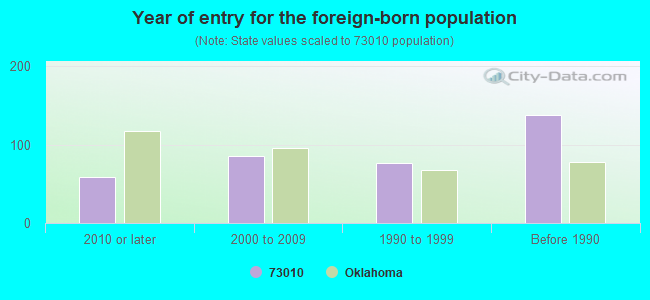
Year of entry for the foreign-born population
592010 or later
852000 to 2009
771990 to 1999
138Before 1990
Facilities with environmental interests located in this zip code:
BLANCHARD ES (400 NORTH HARRISON in BLANCHARD, OK)
(National Center for Education Statistics) - STATE ID-47-I029-105
BLANCHARD HS (400 N. HARRISON in BLANCHARD, OK)
(National Center for Education Statistics) - STATE ID-47-I029-705
BLANCHARD MS (400 N. HARRISON in BLANCHARD, OK)
(National Center for Education Statistics) - STATE ID-47-I029-510
BRIDGE CREEK ES (BRIDGE CREEK RD & MUSTANG RD in BLANCHARD, OK)
(National Center for Education Statistics) - STATE ID-26-I095-105
BRIDGE CREEK HS (BRIDGE CREEK RD. & MUSTANG RD. in BLANCHARD, OK)
(National Center for Education Statistics) - STATE ID-26-I095-705
BRIDGE CREEK MS (RT. 1, BOX 407 in BLANCHARD, OK)
(National Center for Education Statistics) - STATE ID-26-I095-505
AMERICAN TEL & TEL CO LONG LINES (HWY 0 1M E in BLANCHARD, OK) . Tribal Land
(Resource Conservation and Recovery Act (tracking hazardous waste))
BRIDGE CREEK PUBLIC SCHOOL (GRADY COUNTY in BLANCHARD, OK)
National Pollutant Discharge Elimination System NON-MAJOR (Tracking pollutant discharge elimination systems) - permit Business SIC classification: SEWERAGE SYSTEMS
BLANCHARD PUBLIC SCHOOLS (400 N HANSON STREET in BLANCHARD, OK)
COMPLIANCE ACTIVITY (Tracking inspections of insecticide, fungicide, and rodenticide, and toxic substances)
BRIDGE CREEK PUBLIC SCHOOLS (6 MILE LINE & SARA ROAD in BLANCHARD, OK)
COMPLIANCE ACTIVITY (Tracking inspections of insecticide, fungicide, and rodenticide, and toxic substances) Business SIC classification: ELEMENTARY AND SECONDARY SCHOOLS
Housing units lacking complete plumbing facilities: 0.9% Housing units lacking complete kitchen facilities: 1.1%
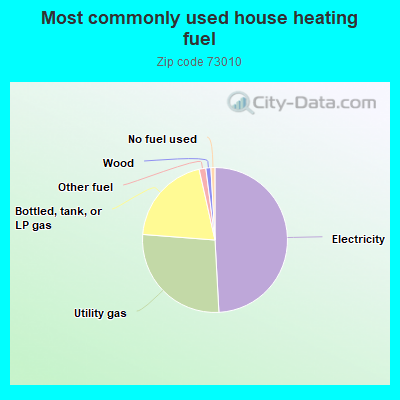
49.0%Electricity
27.0%Utility gas
20.2%Bottled, tank, or LP gas
1.5%Other fuel
1.1%Wood
0.9%No fuel used
Population in 1990: 4,511. Population change in the 1990s: +7,528 (+166.9%).
Place of birth for U.S.-born residents:
This state: 14,287
Northeast: 465
Midwest: 1,689
South: 2,377
West: 1,333
53% of the 73010 zip code residents lived in the same house 5 years ago. Out of people who lived in different houses, 31% lived in this county. Out of people who lived in different counties, 50% lived in Oklahoma.
90% of the 73010 zip code residents lived in the same house 1 year ago. Out of people who lived in different houses, 18% moved from this county. Out of people who lived in different houses, 62% moved from different county within same state. Out of people who lived in different houses, 26% moved from different state. Out of people who lived in different houses, 1% moved from abroad.
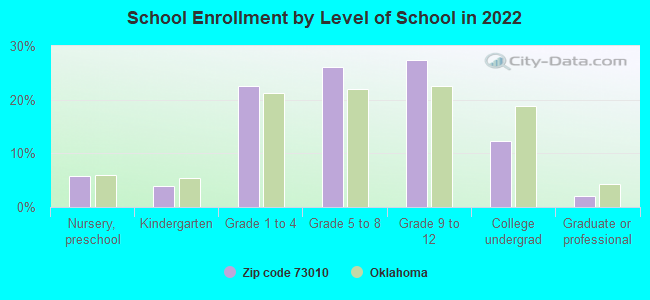
Private vs. public school enrollment:
Students in private schools in grades 1 to 8 (elementary and middle school): 360
Here:
14.2%
Oklahoma:
11.7%
Students in private schools in grades 9 to 12 (high school): 126
Here:
8.9%
Oklahoma:
11.7%
Students in private undergraduate colleges: 112
Here:
17.7%
Oklahoma:
19.3%
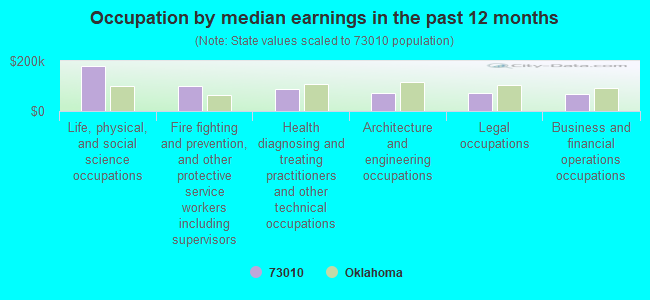
Occupation by median earnings in the past 12 months ($)
178,351Life, physical, and social science occupations
101,249Fire fighting and prevention, and other protective service workers including supervisors
88,349Health diagnosing and treating practitioners and other technical occupations
73,866Architecture and engineering occupations
71,599Legal occupations
69,694Business and financial operations occupations
Companies with federal contracts located in this zip code:
M & M WRECKING, INC (RR BOX 1009K in BLANCHARD, OK; small business) 25 employees, $1700000 revenue. : $140,000 in 6 contractsin 2001
Contracts for Demolition of Structures or Facilities (Other than Buildings) by Public Buildings Service Signed by year:2000: $0; 2001: $140,000; 2002: $0; 2003: $0; 2004: $0; 2005: $0; 2006: $0.
Biggest contracts:
$65,000 with Public Buildings Service for Demolition of Structures or Facilities (Other than Buildings). Signed on 2001-05-15. Completion date: 2001-07-15.
$44,000, same as above.Signed on 2001-06-15. Completion date: 2001-07-15.
$17,000, same as above.Signed on 2001-06-15. Completion date: 2001-07-15.
$10,000, same as above.Signed on 2001-10-15. Completion date: 2001-10-15.
Top industries in this zip code by the number of employees in 2005:
Construction: Site Preparation Contractors (50-99 employees: 1 establishment)
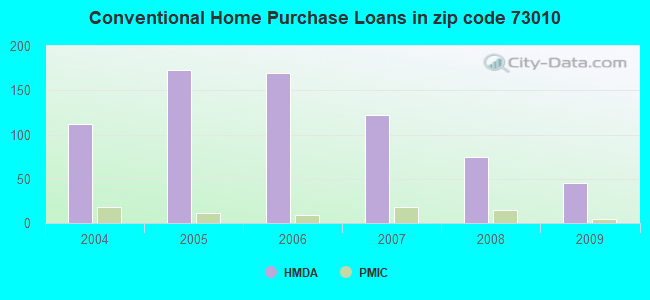
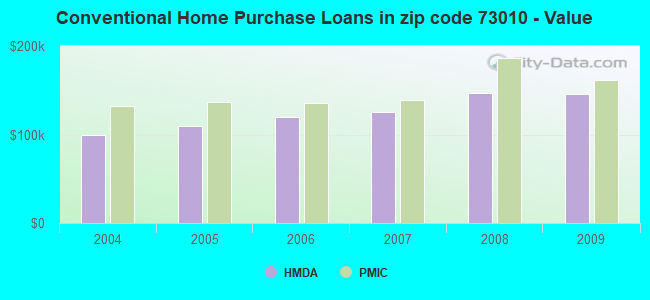
Detailed PMIC statistics for the following Tracts:0008.00
, 0009.03
2002 - 2018 National Fire Incident Reporting System (NFIRS) incidents
According to the data from the years 2002 - 2018 the average number of fire incidents per year is 108. The highest number of fire incidents - 202 took place in 2017, and the least - 21 in 2002. The data has a growing trend.
When looking into fire subcategories, the most reports belonged to: Outside Fires (66.6%), and Structure Fires (22.6%).
Fire incident types reported to NFIRS in Zip Code 73010
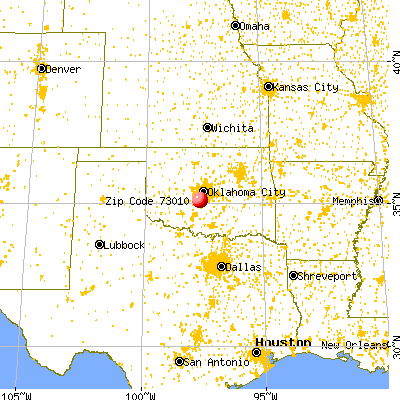


 Nearest zip codes: 73065, 73004, 73002, 73093, 73089, 73072.
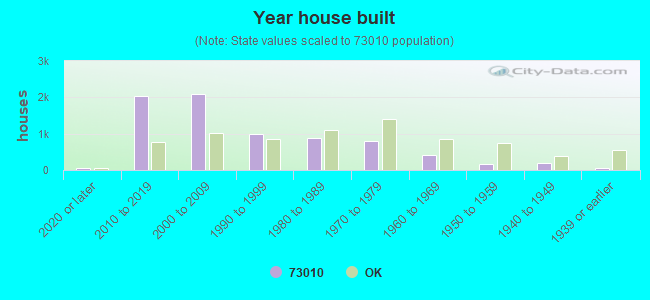


 According to the data from the years 2002 - 2018 the average number of fire incidents per year is 108. The highest number of fire incidents - 202 took place in 2017, and the least - 21 in 2002. The data has a growing trend.
 When looking into fire subcategories, the most reports belonged to: Outside Fires (66.6%), and Structure Fires (22.6%).