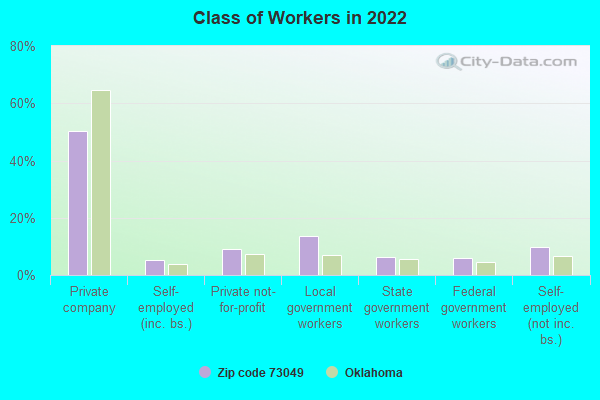
Estimated zip code population in 2022: 6,771 Zip code population in 2010: 5,910 Zip code population in 2000: 5,192
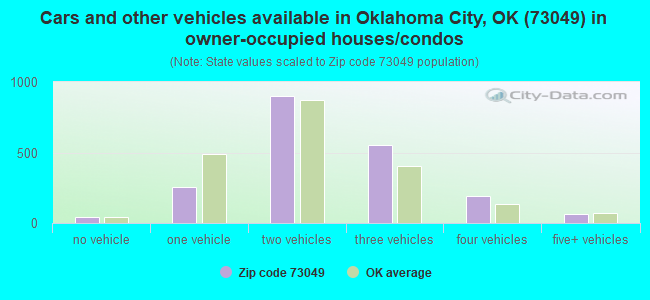
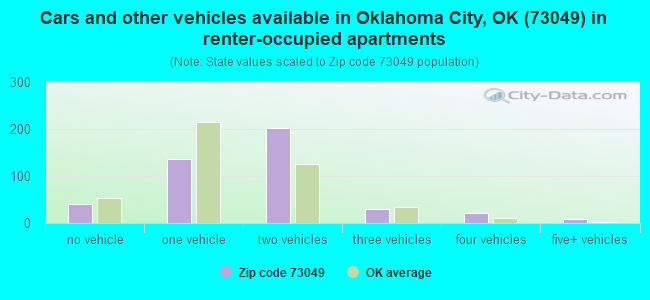
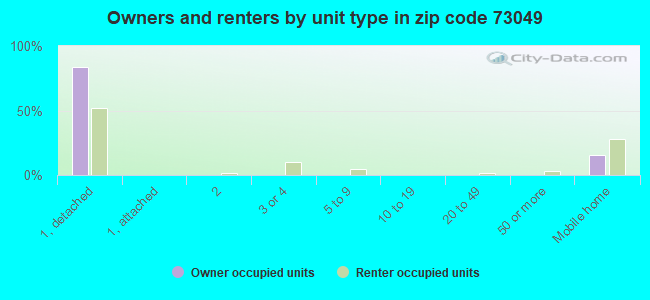
Houses and condos: 2,673 Renter-occupied apartments: 443
% of renters here:
18%
State:
35%
March 2022 cost of living index in zip code 73049: 79.7 (low, U.S. average is 100)
Land area: 61.3 sq. mi. Water area: 0.6 sq. mi.
Population density: 110 people per square mile
(very low).
OSM Map
General Map
Google Map
MSN Map
OSM Map
General Map
Google Map
MSN Map
OSM Map
General Map
Google Map
MSN Map
OSM Map
General Map
Google Map
MSN Map
Please wait while loading the map...
Real estate property taxes paid for housing units in 2022:
This zip code:
0.8% ($1,886)
Oklahoma:
0.8% ($1,501)
Median real estate property taxes paid for housing units with mortgages in 2022: $2,131 (0.8%) Median real estate property taxes paid for housing units with no mortgage in 2022: $1,241 (0.7%)
Business Search- 14 Million verified businesses
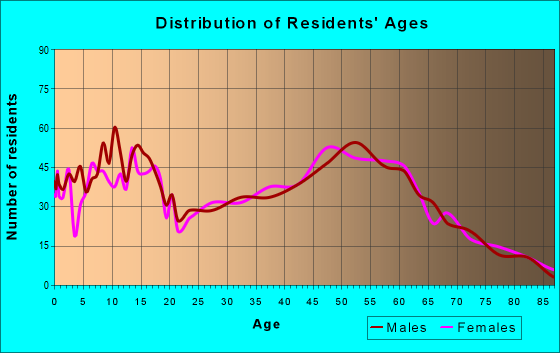
Males: 3,426
(50.6%)
Females: 3,344
(49.4%)
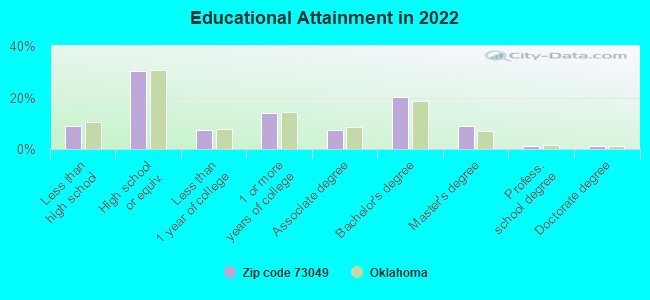
For population 25 years and over in 73049:
High school or higher: 90.9%
Bachelor's degree or higher: 31.6%
Graduate or professional degree: 11.5%
Unemployed: 3.3%
Mean travel time to work (commute): 26.5 minutes
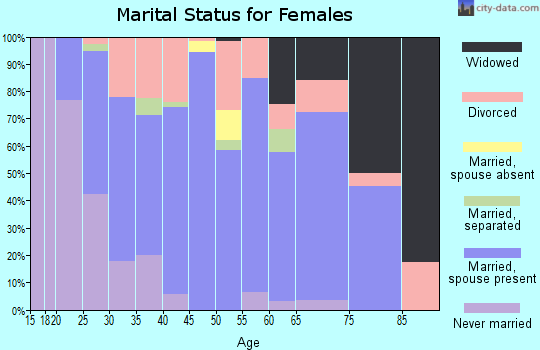
For population 15 years and over in 73049:
Never married: 21.3%
Now married: 58.3%
Separated: 1.7%
Widowed: 3.3%
Divorced: 15.3%
Zip code 73049 compared to state average:
Median age above state average.
Foreign-born population percentage significantly below state average.
Renting percentage below state average.
Length of stay since moving in significantly above state average.
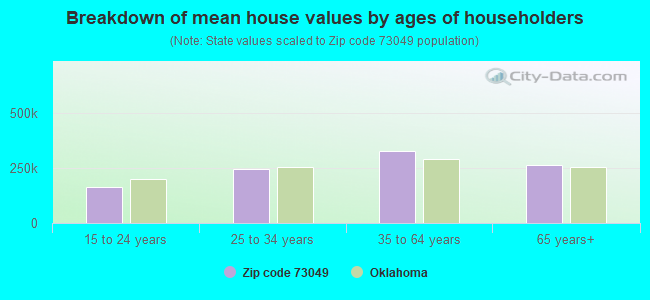
Estimated median house/condo value in 2022: $227,904
73049:
$227,904
Oklahoma:
$191,700
According to our research of Oklahoma and other state lists, there were 15 registered sex offenders living in 73049 zip code as of April 27, 2024. The ratio of all residents to sex offenders in zip code 73049 is 428 to 1. The ratio of registered sex offenders to all residents in this zip code is near the state average.
Median resident age:
This zip code:
41.3 years
Oklahoma median age:
37.1 years
Average household size:
This zip code:
2.7 people
Oklahoma:
2.5 people
Averages for the 2020 tax year for zip code 73049, filed in 2021:
Average Adjusted Gross Income (AGI) in 2020: $93,350 (Individual Income Tax Returns)
Here:
$93,350
State:
$63,060
Salary/wage: $73,604 (reported on 80.6% of returns)
Here:
$73,604
State:
$52,427
(% of AGI for various income ranges: 1183.6% for AGIs below $25k, 3499.2% for AGIs $25k-50k, 6538.7% for AGIs $50k-75k, 9602.5% for AGIs $75k-100k, 18663.8% for AGIs $100k-200k, 73895.6% for AGIs over 200k)
Taxable interest for individuals: $1,567 (reported on 35.2% of returns)
This zip code:
$1,567
Oklahoma:
$1,603
(% of AGI for various income ranges: 11.3% for AGIs below $25k, 31.5% for AGIs $25k-50k, 39.3% for AGIs $50k-75k, 80.5% for AGIs $75k-100k, 120.4% for AGIs $100k-200k, 935.6% for AGIs over 200k)
Ordinary dividends: $6,704 (reported on 17.1% of returns)
Here:
$6,704
State:
$7,001
(% of AGI for various income ranges: 20.0% for AGIs below $25k, 18.3% for AGIs $25k-50k, 46.3% for AGIs $50k-75k, 129.5% for AGIs $75k-100k, 276.2% for AGIs $100k-200k, 2376.7% for AGIs over 200k)
Net capital gain/loss in AGI: +$47,779 (reported on 17.4% of returns)
Here:
+$47,779
State:
+$19,855
(% of AGI for various income ranges: 14.8% for AGIs below $25k, 42.5% for AGIs $25k-50k, 137.7% for AGIs $50k-75k, 156.0% for AGIs $75k-100k, 555.4% for AGIs $100k-200k, 25366.7% for AGIs over 200k)
Profit/loss from business: +$15,629 (reported on 20.4% of returns)
Here:
+$15,629
State:
+$9,904
(% of AGI for various income ranges: 93.7% for AGIs below $25k, 241.1% for AGIs $25k-50k, 349.3% for AGIs $50k-75k, 135.5% for AGIs $75k-100k, 651.9% for AGIs $100k-200k, 5300.0% for AGIs over 200k)
Taxable individual retirement arrangement distribution: $30,848 (reported on 8.2% of returns)
73049:
$30,848
Oklahoma:
$20,476
(% of AGI for various income ranges: 40.4% for AGIs below $25k, 77.2% for AGIs $25k-50k, 172.3% for AGIs $50k-75k, 371.0% for AGIs $75k-100k, 894.2% for AGIs $100k-200k, 3831.1% for AGIs over 200k)
Total itemized deductions: $45,374 (reported on 11.5% of returns)
Here:
$45,374
State:
$39,736
(% of AGI for various income ranges: 149.1% for AGIs $25k-50k, 325.3% for AGIs $50k-75k, 580.5% for AGIs $75k-100k, 1742.3% for AGIs $100k-200k, 9360.0% for AGIs over 200k)
Charity contributions: $16,627 (reported on 9.9% of returns)
Here:
$16,627
State:
$17,288
(% of AGI for various income ranges: 112.0% for AGIs $50k-75k, 104.5% for AGIs $75k-100k, 467.3% for AGIs $100k-200k, 3586.7% for AGIs over 200k)
Taxes paid: $8,234 (reported on 11.5% of returns)
73049:
$8,234
State:
$7,046
(% of AGI for various income ranges: 20.9% for AGIs $25k-50k, 57.0% for AGIs $50k-75k, 86.5% for AGIs $75k-100k, 401.5% for AGIs $100k-200k, 1536.7% for AGIs over 200k)
Earned income credit: $2,230 (reported on 15.1% of returns)
Here:
$2,230
State:
$2,435
(% of AGI for various income ranges: 94.5% for AGIs below $25k, 74.2% for AGIs $25k-50k)
Percentage of individuals using paid preparers for their 2020 taxes: 93.1%
Here:
93%
State:
94%
(% for various income ranges: 92.3% for AGIs below $25k, 92.6% for AGIs $25k-50k, 95.2% for AGIs $50k-75k, 90.3% for AGIs $75k-100k, 93.8% for AGIs $100k-200k, 95.8% for AGIs over 200k)
Averages for the 2012 tax year for zip code 73049, filed in 2013:
Average Adjusted Gross Income (AGI) in 2012: $69,313 (Individual Income Tax Returns)
Here:
$69,313
State:
$58,581
Salary/wage: $53,931 (reported on 84.0% of returns)
Here:
$53,931
State:
$45,973
(% of AGI for various income ranges: 75.7% for AGIs below $25k, 77.0% for AGIs $25k-50k, 78.6% for AGIs $50k-75k, 77.5% for AGIs $75k-100k, 75.1% for AGIs $100k-200k, 45.4% for AGIs over 200k)
Taxable interest for individuals: $1,008 (reported on 32.0% of returns)
This zip code:
$1,008
Oklahoma:
$1,625
(% of AGI for various income ranges: 0.4% for AGIs below $25k, 0.4% for AGIs $25k-50k, 0.6% for AGIs $50k-75k, 0.4% for AGIs $75k-100k, 0.3% for AGIs $100k-200k, 0.5% for AGIs over 200k)
Ordinary dividends: $7,582 (reported on 14.5% of returns)
Here:
$7,582
State:
$6,374
(% of AGI for various income ranges: 0.3% for AGIs below $25k, 0.6% for AGIs $25k-50k, 0.6% for AGIs $50k-75k, 0.5% for AGIs $75k-100k, 0.6% for AGIs $100k-200k, 3.4% for AGIs over 200k)
Net capital gain/loss in AGI: +$14,467 (reported on 11.2% of returns)
Here:
+$14,467
State:
+$24,023
(% of AGI for various income ranges: 0.9% for AGIs $50k-75k, 0.7% for AGIs $75k-100k, 1.3% for AGIs $100k-200k, 5.2% for AGIs over 200k)
Profit/loss from business: +$11,666 (reported on 19.7% of returns)
Here:
+$11,666
State:
+$11,913
(% of AGI for various income ranges: 10.0% for AGIs below $25k, 4.0% for AGIs $25k-50k, 3.0% for AGIs $50k-75k, 1.5% for AGIs $75k-100k, 3.0% for AGIs $100k-200k, 2.7% for AGIs over 200k)
Taxable individual retirement arrangement distribution: $18,710 (reported on 7.8% of returns)
73049:
$18,710
Oklahoma:
$15,242
(% of AGI for various income ranges: 2.3% for AGIs below $25k, 1.9% for AGIs $25k-50k, 1.6% for AGIs $50k-75k, 3.1% for AGIs $75k-100k, 3.4% for AGIs $100k-200k, 1.3% for AGIs over 200k)
Total itemized deductions: $24,835 (17% of AGI, reported on 30.1% of returns)
Here:
$24,835
State:
$24,882
Here:
16.8% of AGI
State:
18.8% of AGI
(% of AGI for various income ranges: 6.7% for AGIs below $25k, 6.6% for AGIs $25k-50k, 11.6% for AGIs $50k-75k, 10.7% for AGIs $75k-100k, 15.0% for AGIs $100k-200k, 10.4% for AGIs over 200k)
Charity contributions: $5,645 (reported on 23.8% of returns)
Here:
$5,645
State:
$6,591
(% of AGI for various income ranges: 0.6% for AGIs below $25k, 0.7% for AGIs $25k-50k, 1.7% for AGIs $50k-75k, 1.7% for AGIs $75k-100k, 3.1% for AGIs $100k-200k, 2.1% for AGIs over 200k)
Taxes paid: $8,006 (reported on 30.1% of returns)
73049:
$8,006
State:
$7,196
(% of AGI for various income ranges: 0.9% for AGIs below $25k, 1.3% for AGIs $25k-50k, 2.5% for AGIs $50k-75k, 3.0% for AGIs $75k-100k, 4.9% for AGIs $100k-200k, 4.4% for AGIs over 200k)
Earned income credit: $2,260 (reported on 17.8% of returns)
Here:
$2,260
State:
$2,354
(% of AGI for various income ranges: 6.9% for AGIs below $25k, 1.1% for AGIs $25k-50k)
Percentage of individuals using paid preparers for their 2012 taxes: 54.3%
Here:
54%
State:
56%
(% for various income ranges: 47.4% for AGIs below $25k, 53.7% for AGIs $25k-50k, 56.1% for AGIs $50k-75k, 58.3% for AGIs $75k-100k, 62.1% for AGIs $100k-200k, 76.9% for AGIs over 200k)
Averages for the 2004 tax year for zip code 73049, filed in 2005:
Average Adjusted Gross Income (AGI) in 2004: $42,331 (Individual Income Tax Returns)
Here:
$42,331
State:
$41,245
Salary/wage: $38,579 (reported on 83.7% of returns)
Here:
$38,579
State:
$35,318
(% of AGI for various income ranges: 112.3% for AGIs below $10k, 78.0% for AGIs $10k-25k, 81.1% for AGIs $25k-50k, 85.2% for AGIs $50k-75k, 82.6% for AGIs $75k-100k, 60.6% for AGIs over 100k)
Taxable interest for individuals: $1,420 (reported on 39.3% of returns)
This zip code:
$1,420
Oklahoma:
$1,745
(% of AGI for various income ranges: 9.1% for AGIs below $10k, 0.9% for AGIs $10k-25k, 1.0% for AGIs $25k-50k, 0.7% for AGIs $50k-75k, 1.0% for AGIs $75k-100k, 1.9% for AGIs over 100k)
Taxable dividends: $1,900 (reported on 15.6% of returns)
Here:
$1,900
State:
$2,920
(% of AGI for various income ranges: 1.4% for AGIs below $10k, 0.5% for AGIs $10k-25k, 0.5% for AGIs $25k-50k, 0.3% for AGIs $50k-75k, 0.4% for AGIs $75k-100k, 1.3% for AGIs over 100k)
Net capital gain/loss: +$6,118 (reported on 12.1% of returns)
Here:
+$6,118
State:
+$10,653
(% of AGI for various income ranges: -0.9% for AGIs below $10k, -0.3% for AGIs $10k-25k, 0.1% for AGIs $25k-50k, 0.5% for AGIs $50k-75k, 0.3% for AGIs $75k-100k, 5.5% for AGIs over 100k)
Profit/loss from business: +$9,622 (reported on 20.3% of returns)
Here:
+$9,622
State:
+$8,532
(% of AGI for various income ranges: 15.2% for AGIs below $10k, 8.1% for AGIs $10k-25k, 3.2% for AGIs $25k-50k, 1.9% for AGIs $50k-75k, 1.4% for AGIs $75k-100k, 7.5% for AGIs over 100k)
IRA payment deduction: $2,591 (reported on 1.9% of returns)
73049:
$2,591
Oklahoma:
$3,127
Self-employed pension: $14,286 (reported on 0.6% of returns)
Here:
$14,286
Oklahoma:
$14,276
Total itemized deductions: $16,939 (21% of AGI, reported on 33.4% of returns)
Here:
$16,939
State:
$17,093
Here:
21.4% of AGI
State:
20.5% of AGI
(% of AGI for various income ranges: 6.8% for AGIs below $10k, 8.8% for AGIs $10k-25k, 11.3% for AGIs $25k-50k, 13.8% for AGIs $50k-75k, 17.4% for AGIs $75k-100k, 14.4% for AGIs over 100k)
Charity contributions deductions: $4,017 (5% of AGI, reported on 27.7% of returns)
Here:
$4,017
State:
$4,240
Here:
4.8% of AGI
State:
4.8% of AGI
(% of AGI for various income ranges: 1.5% for AGIs $10k-25k, 2.0% for AGIs $25k-50k, 1.9% for AGIs $50k-75k, 3.4% for AGIs $75k-100k, 3.8% for AGIs over 100k)
Total tax: $6,264 (reported on 74.1% of returns)
73049:
$6,264
State:
$6,542
(% of AGI for various income ranges: 4.1% for AGIs below $10k, 4.1% for AGIs $10k-25k, 6.3% for AGIs $25k-50k, 8.4% for AGIs $50k-75k, 9.9% for AGIs $75k-100k, 19.6% for AGIs over 100k)
Earned income credit: $1,870 (reported on 18.5% of returns)
Here:
$1,870
State:
$1,830
Percentage of individuals using paid preparers for their 2004 taxes: 60.7%
Here:
61%
State:
63%
(% for various income ranges: 55.3% for AGIs below $10k, 60.4% for AGIs $10k-25k, 60.3% for AGIs $25k-50k, 64.1% for AGIs $50k-75k, 61.7% for AGIs $75k-100k, 71.7% for AGIs over 100k)
Household received Food Stamps/SNAP in the past 12 months: 185 Household did not receive Food Stamps/SNAP in the past 12 months: 2,259
Women who had a birth in the past 12 months: 111 (56 now married, 52 unmarried) Women who did not have a birth in the past 12 months: 1,262 (672 now married, 589 unmarried)
Housing units in zip code 73049 with a mortgage: 1,108 (59 second mortgage, 36 both second mortgage and home equity loan) Houses without a mortgage: 3
Median monthly owner costs for units with a mortgage: $1,689 Median monthly owner costs for units without a mortgage: $513
Residents with income below the poverty level in 2022:
This zip code:
9.8%
Whole state:
15.7%
Residents with income below 50% of the poverty level in 2022:
This zip code:
5.4%
Whole state:
8.3%
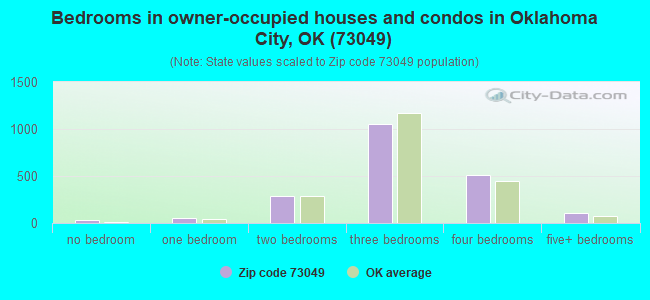
Median number of rooms in houses and condos:
Here:
6.5
State:
6.1
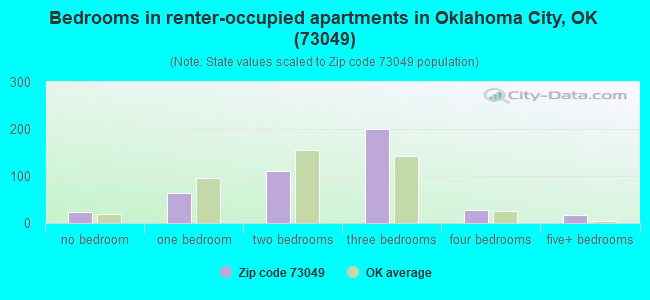
Median number of rooms in apartments:
Here:
5.0
State:
4.5
Notable locations in this zip code not listed on our city pages
Churches in zip code 73049 include: Shibboleth Jesus Divine Church (A), Jones Full Gospel Bible Church (B), First Baptist Church (C), Saint Mary Ukrainian Orthodox Church (D), Salem Church (E), Pleasant Valley Church (F). Display/hide their locations on the map
Cemeteries: Lillard & Woodard Cemetery (1), Jones Independent Order of Odd Fellows Cemetery (2), Chitwood Cemetery (3). Display/hide their locations on the map
In group quarters: 118 (-1 institutionalized population)
Size of family households: 840 2-persons, 311 3-persons, 376 4-persons, 116 5-persons, 42 6-persons, 116 7-or-more-persons
Size of nonfamily households: 455 1-person, 220 2-persons, 10 4-persons
1,164 married couples with children.
318 single-parent households (107 men, 211 women).
93.0% of residents of 73049 zip code speak English at home.
5.8% of residents speak Spanish at home (60% very well, 11% well, 16% not well, 13% not at all).
0.6% of residents speak other Indo-European language at home (72% very well, 15% well, 13% not well).
0.1% of residents speak Asian or Pacific Island language at home (100% well).
0.2% of residents speak other language at home (100% very well).
Foreign born population: 159 (2.4%) (42.7% of them are naturalized citizens)
This zip code:
2.4%
Whole state:
6.0%
43%Honduras
18%Sweden
9%El Salvador
8%England
8%United Kingdom, excluding England and Scotland
6%Costa Rica
4%Romania
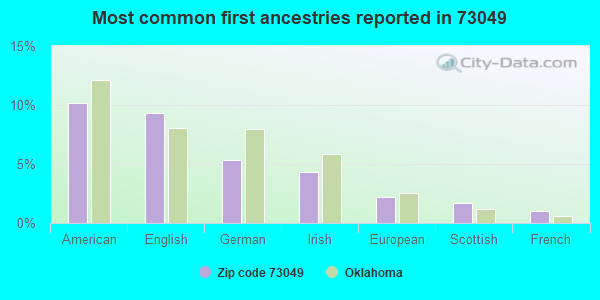
10%American
9%English
5%German
4%Irish
2%European
2%Scottish
1%French
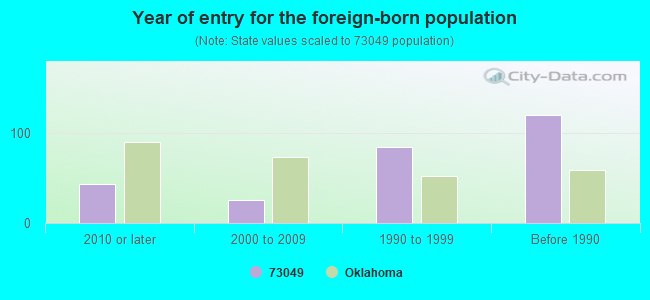
Year of entry for the foreign-born population
432010 or later
262000 to 2009
851990 to 1999
120Before 1990
Facilities with environmental interests located in this zip code:
MADEWELL AND MADEWELL INCORPORATED (9400 N CHOCTAW RD in JONES, OK) . Tribal Land
(Integrated Compliance Information System) - ICIS-06-1989-0501, FORMAL ENFORCEMENT ACTION, ICIS-06-1984-0073, ICIS-06-1986-0016, COMPLIANCE ACTIVITY (Tracking inspections of insecticide, fungicide, and rodenticide, and toxic substances) Conditionally Exempt Small Quantity Generators, less than 100 kg/month of hazardous waste (Resource Conservation and Recovery Act (tracking hazardous waste)) HAZARDOUS WASTE BIENNIAL REPORTER (Resource Conservation and Recovery Act (tracking hazardous waste)) TSD (Resource Conservation and Recovery Act (tracking hazardous waste)) - notification Business SIC classification: SECONDARY SMELTING AND REFINING OF NONFERROUS METALS; SCRAP AND WASTE MATERIALS Organizations: MADEWELL & MADEWELL, INC. (CONTACT/OPERATOR)
Housing units lacking complete plumbing facilities: 4.0% Housing units lacking complete kitchen facilities: 3.3%
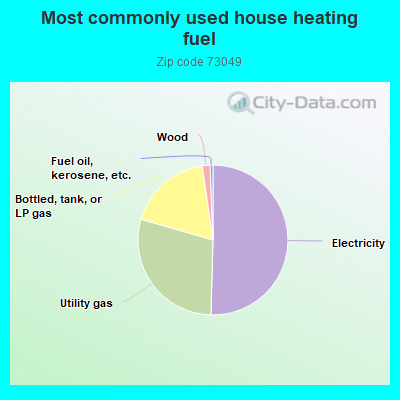
50.4%Electricity
29.0%Utility gas
18.2%Bottled, tank, or LP gas
1.7%Wood
0.6%Fuel oil, kerosene, etc.
Population in 1990: 3,059. Population change in the 1990s: +2,133 (+69.7%).
Place of birth for U.S.-born residents:
This state: 4,690
Northeast: 147
Midwest: 695
South: 514
West: 414
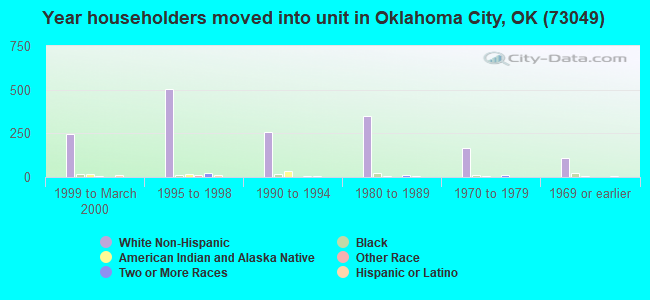
56% of the 73049 zip code residents lived in the same house 5 years ago. Out of people who lived in different houses, 71% lived in this county. Out of people who lived in different counties, 50% lived in Oklahoma.
92% of the 73049 zip code residents lived in the same house 1 year ago. Out of people who lived in different houses, 71% moved from this county. Out of people who lived in different houses, 15% moved from different county within same state. Out of people who lived in different houses, 12% moved from different state.
Private vs. public school enrollment:
Students in private schools in grades 1 to 8 (elementary and middle school): 170
Here:
18.3%
Oklahoma:
11.7%
Students in private schools in grades 9 to 12 (high school): 82
Here:
15.5%
Oklahoma:
11.7%
Students in private undergraduate colleges: 45
Here:
35.2%
Oklahoma:
19.3%
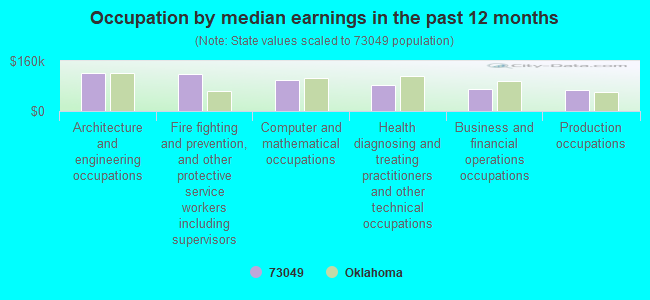
Occupation by median earnings in the past 12 months ($)
121,528Architecture and engineering occupations
117,060Fire fighting and prevention, and other protective service workers including supervisors
98,847Computer and mathematical occupations
83,233Health diagnosing and treating practitioners and other technical occupations
70,228Business and financial operations occupations
68,707Production occupations
Companies with federal contracts located in this zip code:
TAYLOR'S LAWN SERVICE (519 W KANSAS ST in JONES, OK; small business) : $122,919 in 10 contractsfrom 2001 to 2006
Contracts for Landscaping/Groundskeeping Services by Army Signed by year:2000: $0; 2001: $37,320; 2002: $0; 2003: $28,998; 2004: $30,864; 2005: $9,237; 2006: $16,500.
Biggest contracts:
$37,320 with Army for Landscaping/Groundskeeping Services. Signed on 2001-12-11. Completion date: 2002-09-30.
$30,864, same as above.Signed on 2004-10-01. Completion date: 2005-09-30.
$28,998, same as above.Signed on 2003-11-10. Completion date: 2004-09-30.
$11,008, same as above.Signed on 2006-04-17. Completion date: 2006-09-30.
Top industries in this zip code by the number of employees in 2005:
Health Care and Social Assistance: Nursing Care Facilities (100-249 employees: 1 establishment)
Utilities: Water Supply and Irrigation Systems (50-99: 1)
Accommodation and Food Services: Limited-Service Restaurants (20-49: 1, 1-4: 2)
Health Care and Social Assistance: Other Residential Care Facilities (20-49: 1)
Administrative and Support and Waste Management and Remediation Services: Materials Recovery Facilities (20-49: 1)
Health Care and Social Assistance: Child Day Care Services (20-49: 1)
Other Services (except Public Administration): Photofinishing Laboratories (except One-Hour) (20-49: 1)
Professional, Scientific, and Technical Services: Offices of Lawyers (20-49: 1)
People in group quarters in 2010:
97 people in nursing facilities/skilled-nursing facilities
15 people in group homes for juveniles (non-correctional)
People in group quarters in 2000:
136 people in nursing homes
Fatal accident statistics in 2014:
Fatal accident count: 3
Vehicles involved in fatal accidents: 5
Fatal accidents caused by drunken drivers: 1
Fatalities: 3
Persons involved in fatal accidents: 6
Pedestrians involved in fatal accidents: 0
Fatal accident statistics in 2012:
Fatal accident count: 3
Vehicles involved in fatal accidents: 3
Fatal accidents caused by drunken drivers: 2
Fatalities: 4
Persons involved in fatal accidents: 5
Pedestrians involved in fatal accidents: 0
Home Mortgage Disclosure Act Aggregated Statistics For Year 2009 (Based on 10 partial tracts)
A) FHA, FSA/RHS & VA Home Purchase Loans
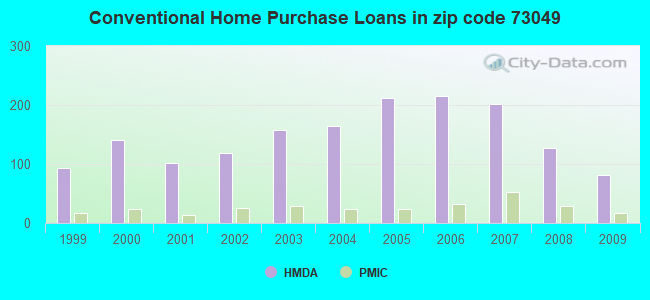
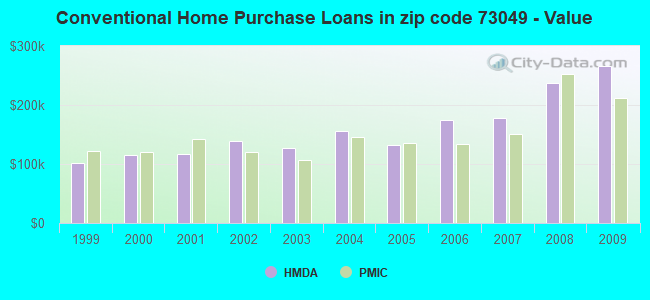
B) Conventional Home Purchase Loans
C) Refinancings
D) Home Improvement Loans
F) Non-occupant Loans on < 5 Family Dwellings (A B C & D)
G) Loans On Manufactured Home Dwelling (A B C & D)
Number
Average Value
Number
Average Value
Number
Average Value
Number
Average Value
Number
Average Value
Number
Average Value
LOANS ORIGINATED
65
$122,559
82
$265,510
320
$196,431
85
$36,555
36
$133,545
45
$59,862
APPLICATIONS APPROVED, NOT ACCEPTED
2
$161,500
5
$76,326
29
$172,769
13
$53,803
0
$0
7
$55,774
APPLICATIONS DENIED
9
$116,546
26
$67,497
100
$171,283
61
$47,421
10
$25,225
21
$51,081
APPLICATIONS WITHDRAWN
7
$130,461
11
$216,377
75
$197,862
10
$79,481
8
$44,616
6
$87,280
FILES CLOSED FOR INCOMPLETENESS
0
$0
2
$62,915
20
$155,571
2
$39,200
0
$0
4
$50,665
Aggregated Statistics For Year 2008 (Based on 10 partial tracts)
A) FHA, FSA/RHS & VA Home Purchase Loans
B) Conventional Home Purchase Loans
C) Refinancings
D) Home Improvement Loans
F) Non-occupant Loans on < 5 Family Dwellings (A B C & D)
G) Loans On Manufactured Home Dwelling (A B C & D)
Number
Average Value
Number
Average Value
Number
Average Value
Number
Average Value
Number
Average Value
Number
Average Value
LOANS ORIGINATED
68
$129,615
127
$237,646
202
$139,646
74
$33,964
35
$150,994
40
$62,544
APPLICATIONS APPROVED, NOT ACCEPTED
1
$172,410
30
$227,637
17
$114,385
7
$11,386
2
$64,050
12
$57,210
APPLICATIONS DENIED
12
$101,708
52
$105,472
133
$153,285
45
$32,788
9
$40,758
52
$82,139
APPLICATIONS WITHDRAWN
7
$176,946
14
$252,651
62
$158,099
2
$52,935
0
$0
9
$69,766
FILES CLOSED FOR INCOMPLETENESS
4
$110,598
1
$31,640
7
$175,973
2
$96,475
0
$0
7
$98,129
Aggregated Statistics For Year 2007 (Based on 10 partial tracts)
A) FHA, FSA/RHS & VA Home Purchase Loans
B) Conventional Home Purchase Loans
C) Refinancings
D) Home Improvement Loans
F) Non-occupant Loans on < 5 Family Dwellings (A B C & D)
G) Loans On Manufactured Home Dwelling (A B C & D)
Number
Average Value
Number
Average Value
Number
Average Value
Number
Average Value
Number
Average Value
Number
Average Value
LOANS ORIGINATED
28
$142,078
202
$178,774
182
$139,597
86
$35,873
33
$139,594
40
$79,848
APPLICATIONS APPROVED, NOT ACCEPTED
0
$0
29
$185,121
34
$145,053
8
$47,146
1
$62,170
13
$86,692
APPLICATIONS DENIED
2
$115,510
60
$137,252
183
$111,930
71
$44,388
14
$55,683
62
$75,005
APPLICATIONS WITHDRAWN
1
$152,790
20
$139,634
64
$131,382
19
$73,243
7
$56,330
6
$70,135
FILES CLOSED FOR INCOMPLETENESS
0
$0
11
$194,421
15
$165,525
1
$85,140
3
$199,493
0
$0
Aggregated Statistics For Year 2006 (Based on 10 partial tracts)
A) FHA, FSA/RHS & VA Home Purchase Loans
B) Conventional Home Purchase Loans
C) Refinancings
D) Home Improvement Loans
F) Non-occupant Loans on < 5 Family Dwellings (A B C & D)
G) Loans On Manufactured Home Dwelling (A B C & D)
Number
Average Value
Number
Average Value
Number
Average Value
Number
Average Value
Number
Average Value
Number
Average Value
LOANS ORIGINATED
36
$122,978
216
$174,167
247
$127,125
91
$30,136
43
$165,694
57
$62,700
APPLICATIONS APPROVED, NOT ACCEPTED
3
$92,657
26
$102,399
53
$137,676
10
$25,224
3
$60,907
16
$62,834
APPLICATIONS DENIED
2
$116,610
63
$72,240
198
$111,599
53
$48,134
20
$56,822
52
$61,034
APPLICATIONS WITHDRAWN
5
$83,782
25
$147,923
118
$118,394
16
$115,452
5
$74,310
9
$94,557
FILES CLOSED FOR INCOMPLETENESS
0
$0
11
$88,595
14
$129,078
2
$20,565
3
$43,543
0
$0
Aggregated Statistics For Year 2005 (Based on 10 partial tracts)
A) FHA, FSA/RHS & VA Home Purchase Loans
B) Conventional Home Purchase Loans
C) Refinancings
D) Home Improvement Loans
F) Non-occupant Loans on < 5 Family Dwellings (A B C & D)
G) Loans On Manufactured Home Dwelling (A B C & D)
Number
Average Value
Number
Average Value
Number
Average Value
Number
Average Value
Number
Average Value
Number
Average Value
LOANS ORIGINATED
38
$102,883
212
$132,963
244
$120,697
79
$45,081
26
$58,573
35
$74,711
APPLICATIONS APPROVED, NOT ACCEPTED
0
$0
40
$85,178
55
$90,099
5
$87,178
2
$83,135
38
$62,304
APPLICATIONS DENIED
10
$98,655
79
$68,759
221
$102,385
68
$29,480
15
$36,229
60
$55,681
APPLICATIONS WITHDRAWN
1
$132,260
54
$97,066
147
$130,189
12
$108,362
12
$92,777
12
$65,697
FILES CLOSED FOR INCOMPLETENESS
0
$0
6
$124,917
15
$127,246
2
$148,610
4
$59,098
0
$0
Aggregated Statistics For Year 2004 (Based on 10 partial tracts)
A) FHA, FSA/RHS & VA Home Purchase Loans
B) Conventional Home Purchase Loans
C) Refinancings
D) Home Improvement Loans
F) Non-occupant Loans on < 5 Family Dwellings (A B C & D)
G) Loans On Manufactured Home Dwelling (A B C & D)
Number
Average Value
Number
Average Value
Number
Average Value
Number
Average Value
Number
Average Value
Number
Average Value
LOANS ORIGINATED
35
$87,201
164
$155,312
315
$121,825
79
$35,624
19
$48,024
41
$65,185
APPLICATIONS APPROVED, NOT ACCEPTED
4
$92,922
23
$103,342
82
$109,650
5
$45,808
1
$64,380
13
$64,069
APPLICATIONS DENIED
10
$66,751
62
$96,046
238
$110,974
42
$37,044
15
$40,276
58
$64,673
APPLICATIONS WITHDRAWN
0
$0
18
$136,904
152
$111,477
7
$48,750
8
$45,300
18
$67,380
FILES CLOSED FOR INCOMPLETENESS
2
$59,495
9
$182,802
22
$114,087
2
$46,615
0
$0
2
$95,570
Aggregated Statistics For Year 2003 (Based on 10 partial tracts)
A) FHA, FSA/RHS & VA Home Purchase Loans
B) Conventional Home Purchase Loans
C) Refinancings
D) Home Improvement Loans
F) Non-occupant Loans on < 5 Family Dwellings (A B C & D)
Number
Average Value
Number
Average Value
Number
Average Value
Number
Average Value
Number
Average Value
LOANS ORIGINATED
45
$82,533
158
$126,960
520
$126,415
57
$18,949
20
$57,239
APPLICATIONS APPROVED, NOT ACCEPTED
1
$63,390
33
$81,717
66
$134,262
5
$49,178
1
$14,370
APPLICATIONS DENIED
4
$90,608
63
$57,063
250
$92,011
37
$24,856
11
$51,044
APPLICATIONS WITHDRAWN
4
$77,468
16
$134,658
129
$118,495
1
$31,960
4
$100,268
FILES CLOSED FOR INCOMPLETENESS
2
$180,305
11
$69,138
46
$104,059
1
$26,040
3
$70,840
Aggregated Statistics For Year 2002 (Based on 6 partial tracts)
A) FHA, FSA/RHS & VA Home Purchase Loans
B) Conventional Home Purchase Loans
C) Refinancings
D) Home Improvement Loans
F) Non-occupant Loans on < 5 Family Dwellings (A B C & D)
Number
Average Value
Number
Average Value
Number
Average Value
Number
Average Value
Number
Average Value
LOANS ORIGINATED
21
$68,345
118
$138,909
323
$139,468
28
$21,522
21
$136,780
APPLICATIONS APPROVED, NOT ACCEPTED
0
$0
19
$93,822
55
$112,734
6
$52,737
6
$53,645
APPLICATIONS DENIED
2
$35,085
37
$79,891
150
$79,327
23
$9,545
8
$64,034
APPLICATIONS WITHDRAWN
2
$31,290
19
$137,782
93
$80,094
2
$9,025
6
$60,368
FILES CLOSED FOR INCOMPLETENESS
0
$0
2
$176,140
33
$94,826
0
$0
2
$71,115
Aggregated Statistics For Year 2001 (Based on 6 partial tracts)
A) FHA, FSA/RHS & VA Home Purchase Loans
B) Conventional Home Purchase Loans
C) Refinancings
D) Home Improvement Loans
F) Non-occupant Loans on < 5 Family Dwellings (A B C & D)
Number
Average Value
Number
Average Value
Number
Average Value
Number
Average Value
Number
Average Value
LOANS ORIGINATED
25
$91,590
102
$116,964
286
$115,192
59
$20,277
12
$76,198
APPLICATIONS APPROVED, NOT ACCEPTED
0
$0
26
$88,694
47
$89,839
6
$20,545
4
$32,815
APPLICATIONS DENIED
2
$82,495
63
$56,712
184
$72,121
49
$23,099
9
$36,691
APPLICATIONS WITHDRAWN
2
$74,255
8
$97,712
80
$76,199
12
$24,186
0
$0
FILES CLOSED FOR INCOMPLETENESS
2
$62,580
6
$71,747
23
$118,159
0
$0
4
$167,015
Aggregated Statistics For Year 2000 (Based on 6 partial tracts)
A) FHA, FSA/RHS & VA Home Purchase Loans
B) Conventional Home Purchase Loans
C) Refinancings
D) Home Improvement Loans
E) Loans on Dwellings For 5+ Families
F) Non-occupant Loans on < 5 Family Dwellings (A B C & D)
Number
Average Value
Number
Average Value
Number
Average Value
Number
Average Value
Number
Average Value
Number
Average Value
LOANS ORIGINATED
32
$73,931
141
$114,932
134
$85,911
36
$19,597
2
$796,490
15
$47,693
APPLICATIONS APPROVED, NOT ACCEPTED
4
$58,662
38
$71,422
48
$54,277
19
$22,232
0
$0
4
$33,345
APPLICATIONS DENIED
6
$74,498
72
$56,785
113
$57,413
35
$11,589
0
$0
7
$126,183
APPLICATIONS WITHDRAWN
6
$55,943
12
$134,982
73
$77,433
0
$0
0
$0
0
$0
FILES CLOSED FOR INCOMPLETENESS
0
$0
5
$134,890
12
$77,312
2
$33,185
0
$0
0
$0
Aggregated Statistics For Year 1999 (Based on 4 partial tracts)
A) FHA, FSA/RHS & VA Home Purchase Loans
B) Conventional Home Purchase Loans
C) Refinancings
D) Home Improvement Loans
F) Non-occupant Loans on < 5 Family Dwellings (A B C & D)
2002 - 2018 National Fire Incident Reporting System (NFIRS) incidents
According to the data from the years 2002 - 2018 the average number of fire incidents per year is 44. The highest number of fire incidents - 84 took place in 2014, and the least - 3 in 2004. The data has a growing trend.
When looking into fire subcategories, the most reports belonged to: Outside Fires (66.9%), and Structure Fires (20.7%).
Fire incident types reported to NFIRS in Zip Code 73049
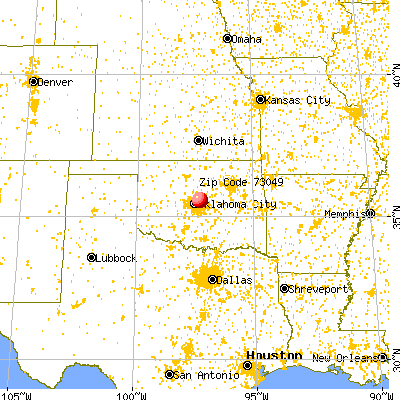


 Nearest zip codes: 73084, 73066, 73007, 73151, 73141, 73130.
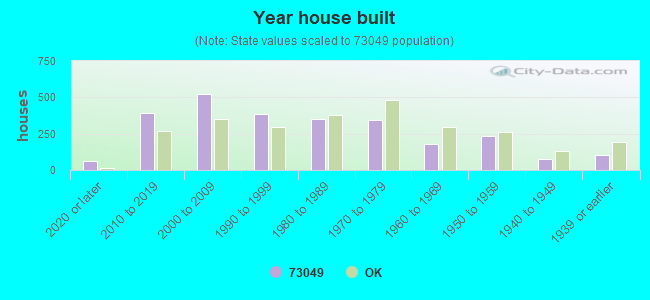


 . Tribal Land
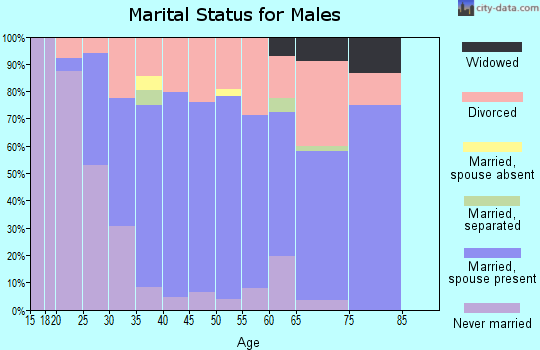

 According to the data from the years 2002 - 2018 the average number of fire incidents per year is 44. The highest number of fire incidents - 84 took place in 2014, and the least - 3 in 2004. The data has a growing trend.
 When looking into fire subcategories, the most reports belonged to: Outside Fires (66.9%), and Structure Fires (20.7%).