Estimated zip code population in 2022: 2,386 Zip code population in 2010: 2,178 Zip code population in 2000: 1,618
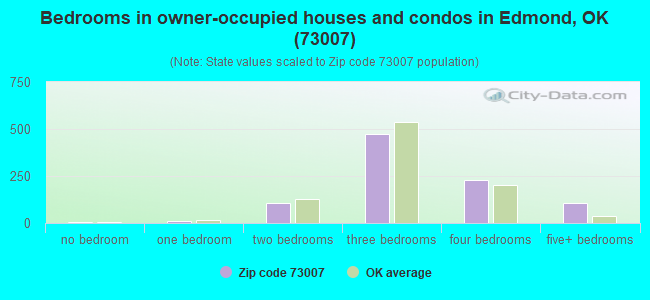
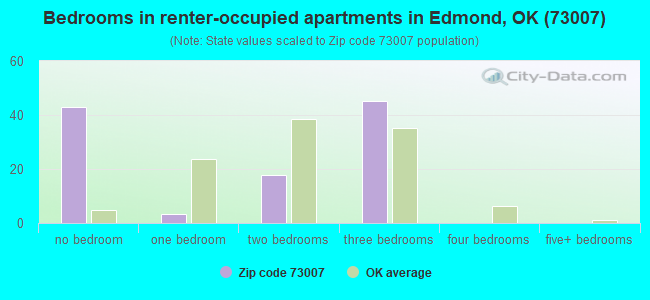
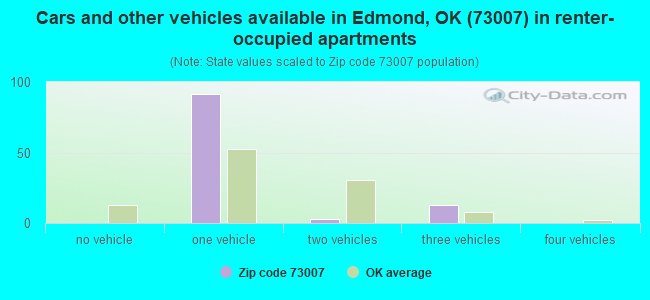
Houses and condos: 1,057 Renter-occupied apartments: 105
% of renters here:
10%
State:
35%
March 2022 cost of living index in zip code 73007: 82.0 (low, U.S. average is 100)
Land area: 40.8 sq. mi. Water area: 0.2 sq. mi.
Population density: 58 people per square mile
(very low).
OSM Map
General Map
Google Map
MSN Map
OSM Map
General Map
Google Map
MSN Map
OSM Map
General Map
Google Map
MSN Map
OSM Map
General Map
Google Map
MSN Map
Please wait while loading the map...
Real estate property taxes paid for housing units in 2022:
This zip code:
0.6% ($3,201)
Oklahoma:
0.8% ($1,501)
Median real estate property taxes paid for housing units with mortgages in 2022: $2,990 (0.5%) Median real estate property taxes paid for housing units with no mortgage in 2022: $3,394 (0.6%)
Business Search- 14 Million verified businesses
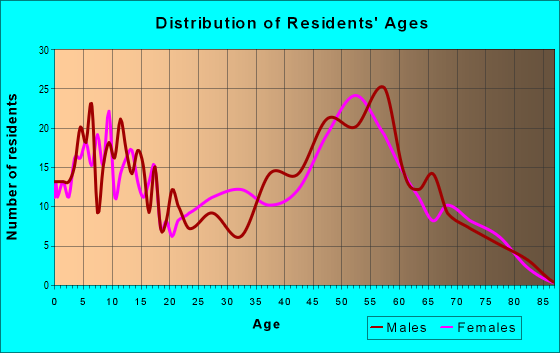
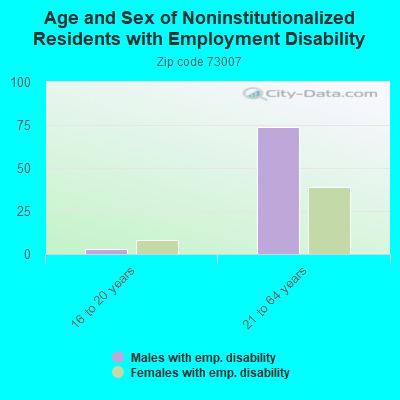
Males: 1,262
(52.9%)
Females: 1,123
(47.1%)
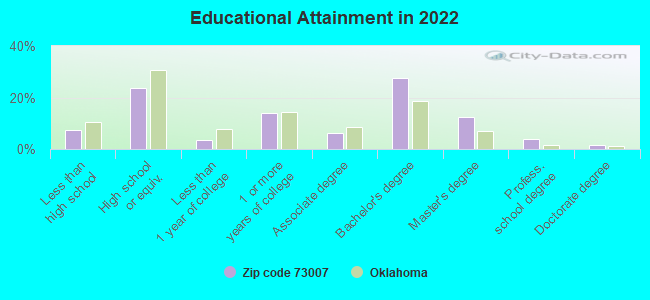
For population 25 years and over in 73007:
High school or higher: 92.9%
Bachelor's degree or higher: 45.3%
Graduate or professional degree: 17.8%
Unemployed: 2.2%
Mean travel time to work (commute): 29.0 minutes
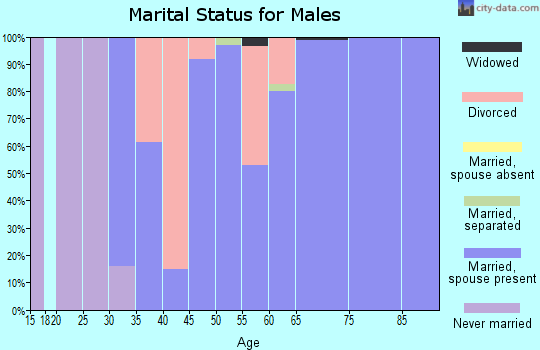
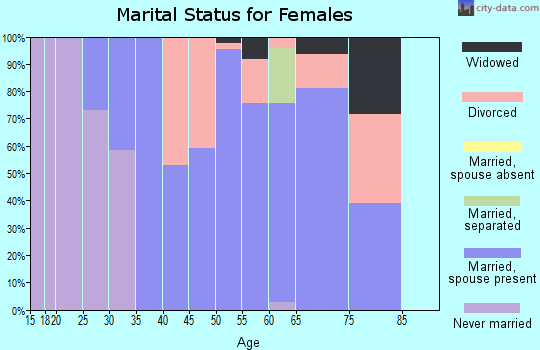
For population 15 years and over in 73007:
Never married: 20.8%
Now married: 68.2%
Separated: 0.9%
Widowed: 3.7%
Divorced: 6.4%
Zip code 73007 compared to state average:
Median household income above state average.
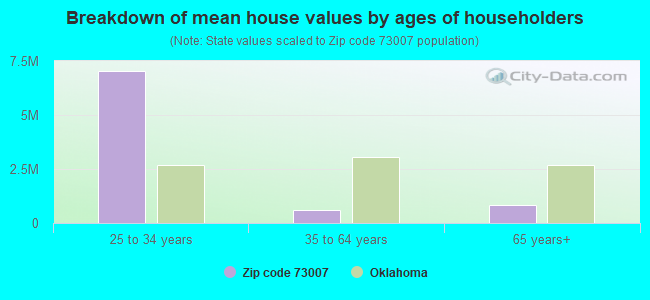
Median house value significantly above state average.
Unemployed percentage below state average.
Black race population percentage below state average.
Hispanic race population percentage significantly below state average.
Median age significantly above state average.
Foreign-born population percentage significantly below state average.
Renting percentage significantly below state average.
Length of stay since moving in above state average.
Number of rooms per house above state average.
House age significantly below state average.
Percentage of population with a bachelor's degree or higher above state average.
Averages for the 2020 tax year for zip code 73007, filed in 2021:
Average Adjusted Gross Income (AGI) in 2020: $183,331 (Individual Income Tax Returns)
Here:
$183,331
State:
$63,060
Salary/wage: $134,300 (reported on 81.9% of returns)
Here:
$134,300
State:
$52,427
(% of AGI for various income ranges: 1192.0% for AGIs below $25k, 3148.8% for AGIs $25k-50k, 6845.0% for AGIs $50k-75k, 9796.7% for AGIs $75k-100k, 18961.2% for AGIs $100k-200k, 97152.7% for AGIs over 200k)
Taxable interest for individuals: $2,767 (reported on 46.5% of returns)
This zip code:
$2,767
Oklahoma:
$1,603
(% of AGI for various income ranges: 11.6% for AGIs below $25k, 21.9% for AGIs $25k-50k, 36.2% for AGIs $50k-75k, 40.0% for AGIs $75k-100k, 185.9% for AGIs $100k-200k, 1291.8% for AGIs over 200k)
Ordinary dividends: $11,660 (reported on 31.2% of returns)
Here:
$11,660
State:
$7,001
(% of AGI for various income ranges: 47.6% for AGIs below $25k, 50.6% for AGIs $25k-50k, 196.2% for AGIs $50k-75k, 248.3% for AGIs $75k-100k, 405.3% for AGIs $100k-200k, 3683.6% for AGIs over 200k)
Net capital gain/loss in AGI: +$45,579 (reported on 32.6% of returns)
Here:
+$45,579
State:
+$19,855
(% of AGI for various income ranges: 33.2% for AGIs below $25k, 53.1% for AGIs $25k-50k, 450.0% for AGIs $75k-100k, 647.6% for AGIs $100k-200k, 18075.5% for AGIs over 200k)
Profit/loss from business: +$16,941 (reported on 23.6% of returns)
Here:
+$16,941
State:
+$9,904
(% of AGI for various income ranges: 146.8% for AGIs below $25k, 217.5% for AGIs $25k-50k, 545.0% for AGIs $50k-75k, 1010.0% for AGIs $75k-100k, 703.5% for AGIs $100k-200k, 2551.8% for AGIs over 200k)
Taxable individual retirement arrangement distribution: $27,736 (reported on 9.7% of returns)
73007:
$27,736
Oklahoma:
$20,476
(% of AGI for various income ranges: 213.1% for AGIs $25k-50k, 567.5% for AGIs $50k-75k, 670.0% for AGIs $100k-200k, 1771.8% for AGIs over 200k)
Total itemized deductions: $56,553 (reported on 25.0% of returns)
Here:
$56,553
State:
$39,736
(% of AGI for various income ranges: 1423.8% for AGIs $50k-75k, 1940.6% for AGIs $100k-200k, 14473.6% for AGIs over 200k)
Charity contributions: $32,263 (reported on 22.2% of returns)
Here:
$32,263
State:
$17,288
(% of AGI for various income ranges: 133.8% for AGIs $25k-50k, 509.4% for AGIs $100k-200k, 8403.6% for AGIs over 200k)
Taxes paid: $9,011 (reported on 25.0% of returns)
73007:
$9,011
State:
$7,046
(% of AGI for various income ranges: 281.2% for AGIs $50k-75k, 510.0% for AGIs $100k-200k, 1956.4% for AGIs over 200k)
Earned income credit: $2,400 (reported on 9.7% of returns)
Here:
$2,400
State:
$2,435
(% of AGI for various income ranges: 92.8% for AGIs below $25k, 65.0% for AGIs $25k-50k)
Percentage of individuals using paid preparers for their 2020 taxes: 91.0%
Here:
91%
State:
94%
(% for various income ranges: 89.2% for AGIs below $25k, 95.0% for AGIs $25k-50k, 84.6% for AGIs $50k-75k, 90.0% for AGIs $75k-100k, 90.0% for AGIs $100k-200k, 94.1% for AGIs over 200k)
Averages for the 2012 tax year for zip code 73007, filed in 2013:
Average Adjusted Gross Income (AGI) in 2012: $138,612 (Individual Income Tax Returns)
Here:
$138,612
State:
$58,581
Salary/wage: $106,473 (reported on 78.1% of returns)
Here:
$106,473
State:
$45,973
(% of AGI for various income ranges: 73.9% for AGIs below $25k, 70.4% for AGIs $25k-50k, 71.0% for AGIs $50k-75k, 72.6% for AGIs $75k-100k, 70.4% for AGIs $100k-200k, 55.1% for AGIs over 200k)
Taxable interest for individuals: $1,832 (reported on 41.7% of returns)
This zip code:
$1,832
Oklahoma:
$1,625
(% of AGI for various income ranges: 0.5% for AGIs below $25k, 0.9% for AGIs $25k-50k, 0.8% for AGIs $50k-75k, 0.5% for AGIs $75k-100k, 0.8% for AGIs $100k-200k, 0.5% for AGIs over 200k)
Ordinary dividends: $15,175 (reported on 25.0% of returns)
Here:
$15,175
State:
$6,374
(% of AGI for various income ranges: 2.0% for AGIs below $25k, 0.7% for AGIs $25k-50k, 2.1% for AGIs $50k-75k, 0.6% for AGIs $100k-200k, 3.6% for AGIs over 200k)
Net capital gain/loss in AGI: +$28,896 (reported on 24.0% of returns)
Here:
+$28,896
State:
+$24,023
(% of AGI for various income ranges: 4.3% for AGIs $25k-50k, 0.8% for AGIs $50k-75k, 2.9% for AGIs $100k-200k, 6.2% for AGIs over 200k)
Profit/loss from business: +$16,491 (reported on 24.0% of returns)
Here:
+$16,491
State:
+$11,913
(% of AGI for various income ranges: 11.5% for AGIs below $25k, 6.1% for AGIs $25k-50k, 10.2% for AGIs $50k-75k, 3.5% for AGIs $100k-200k, 1.8% for AGIs over 200k)
Taxable individual retirement arrangement distribution: $21,778 (reported on 9.4% of returns)
73007:
$21,778
Oklahoma:
$15,242
(% of AGI for various income ranges: 5.5% for AGIs $25k-50k, 5.0% for AGIs $100k-200k, 0.7% for AGIs over 200k)
Total itemized deductions: $39,640 (14% of AGI, reported on 41.7% of returns)
Here:
$39,640
State:
$24,882
Here:
13.8% of AGI
State:
18.8% of AGI
(% of AGI for various income ranges: 8.0% for AGIs below $25k, 11.8% for AGIs $25k-50k, 12.9% for AGIs $50k-75k, 15.9% for AGIs $75k-100k, 15.4% for AGIs $100k-200k, 11.1% for AGIs over 200k)
Charity contributions: $10,889 (reported on 37.5% of returns)
Here:
$10,889
State:
$6,591
(% of AGI for various income ranges: 2.6% for AGIs $25k-50k, 1.3% for AGIs $50k-75k, 4.3% for AGIs $75k-100k, 3.3% for AGIs $100k-200k, 3.0% for AGIs over 200k)
Taxes paid: $15,438 (reported on 41.7% of returns)
73007:
$15,438
State:
$7,196
(% of AGI for various income ranges: 1.8% for AGIs below $25k, 2.7% for AGIs $25k-50k, 2.5% for AGIs $50k-75k, 5.1% for AGIs $75k-100k, 5.2% for AGIs $100k-200k, 4.9% for AGIs over 200k)
Earned income credit: $2,015 (reported on 13.5% of returns)
Here:
$2,015
State:
$2,354
(% of AGI for various income ranges: 5.4% for AGIs below $25k, 0.9% for AGIs $25k-50k)
Percentage of individuals using paid preparers for their 2012 taxes: 58.3%
Here:
58%
State:
56%
(% for various income ranges: 46.9% for AGIs below $25k, 50.0% for AGIs $25k-50k, 60.0% for AGIs $50k-75k, 66.7% for AGIs $75k-100k, 64.3% for AGIs $100k-200k, 85.7% for AGIs over 200k)
Averages for the 2004 tax year for zip code 73007, filed in 2005:
Average Adjusted Gross Income (AGI) in 2004: $56,291 (Individual Income Tax Returns)
Here:
$56,291
State:
$41,245
Salary/wage: $45,379 (reported on 82.7% of returns)
Here:
$45,379
State:
$35,318
(% of AGI for various income ranges: 122.5% for AGIs below $10k, 77.8% for AGIs $10k-25k, 73.9% for AGIs $25k-50k, 74.5% for AGIs $50k-75k, 72.8% for AGIs $75k-100k, 58.3% for AGIs over 100k)
Taxable interest for individuals: $1,082 (reported on 47.0% of returns)
This zip code:
$1,082
Oklahoma:
$1,745
(% of AGI for various income ranges: 5.2% for AGIs below $10k, 1.8% for AGIs $10k-25k, 1.8% for AGIs $25k-50k, 1.1% for AGIs $50k-75k, 0.7% for AGIs $75k-100k, 0.4% for AGIs over 100k)
Taxable dividends: $1,551 (reported on 23.1% of returns)
Here:
$1,551
State:
$2,920
(% of AGI for various income ranges: 1.3% for AGIs below $10k, 0.3% for AGIs $10k-25k, 1.3% for AGIs $25k-50k, 0.5% for AGIs $50k-75k, 0.9% for AGIs $75k-100k, 0.4% for AGIs over 100k)
Net capital gain/loss: +$2,242 (reported on 20.6% of returns)
Here:
+$2,242
State:
+$10,653
(% of AGI for various income ranges: -0.6% for AGIs below $10k, 0.3% for AGIs $10k-25k, -0.2% for AGIs $25k-50k, -0.3% for AGIs $50k-75k, 1.2% for AGIs $75k-100k, 1.4% for AGIs over 100k)
Profit/loss from business: +$10,453 (reported on 22.2% of returns)
Here:
+$10,453
State:
+$8,532
(% of AGI for various income ranges: 4.5% for AGIs below $10k, 7.0% for AGIs $10k-25k, 3.5% for AGIs $25k-50k, 7.2% for AGIs $50k-75k, 2.4% for AGIs $75k-100k, 3.5% for AGIs over 100k)
IRA payment deduction: $1,947 (reported on 2.6% of returns)
73007:
$1,947
Oklahoma:
$3,127
Total itemized deductions: $21,972 (20% of AGI, reported on 39.1% of returns)
Here:
$21,972
State:
$17,093
Here:
20.0% of AGI
State:
20.5% of AGI
(% of AGI for various income ranges: 10.5% for AGIs $10k-25k, 13.0% for AGIs $25k-50k, 16.5% for AGIs $50k-75k, 18.3% for AGIs $75k-100k, 15.9% for AGIs over 100k)
Charity contributions deductions: $6,678 (6% of AGI, reported on 33.4% of returns)
Here:
$6,678
State:
$4,240
Here:
5.6% of AGI
State:
4.8% of AGI
(% of AGI for various income ranges: 1.3% for AGIs $10k-25k, 2.0% for AGIs $25k-50k, 2.7% for AGIs $50k-75k, 2.9% for AGIs $75k-100k, 5.6% for AGIs over 100k)
Total tax: $10,254 (reported on 75.7% of returns)
73007:
$10,254
State:
$6,542
(% of AGI for various income ranges: 2.8% for AGIs below $10k, 4.5% for AGIs $10k-25k, 6.6% for AGIs $25k-50k, 9.9% for AGIs $50k-75k, 10.7% for AGIs $75k-100k, 19.2% for AGIs over 100k)
Earned income credit: $1,746 (reported on 15.7% of returns)
Here:
$1,746
State:
$1,830
Percentage of individuals using paid preparers for their 2004 taxes: 61.7%
Here:
62%
State:
63%
(% for various income ranges: 56.5% for AGIs below $10k, 61.6% for AGIs $10k-25k, 59.3% for AGIs $25k-50k, 62.1% for AGIs $50k-75k, 67.3% for AGIs $75k-100k, 71.1% for AGIs over 100k)
Household received Food Stamps/SNAP in the past 12 months: 98 Household did not receive Food Stamps/SNAP in the past 12 months: 927
Women who had a birth in the past 12 months: 15 (15 now married, 0 unmarried) Women who did not have a birth in the past 12 months: 438 (272 now married, 166 unmarried)
Housing units in zip code 73007 with a mortgage: 477 (31 second mortgage, 32 both second mortgage and home equity loan) Houses without a mortgage: 7
Median monthly owner costs for units with a mortgage: $3,309 Median monthly owner costs for units without a mortgage: $668
Residents with income below the poverty level in 2022:
This zip code:
5.5%
Whole state:
15.7%
Residents with income below 50% of the poverty level in 2022:
This zip code:
0.6%
Whole state:
8.3%
Median number of rooms in houses and condos:
Here:
7.5
State:
6.1
Median number of rooms in apartments:
Here:
4.5
State:
4.5
Notable locations in this zip code not listed on our city pages
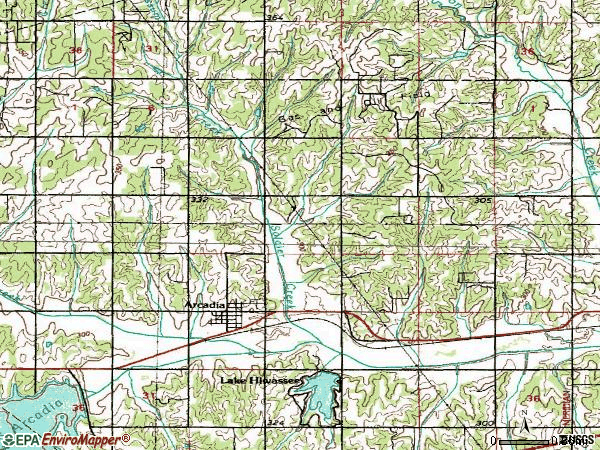
Cemeteries: Gower Cemetery (1), Tudor Cemetery (2), Arcadia Independent Order of Odd fellows Cemetery (3), Spigener Cemetery (4), Donnell Cemetery (5). Display/hide their locations on the map
Reservoirs: Lake Hiwassee (A), Bear Fall Coon Creek Site 31 Reservoir (B), Oknoname 083005 Reservoir (C), Oknoname 083006 Reservoir (D), Lake Arcadia (E). Display/hide their locations on the map
Size of family households: 496 2-persons, 121 3-persons, 37 4-persons, 122 5-persons, 10 6-persons, 2 7-or-more-persons
Size of nonfamily households: 219 1-person, 19 2-persons
367 married couples with children.
13 single-parent households (10 men, 3 women).
93.8% of residents of 73007 zip code speak English at home.
1.3% of residents speak Spanish at home (47% very well, 53% well).
1.0% of residents speak Asian or Pacific Island language at home (67% very well, 33% well).
3.6% of residents speak other language at home (100% very well).
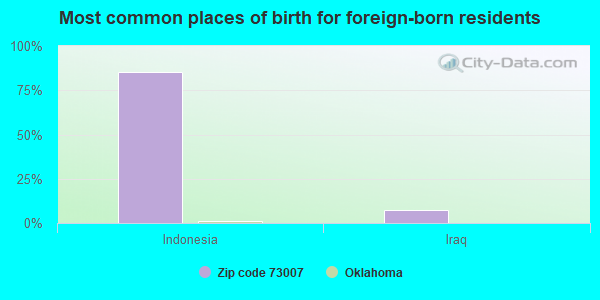
Foreign born population: 27 (1.2%) (57.3% of them are naturalized citizens)
This zip code:
1.2%
Whole state:
6.0%
85%Indonesia
7%Iraq
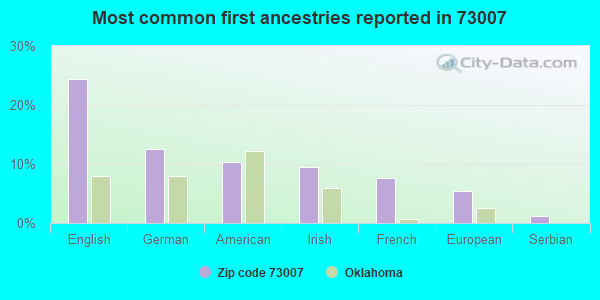
24%English
13%German
10%American
9%Irish
8%French
5%European
1%Serbian
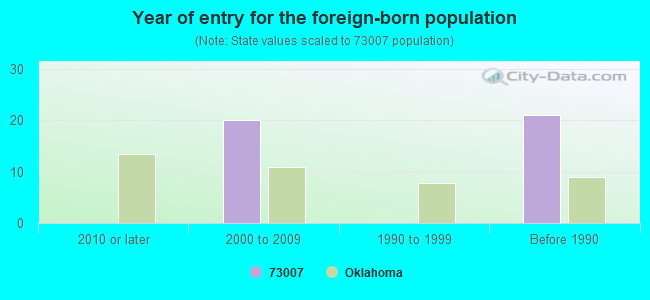
Year of entry for the foreign-born population
02010 or later
202000 to 2009
01990 to 1999
21Before 1990
Housing units lacking complete plumbing facilities: 0.4% Housing units lacking complete kitchen facilities: 0.3%
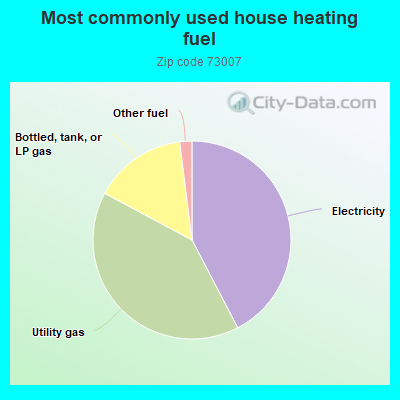
42.4%Electricity
40.5%Utility gas
15.2%Bottled, tank, or LP gas
2.0%Other fuel
Population in 1990: 697. Population change in the 1990s: +921 (+132.1%).
Place of birth for U.S.-born residents:
This state: 1,298
Northeast: 94
Midwest: 358
South: 307
West: 292
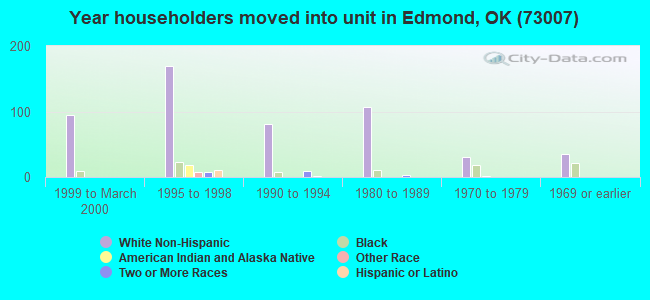
50% of the 73007 zip code residents lived in the same house 5 years ago. Out of people who lived in different houses, 43% lived in this county. Out of people who lived in different counties, 50% lived in Oklahoma.
78% of the 73007 zip code residents lived in the same house 1 year ago. Out of people who lived in different houses, 12% moved from this county. Out of people who lived in different houses, 88% moved from different county within same state. Out of people who lived in different houses, 1% moved from different state.
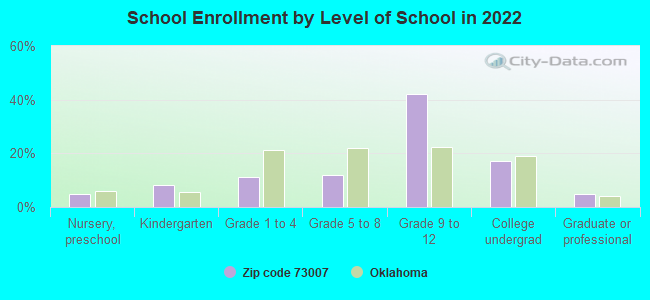
Private vs. public school enrollment:
Students in private schools in grades 1 to 8 (elementary and middle school): 92
Here:
75.9%
Oklahoma:
11.7%
Students in private schools in grades 9 to 12 (high school): 35
Here:
16.6%
Oklahoma:
11.7%
Students in private undergraduate colleges: 10
Here:
12.0%
Oklahoma:
19.3%
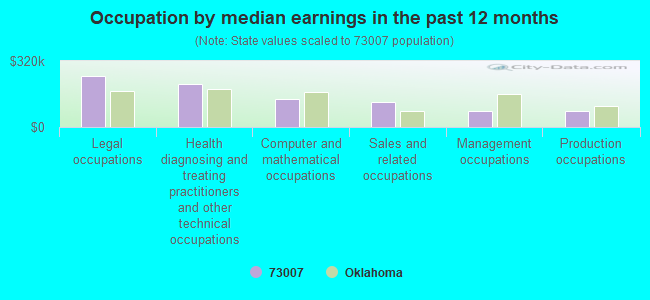
Occupation by median earnings in the past 12 months ($)
247,132Legal occupations
209,085Health diagnosing and treating practitioners and other technical occupations
136,599Computer and mathematical occupations
119,895Sales and related occupations
78,776Management occupations
75,395Production occupations
Companies with federal contracts located in this zip code:
GRIFFIN, R SCOTT (11900 E SORGHUM MILL RD in ARCADIA, OK; small business)
$42,383 with Army for Hand Tools, Power Driven. Signed on 2003-05-28. Completion date: 2003-08-26.
Top industries in this zip code by the number of employees in 2005:
Health Care and Social Assistance: Residential Mental Health and Substance Abuse Facilities (20-49 employees: 1 establishment)
Construction: Drywall and Insulation Contractors (20-49: 1)
Administrative and Support and Waste Management and Remediation Services: Janitorial Services (10-19: 1, 5-9: 1)
Construction: Poured Concrete Foundation and Structure Contractors (10-19: 1)
Other Services (except Public Administration): General Automotive Repair (10-19: 1)
Accommodation and Food Services: Full-Service Restaurants (5-9: 1)
Wholesale Trade: Wholesale Trade Agents and Brokers (5-9: 1)
Construction: New Single-Family Housing Construction (except Operative Builders) (1-4: 3)
Administrative and Support and Waste Management and Remediation Services: Landscaping Services (1-4: 2)
People in group quarters in 2000:
29 people in homes or halfway houses for drug/alcohol abuse
Fatal accident statistics in 2012:
Fatal accident count: 1
Vehicles involved in fatal accidents: 1
Fatal accidents caused by drunken drivers: 1
Fatalities: 1
Persons involved in fatal accidents: 2
Pedestrians involved in fatal accidents: 0
Fatal accident statistics in 2010:
Fatal accident count: 1
Vehicles involved in fatal accidents: 1
Fatal accidents caused by drunken drivers: 1
Fatalities: 1
Persons involved in fatal accidents: 2
Pedestrians involved in fatal accidents: 0
Home Mortgage Disclosure Act Aggregated Statistics For Year 2009 (Based on 2 partial tracts)
A) FHA, FSA/RHS & VA Home Purchase Loans
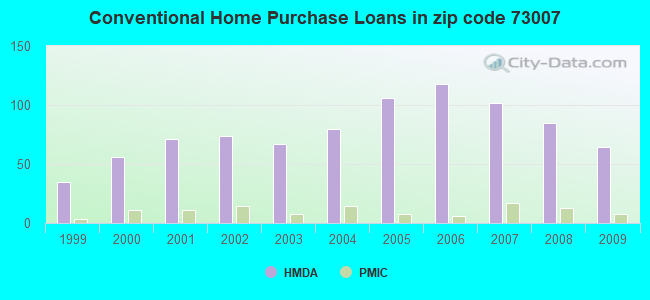
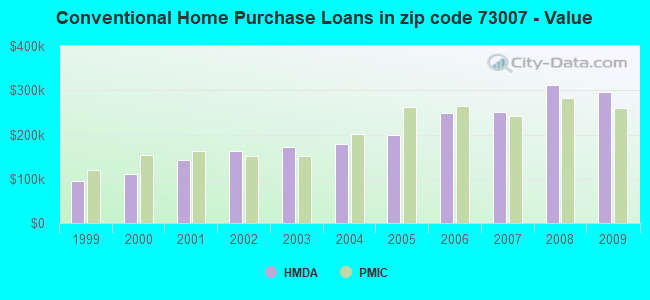
B) Conventional Home Purchase Loans
C) Refinancings
D) Home Improvement Loans
F) Non-occupant Loans on < 5 Family Dwellings (A B C & D)
G) Loans On Manufactured Home Dwelling (A B C & D)
Number
Average Value
Number
Average Value
Number
Average Value
Number
Average Value
Number
Average Value
Number
Average Value
LOANS ORIGINATED
12
$201,092
64
$296,400
187
$279,649
16
$83,422
11
$491,146
8
$74,515
APPLICATIONS APPROVED, NOT ACCEPTED
2
$140,280
3
$285,443
8
$274,600
3
$121,940
1
$226,490
2
$39,445
APPLICATIONS DENIED
6
$235,712
8
$192,610
52
$242,319
10
$72,018
3
$96,703
6
$84,720
APPLICATIONS WITHDRAWN
1
$121,510
7
$283,654
29
$277,208
2
$38,170
0
$0
4
$99,088
FILES CLOSED FOR INCOMPLETENESS
0
$0
1
$98,610
13
$139,817
1
$303,470
0
$0
0
$0
Aggregated Statistics For Year 2008 (Based on 2 partial tracts)
A) FHA, FSA/RHS & VA Home Purchase Loans
B) Conventional Home Purchase Loans
C) Refinancings
D) Home Improvement Loans
F) Non-occupant Loans on < 5 Family Dwellings (A B C & D)
G) Loans On Manufactured Home Dwelling (A B C & D)
Number
Average Value
Number
Average Value
Number
Average Value
Number
Average Value
Number
Average Value
Number
Average Value
LOANS ORIGINATED
7
$154,233
85
$310,990
88
$235,047
18
$60,333
15
$350,504
13
$67,584
APPLICATIONS APPROVED, NOT ACCEPTED
0
$0
9
$229,880
7
$268,294
1
$108,150
0
$0
2
$57,260
APPLICATIONS DENIED
1
$73,160
16
$199,409
44
$259,440
11
$78,368
2
$42,945
10
$58,340
APPLICATIONS WITHDRAWN
0
$0
11
$374,028
21
$179,015
3
$176,017
1
$84,610
2
$35,945
FILES CLOSED FOR INCOMPLETENESS
0
$0
1
$47,710
4
$219,808
1
$90,340
0
$0
1
$97,340
Aggregated Statistics For Year 2007 (Based on 2 partial tracts)
A) FHA, FSA/RHS & VA Home Purchase Loans
B) Conventional Home Purchase Loans
C) Refinancings
D) Home Improvement Loans
F) Non-occupant Loans on < 5 Family Dwellings (A B C & D)
G) Loans On Manufactured Home Dwelling (A B C & D)
Number
Average Value
Number
Average Value
Number
Average Value
Number
Average Value
Number
Average Value
Number
Average Value
LOANS ORIGINATED
6
$120,453
102
$249,921
90
$220,507
27
$67,814
15
$196,713
18
$52,946
APPLICATIONS APPROVED, NOT ACCEPTED
0
$0
9
$297,318
8
$276,748
3
$69,133
0
$0
4
$134,558
APPLICATIONS DENIED
3
$82,707
10
$128,958
45
$189,559
15
$33,931
3
$84,190
11
$80,797
APPLICATIONS WITHDRAWN
0
$0
8
$189,508
19
$241,287
4
$160,958
2
$80,160
2
$55,030
FILES CLOSED FOR INCOMPLETENESS
1
$232,850
4
$215,352
5
$179,790
1
$190,860
1
$94,160
0
$0
Aggregated Statistics For Year 2006 (Based on 2 partial tracts)
A) FHA, FSA/RHS & VA Home Purchase Loans
B) Conventional Home Purchase Loans
C) Refinancings
D) Home Improvement Loans
F) Non-occupant Loans on < 5 Family Dwellings (A B C & D)
G) Loans On Manufactured Home Dwelling (A B C & D)
Number
Average Value
Number
Average Value
Number
Average Value
Number
Average Value
Number
Average Value
Number
Average Value
LOANS ORIGINATED
4
$147,598
118
$248,916
107
$208,573
21
$52,562
12
$205,652
10
$62,157
APPLICATIONS APPROVED, NOT ACCEPTED
1
$49,620
20
$210,868
11
$147,772
3
$74,010
1
$6,360
6
$58,848
APPLICATIONS DENIED
1
$122,790
14
$219,534
60
$156,388
20
$33,368
4
$215,352
15
$51,065
APPLICATIONS WITHDRAWN
1
$32,450
11
$213,011
25
$147,649
3
$60,013
2
$188,635
3
$44,533
FILES CLOSED FOR INCOMPLETENESS
0
$0
6
$232,532
9
$192,557
3
$82,283
1
$257,020
0
$0
Aggregated Statistics For Year 2005 (Based on 2 partial tracts)
A) FHA, FSA/RHS & VA Home Purchase Loans
B) Conventional Home Purchase Loans
C) Refinancings
D) Home Improvement Loans
F) Non-occupant Loans on < 5 Family Dwellings (A B C & D)
G) Loans On Manufactured Home Dwelling (A B C & D)
Number
Average Value
Number
Average Value
Number
Average Value
Number
Average Value
Number
Average Value
Number
Average Value
LOANS ORIGINATED
11
$111,277
106
$199,473
96
$170,190
22
$79,583
15
$127,240
10
$80,161
APPLICATIONS APPROVED, NOT ACCEPTED
1
$147,600
11
$125,389
13
$194,531
2
$27,040
1
$108,790
6
$73,375
APPLICATIONS DENIED
1
$48,350
22
$106,621
48
$138,493
15
$58,445
3
$48,987
14
$56,031
APPLICATIONS WITHDRAWN
0
$0
11
$191,670
40
$127,288
6
$109,638
1
$180,680
1
$61,710
FILES CLOSED FOR INCOMPLETENESS
1
$43,900
5
$224,196
10
$198,494
0
$0
0
$0
0
$0
Aggregated Statistics For Year 2004 (Based on 2 partial tracts)
A) FHA, FSA/RHS & VA Home Purchase Loans
B) Conventional Home Purchase Loans
C) Refinancings
D) Home Improvement Loans
F) Non-occupant Loans on < 5 Family Dwellings (A B C & D)
G) Loans On Manufactured Home Dwelling (A B C & D)
Number
Average Value
Number
Average Value
Number
Average Value
Number
Average Value
Number
Average Value
Number
Average Value
LOANS ORIGINATED
4
$108,312
80
$179,082
118
$166,604
19
$34,723
5
$154,724
12
$51,532
APPLICATIONS APPROVED, NOT ACCEPTED
0
$0
11
$175,938
18
$149,754
3
$32,233
1
$31,170
4
$54,555
APPLICATIONS DENIED
1
$99,880
17
$77,504
46
$149,217
15
$45,128
8
$36,740
17
$54,751
APPLICATIONS WITHDRAWN
0
$0
8
$159,368
33
$133,949
4
$143,145
0
$0
2
$77,935
FILES CLOSED FOR INCOMPLETENESS
0
$0
3
$111,970
8
$185,770
1
$63,620
1
$48,350
0
$0
Aggregated Statistics For Year 2003 (Based on 2 partial tracts)
A) FHA, FSA/RHS & VA Home Purchase Loans
B) Conventional Home Purchase Loans
C) Refinancings
D) Home Improvement Loans
F) Non-occupant Loans on < 5 Family Dwellings (A B C & D)
Number
Average Value
Number
Average Value
Number
Average Value
Number
Average Value
Number
Average Value
LOANS ORIGINATED
7
$87,069
67
$172,363
187
$177,180
16
$46,920
7
$67,891
APPLICATIONS APPROVED, NOT ACCEPTED
0
$0
14
$103,519
19
$169,397
0
$0
1
$50,900
APPLICATIONS DENIED
1
$85,250
19
$95,531
57
$125,030
4
$17,812
4
$49,148
APPLICATIONS WITHDRAWN
0
$0
6
$183,543
29
$192,856
1
$19,720
1
$73,160
FILES CLOSED FOR INCOMPLETENESS
0
$0
6
$132,223
13
$192,182
0
$0
1
$22,270
Aggregated Statistics For Year 2002 (Based on 2 partial tracts)
A) FHA, FSA/RHS & VA Home Purchase Loans
B) Conventional Home Purchase Loans
C) Refinancings
D) Home Improvement Loans
F) Non-occupant Loans on < 5 Family Dwellings (A B C & D)
Number
Average Value
Number
Average Value
Number
Average Value
Number
Average Value
Number
Average Value
LOANS ORIGINATED
4
$127,080
74
$162,979
152
$168,786
17
$33,008
9
$105,043
APPLICATIONS APPROVED, NOT ACCEPTED
0
$0
9
$158,697
24
$140,918
4
$26,880
2
$28,945
APPLICATIONS DENIED
0
$0
18
$108,790
33
$106,650
7
$22,903
4
$42,942
APPLICATIONS WITHDRAWN
1
$53,440
6
$155,657
22
$172,208
0
$0
1
$103,060
FILES CLOSED FOR INCOMPLETENESS
0
$0
1
$125,330
16
$170,979
0
$0
0
$0
Aggregated Statistics For Year 2001 (Based on 2 partial tracts)
A) FHA, FSA/RHS & VA Home Purchase Loans
B) Conventional Home Purchase Loans
C) Refinancings
D) Home Improvement Loans
E) Loans on Dwellings For 5+ Families
F) Non-occupant Loans on < 5 Family Dwellings (A B C & D)
Number
Average Value
Number
Average Value
Number
Average Value
Number
Average Value
Number
Average Value
Number
Average Value
LOANS ORIGINATED
4
$85,250
71
$143,387
131
$155,505
19
$37,603
1
$11,450
10
$135,892
APPLICATIONS APPROVED, NOT ACCEPTED
0
$0
12
$132,912
13
$175,395
4
$48,192
0
$0
4
$112,768
APPLICATIONS DENIED
1
$130,420
31
$46,648
52
$132,305
8
$25,925
0
$0
4
$182,112
APPLICATIONS WITHDRAWN
1
$33,720
4
$166,208
27
$118,404
6
$37,748
0
$0
4
$46,442
FILES CLOSED FOR INCOMPLETENESS
0
$0
1
$190,860
8
$168,911
0
$0
0
$0
0
$0
Aggregated Statistics For Year 2000 (Based on 2 partial tracts)
A) FHA, FSA/RHS & VA Home Purchase Loans
B) Conventional Home Purchase Loans
C) Refinancings
D) Home Improvement Loans
F) Non-occupant Loans on < 5 Family Dwellings (A B C & D)
Number
Average Value
Number
Average Value
Number
Average Value
Number
Average Value
Number
Average Value
LOANS ORIGINATED
1
$76,340
56
$111,221
45
$135,751
17
$25,149
8
$64,892
APPLICATIONS APPROVED, NOT ACCEPTED
1
$39,440
18
$52,593
8
$99,089
3
$38,807
3
$29,690
APPLICATIONS DENIED
1
$24,180
36
$45,294
35
$77,144
7
$9,543
6
$51,957
APPLICATIONS WITHDRAWN
1
$62,350
2
$57,260
21
$122,938
1
$11,450
1
$33,080
FILES CLOSED FOR INCOMPLETENESS
0
$0
1
$149,510
6
$103,488
0
$0
1
$54,080
Aggregated Statistics For Year 1999 (Based on 1 partial tract)
A) FHA, FSA/RHS & VA Home Purchase Loans
B) Conventional Home Purchase Loans
C) Refinancings
D) Home Improvement Loans
F) Non-occupant Loans on < 5 Family Dwellings (A B C & D)
Detailed PMIC statistics for the following Tracts:1081.03
2002 - 2018 National Fire Incident Reporting System (NFIRS) incidents
According to the data from the years 2002 - 2018 the average number of fire incidents per year is 14. The highest number of fires - 27 took place in 2006, and the least - 5 in 2002. The data has a rising trend.
When looking into fire subcategories, the most incidents belonged to: Outside Fires (70.6%), and Structure Fires (18.2%).
Fire incident types reported to NFIRS in Zip Code 73007


 Nearest zip codes: 73049, 73034, 73054, 73151, 73084, 73058.
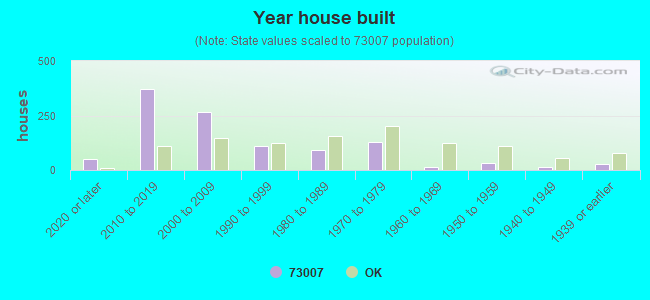


 According to the data from the years 2002 - 2018 the average number of fire incidents per year is 14. The highest number of fires - 27 took place in 2006, and the least - 5 in 2002. The data has a rising trend.
 When looking into fire subcategories, the most incidents belonged to: Outside Fires (70.6%), and Structure Fires (18.2%).