Estimated zip code population in 2022: 47,331 Zip code population in 2010: 39,872 Zip code population in 2000: 30,574
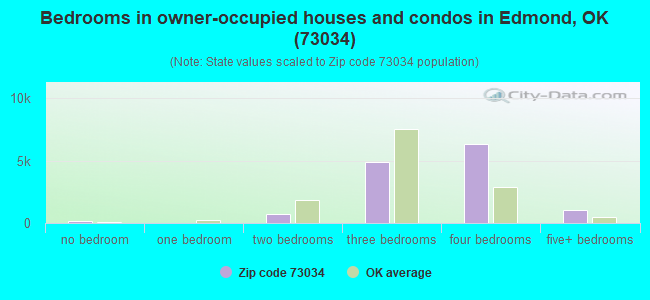
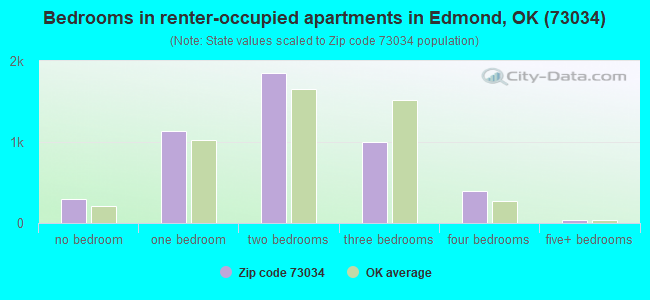
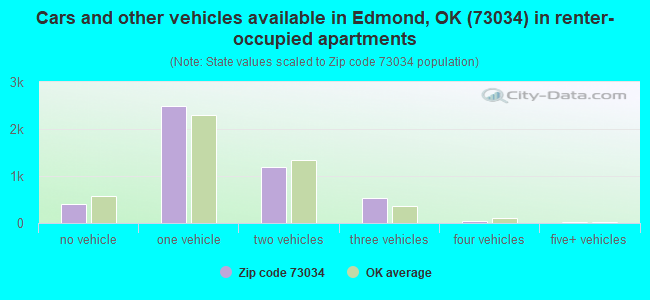
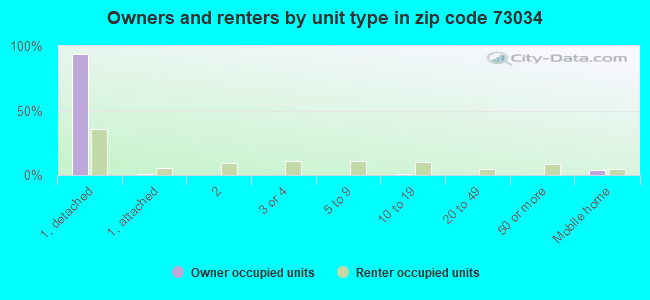
Houses and condos: 18,491 Renter-occupied apartments: 4,703
% of renters here:
27%
State:
35%
March 2022 cost of living index in zip code 73034: 86.4 (less than average, U.S. average is 100)
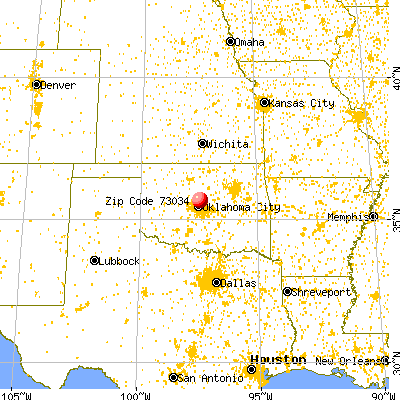
Land area: 54.2 sq. mi. Water area: 2.5 sq. mi.
Population density: 874 people per square mile
(low).
OSM Map
General Map
Google Map
MSN Map
OSM Map
General Map
Google Map
MSN Map
OSM Map
General Map
Google Map
MSN Map
OSM Map
General Map
Google Map
MSN Map
Please wait while loading the map...
Real estate property taxes paid for housing units in 2022:
This zip code:
0.9% ($3,626)
Oklahoma:
0.8% ($1,501)
Median real estate property taxes paid for housing units with mortgages in 2022: $3,734 (0.9%) Median real estate property taxes paid for housing units with no mortgage in 2022: $3,308 (0.9%)
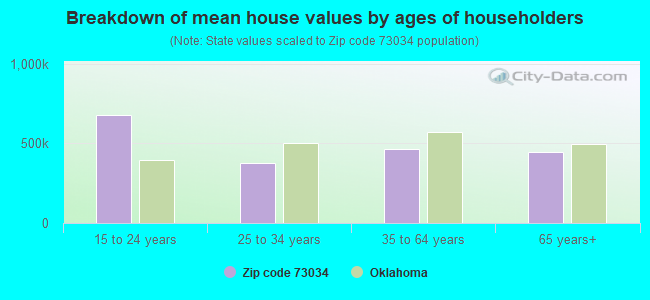
Estimated median house/condo value in 2022: $402,964
73034:
$402,964
Oklahoma:
$191,700
According to our research of Oklahoma and other state lists, there were 63 registered sex offenders living in 73034 zip code as of April 27, 2024. The ratio of all residents to sex offenders in zip code 73034 is 725 to 1. The ratio of registered sex offenders to all residents in this zip code is lower than the state average.
Median resident age:
This zip code:
36.0 years
Oklahoma median age:
37.1 years
Average household size:
This zip code:
2.6 people
Oklahoma:
2.5 people
Averages for the 2020 tax year for zip code 73034, filed in 2021:
Average Adjusted Gross Income (AGI) in 2020: $113,153 (Individual Income Tax Returns)
Here:
$113,153
State:
$63,060
Salary/wage: $91,495 (reported on 80.8% of returns)
Here:
$91,495
State:
$52,427
(% of AGI for various income ranges: 1131.0% for AGIs below $25k, 3440.7% for AGIs $25k-50k, 6082.7% for AGIs $50k-75k, 8833.4% for AGIs $75k-100k, 17748.9% for AGIs $100k-200k, 69569.4% for AGIs over 200k)
Taxable interest for individuals: $1,958 (reported on 43.1% of returns)
This zip code:
$1,958
Oklahoma:
$1,603
(% of AGI for various income ranges: 19.6% for AGIs below $25k, 36.4% for AGIs $25k-50k, 99.9% for AGIs $50k-75k, 120.0% for AGIs $75k-100k, 173.5% for AGIs $100k-200k, 780.6% for AGIs over 200k)
Ordinary dividends: $6,940 (reported on 28.9% of returns)
Here:
$6,940
State:
$7,001
(% of AGI for various income ranges: 33.2% for AGIs below $25k, 61.1% for AGIs $25k-50k, 171.3% for AGIs $50k-75k, 283.5% for AGIs $75k-100k, 443.4% for AGIs $100k-200k, 1996.9% for AGIs over 200k)
Net capital gain/loss in AGI: +$22,008 (reported on 28.1% of returns)
Here:
+$22,008
State:
+$19,855
(% of AGI for various income ranges: 13.9% for AGIs below $25k, 55.7% for AGIs $25k-50k, 136.1% for AGIs $50k-75k, 275.6% for AGIs $75k-100k, 645.0% for AGIs $100k-200k, 9693.9% for AGIs over 200k)
Profit/loss from business: +$15,546 (reported on 21.3% of returns)
Here:
+$15,546
State:
+$9,904
(% of AGI for various income ranges: 119.2% for AGIs below $25k, 162.1% for AGIs $25k-50k, 280.3% for AGIs $50k-75k, 489.0% for AGIs $75k-100k, 764.2% for AGIs $100k-200k, 2783.6% for AGIs over 200k)
Taxable individual retirement arrangement distribution: $28,773 (reported on 12.0% of returns)
73034:
$28,773
Oklahoma:
$20,476
(% of AGI for various income ranges: 49.6% for AGIs below $25k, 164.3% for AGIs $25k-50k, 343.3% for AGIs $50k-75k, 571.7% for AGIs $75k-100k, 1109.3% for AGIs $100k-200k, 2320.2% for AGIs over 200k)
Self-employed (Keogh) retirement plans: $20,725 (reported on 0.8% of returns)
73034:
$20,725
Oklahoma:
$23,482
(% of AGI for various income ranges: 7.4% for AGIs $25k-50k, 28.4% for AGIs $100k-200k, 221.6% for AGIs over 200k)
Total itemized deductions: $43,974 (reported on 17.1% of returns)
Here:
$43,974
State:
$39,736
(% of AGI for various income ranges: 60.4% for AGIs below $25k, 201.3% for AGIs $25k-50k, 453.7% for AGIs $50k-75k, 722.1% for AGIs $75k-100k, 1564.5% for AGIs $100k-200k, 8651.3% for AGIs over 200k)
Charity contributions: $21,825 (reported on 14.9% of returns)
Here:
$21,825
State:
$17,288
(% of AGI for various income ranges: 4.2% for AGIs below $25k, 28.6% for AGIs $25k-50k, 95.5% for AGIs $50k-75k, 180.3% for AGIs $75k-100k, 475.5% for AGIs $100k-200k, 4738.5% for AGIs over 200k)
Taxes paid: $8,385 (reported on 16.9% of returns)
73034:
$8,385
State:
$7,046
(% of AGI for various income ranges: 8.0% for AGIs below $25k, 26.4% for AGIs $25k-50k, 77.4% for AGIs $50k-75k, 177.2% for AGIs $75k-100k, 407.5% for AGIs $100k-200k, 1377.8% for AGIs over 200k)
Earned income credit: $2,092 (reported on 9.7% of returns)
Here:
$2,092
State:
$2,435
(% of AGI for various income ranges: 60.0% for AGIs below $25k, 58.0% for AGIs $25k-50k, 1.3% for AGIs $50k-75k)
Percentage of individuals using paid preparers for their 2020 taxes: 92.5%
Here:
92%
State:
94%
(% for various income ranges: 91.2% for AGIs below $25k, 93.1% for AGIs $25k-50k, 91.4% for AGIs $50k-75k, 92.0% for AGIs $75k-100k, 93.0% for AGIs $100k-200k, 94.5% for AGIs over 200k)
Averages for the 2012 tax year for zip code 73034, filed in 2013:
Average Adjusted Gross Income (AGI) in 2012: $108,655 (Individual Income Tax Returns)
Here:
$108,655
State:
$58,581
Salary/wage: $82,649 (reported on 84.8% of returns)
Here:
$82,649
State:
$45,973
(% of AGI for various income ranges: 79.9% for AGIs below $25k, 75.6% for AGIs $25k-50k, 68.5% for AGIs $50k-75k, 68.6% for AGIs $75k-100k, 74.9% for AGIs $100k-200k, 56.3% for AGIs over 200k)
Taxable interest for individuals: $2,069 (reported on 44.8% of returns)
This zip code:
$2,069
Oklahoma:
$1,625
(% of AGI for various income ranges: 1.2% for AGIs below $25k, 1.0% for AGIs $25k-50k, 1.3% for AGIs $50k-75k, 0.9% for AGIs $75k-100k, 0.5% for AGIs $100k-200k, 0.9% for AGIs over 200k)
Ordinary dividends: $5,727 (reported on 28.8% of returns)
Here:
$5,727
State:
$6,374
(% of AGI for various income ranges: 1.6% for AGIs below $25k, 1.3% for AGIs $25k-50k, 1.7% for AGIs $50k-75k, 1.4% for AGIs $75k-100k, 1.2% for AGIs $100k-200k, 1.7% for AGIs over 200k)
Net capital gain/loss in AGI: +$31,019 (reported on 25.2% of returns)
Here:
+$31,019
State:
+$24,023
(% of AGI for various income ranges: 0.4% for AGIs $25k-50k, 0.7% for AGIs $50k-75k, 1.0% for AGIs $75k-100k, 1.2% for AGIs $100k-200k, 12.8% for AGIs over 200k)
Profit/loss from business: +$20,968 (reported on 20.0% of returns)
Here:
+$20,968
State:
+$11,913
(% of AGI for various income ranges: 7.1% for AGIs below $25k, 4.8% for AGIs $25k-50k, 4.5% for AGIs $50k-75k, 3.5% for AGIs $75k-100k, 4.3% for AGIs $100k-200k, 3.3% for AGIs over 200k)
Taxable individual retirement arrangement distribution: $19,542 (reported on 11.3% of returns)
73034:
$19,542
Oklahoma:
$15,242
(% of AGI for various income ranges: 2.2% for AGIs below $25k, 2.6% for AGIs $25k-50k, 3.2% for AGIs $50k-75k, 3.3% for AGIs $75k-100k, 2.8% for AGIs $100k-200k, 1.3% for AGIs over 200k)
Self-employment retirement plans: $21,500 (reported on 1.1% of returns)
73034:
$21,500
Oklahoma:
$20,266
(% of AGI for various income ranges: 0.2% for AGIs $50k-75k, 0.2% for AGIs $100k-200k, 0.3% for AGIs over 200k)
Total itemized deductions: $29,912 (15% of AGI, reported on 45.9% of returns)
Here:
$29,912
State:
$24,882
Here:
15.1% of AGI
State:
18.8% of AGI
(% of AGI for various income ranges: 9.2% for AGIs below $25k, 11.8% for AGIs $25k-50k, 15.0% for AGIs $50k-75k, 15.5% for AGIs $75k-100k, 15.2% for AGIs $100k-200k, 11.1% for AGIs over 200k)
Charity contributions: $8,183 (reported on 40.6% of returns)
Here:
$8,183
State:
$6,591
(% of AGI for various income ranges: 0.9% for AGIs below $25k, 1.7% for AGIs $25k-50k, 2.8% for AGIs $50k-75k, 3.3% for AGIs $75k-100k, 3.1% for AGIs $100k-200k, 3.3% for AGIs over 200k)
Taxes paid: $11,157 (reported on 45.8% of returns)
73034:
$11,157
State:
$7,196
(% of AGI for various income ranges: 1.3% for AGIs below $25k, 2.3% for AGIs $25k-50k, 3.6% for AGIs $50k-75k, 4.3% for AGIs $75k-100k, 5.4% for AGIs $100k-200k, 5.0% for AGIs over 200k)
Earned income credit: $1,971 (reported on 10.3% of returns)
Here:
$1,971
State:
$2,354
(% of AGI for various income ranges: 4.1% for AGIs below $25k, 0.9% for AGIs $25k-50k)
Percentage of individuals using paid preparers for their 2012 taxes: 52.6%
Here:
53%
State:
56%
(% for various income ranges: 42.5% for AGIs below $25k, 49.3% for AGIs $25k-50k, 55.7% for AGIs $50k-75k, 55.8% for AGIs $75k-100k, 57.3% for AGIs $100k-200k, 71.9% for AGIs over 200k)
Averages for the 2004 tax year for zip code 73034, filed in 2005:
Average Adjusted Gross Income (AGI) in 2004: $70,389 (Individual Income Tax Returns)
Here:
$70,389
State:
$41,245
Salary/wage: $59,254 (reported on 85.3% of returns)
Here:
$59,254
State:
$35,318
(% of AGI for various income ranges: 147.7% for AGIs below $10k, 77.3% for AGIs $10k-25k, 74.7% for AGIs $25k-50k, 71.4% for AGIs $50k-75k, 77.5% for AGIs $75k-100k, 68.9% for AGIs over 100k)
Taxable interest for individuals: $1,685 (reported on 53.5% of returns)
This zip code:
$1,685
Oklahoma:
$1,745
(% of AGI for various income ranges: 6.3% for AGIs below $10k, 2.2% for AGIs $10k-25k, 1.9% for AGIs $25k-50k, 1.6% for AGIs $50k-75k, 0.9% for AGIs $75k-100k, 1.1% for AGIs over 100k)
Taxable dividends: $2,780 (reported on 32.8% of returns)
Here:
$2,780
State:
$2,920
(% of AGI for various income ranges: 5.4% for AGIs below $10k, 1.5% for AGIs $10k-25k, 1.2% for AGIs $25k-50k, 1.3% for AGIs $50k-75k, 1.1% for AGIs $75k-100k, 1.3% for AGIs over 100k)
Net capital gain/loss: +$8,422 (reported on 28.7% of returns)
Here:
+$8,422
State:
+$10,653
(% of AGI for various income ranges: 2.0% for AGIs below $10k, 0.6% for AGIs $10k-25k, 0.7% for AGIs $25k-50k, 0.8% for AGIs $50k-75k, 1.1% for AGIs $75k-100k, 4.9% for AGIs over 100k)
Profit/loss from business: +$14,348 (reported on 21.5% of returns)
Here:
+$14,348
State:
+$8,532
(% of AGI for various income ranges: 3.2% for AGIs below $10k, 6.0% for AGIs $10k-25k, 4.9% for AGIs $25k-50k, 4.2% for AGIs $50k-75k, 3.8% for AGIs $75k-100k, 4.4% for AGIs over 100k)
IRA payment deduction: $3,409 (reported on 3.3% of returns)
73034:
$3,409
Oklahoma:
$3,127
(% of AGI for various income ranges: 0.3% for AGIs $10k-25k, 0.4% for AGIs $25k-50k, 0.3% for AGIs $50k-75k, 0.2% for AGIs $75k-100k, 0.1% for AGIs over 100k)
Self-employed pension: $12,053 (reported on 1.6% of returns)
Here:
$12,053
Oklahoma:
$14,276
(% of AGI for various income ranges: 0.1% for AGIs $10k-25k, 0.1% for AGIs $25k-50k, 0.1% for AGIs $50k-75k, 0.2% for AGIs $75k-100k, 0.4% for AGIs over 100k)
Total itemized deductions: $22,223 (18% of AGI, reported on 49.5% of returns)
Here:
$22,223
State:
$17,093
Here:
18.2% of AGI
State:
20.5% of AGI
(% of AGI for various income ranges: 14.4% for AGIs below $10k, 12.8% for AGIs $10k-25k, 16.4% for AGIs $25k-50k, 19.1% for AGIs $50k-75k, 19.7% for AGIs $75k-100k, 14.4% for AGIs over 100k)
Charity contributions deductions: $5,390 (4% of AGI, reported on 45.3% of returns)
Here:
$5,390
State:
$4,240
Here:
4.2% of AGI
State:
4.8% of AGI
(% of AGI for various income ranges: 0.9% for AGIs below $10k, 1.5% for AGIs $10k-25k, 2.9% for AGIs $25k-50k, 3.5% for AGIs $50k-75k, 3.5% for AGIs $75k-100k, 3.7% for AGIs over 100k)
Total tax: $13,766 (reported on 78.1% of returns)
73034:
$13,766
State:
$6,542
(% of AGI for various income ranges: 3.8% for AGIs below $10k, 4.6% for AGIs $10k-25k, 6.9% for AGIs $25k-50k, 8.8% for AGIs $50k-75k, 10.1% for AGIs $75k-100k, 19.4% for AGIs over 100k)
Earned income credit: $1,618 (reported on 9.5% of returns)
Here:
$1,618
State:
$1,830
Percentage of individuals using paid preparers for their 2004 taxes: 55.0%
Here:
55%
State:
63%
(% for various income ranges: 42.6% for AGIs below $10k, 54.4% for AGIs $10k-25k, 57.3% for AGIs $25k-50k, 59.6% for AGIs $50k-75k, 53.9% for AGIs $75k-100k, 64.6% for AGIs over 100k)
Likely homosexual households (counted as self-reported same-sex unmarried-partner households)
Lesbian couples: 0.4% of all households
Gay men: 0.0% of all households
Household received Food Stamps/SNAP in the past 12 months: 1,095 Household did not receive Food Stamps/SNAP in the past 12 months: 16,238
Women who had a birth in the past 12 months: 775 (592 now married, 187 unmarried) Women who did not have a birth in the past 12 months: 10,488 (5,007 now married, 5,481 unmarried)
Housing units in zip code 73034 with a mortgage: 8,505 (550 second mortgage, 445 both second mortgage and home equity loan) Houses without a mortgage: 91
Median monthly owner costs for units with a mortgage: $2,277 Median monthly owner costs for units without a mortgage: $838
Residents with income below the poverty level in 2022:
This zip code:
10.1%
Whole state:
15.7%
Residents with income below 50% of the poverty level in 2022:
This zip code:
5.0%
Whole state:
8.3%
Median number of rooms in houses and condos:
Here:
7.5
State:
6.1
Median number of rooms in apartments:
Here:
4.2
State:
4.5
Notable locations in this zip code not listed on our city pages
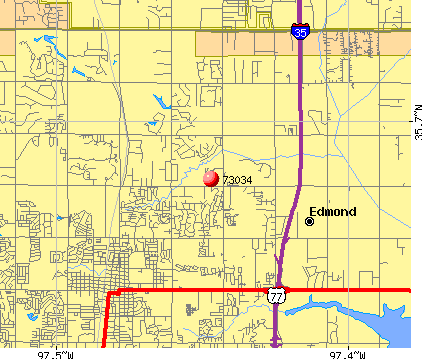
Notable locations in zip code 73034: Bryant Square (A), Edmond Fire Department Station 2 (B), Edmond Fire Department Station 5 (C), Edmond Fire Department Station 1 (D), Oak Cliff Rural Fire Protection (E). Display/hide their locations on the map
Churches in zip code 73034 include: Wesley Foundation Ministries (A), Waterloo Road Baptist Church (B), Trinity Community Center (C), Saint Marys Episcopal Church (D), Saint Mark Lutheran Church (E), Saint Johns Catholic Church (F), Reorganized Church of Jesus (G), Peace Lutheran Church (H), Philadelphia Church of God (I). Display/hide their locations on the map
Reservoirs: Cottonwood Creek Site 54 Reservoir (A), Twin Bridges Lake (B), Cottonwood Creek Site 54 Reservoir (C), Oknoname 083025 Reservoir (D). Display/hide their locations on the map
9,112 married couples with children.
2,443 single-parent households (991 men, 1,452 women).
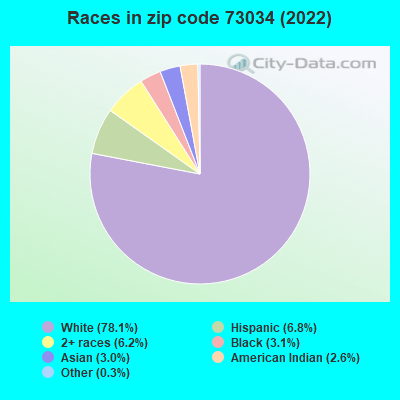
92.1% of residents of 73034 zip code speak English at home.
4.0% of residents speak Spanish at home (71% very well, 17% well, 11% not well, 1% not at all).
1.5% of residents speak other Indo-European language at home (82% very well, 14% well, 4% not well).
1.2% of residents speak Asian or Pacific Island language at home (53% very well, 34% well, 12% not well).
1.0% of residents speak other language at home (74% very well, 18% well, 8% not at all).
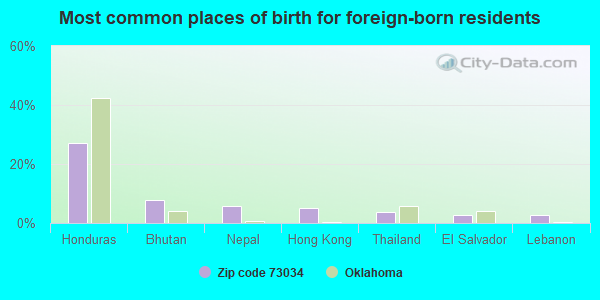
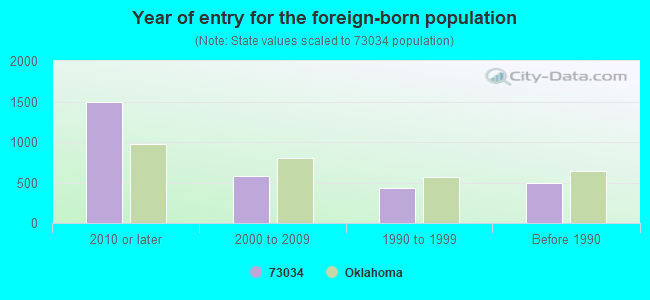
Foreign born population: 2,394 (5.1%) (38.8% of them are naturalized citizens)
Major facilities with environmental interests located in this zip code:
CLEGERN ES (601 SOUTH JACKSON in EDMOND, OK)
(National Center for Education Statistics) - STATE ID-55-I012-105 Organizations: EDMOND (SCHOOL DISTRICT)
CLYDE HOWELL CTR (45 EAST 12TH STREET in EDMOND, OK)
(National Center for Education Statistics) - STATE ID-55-I012-103 Organizations: EDMOND (SCHOOL DISTRICT)
CENTRAL MS (500 E. 9TH STREET in EDMOND, OK)
(National Center for Education Statistics) - STATE ID-55-I012-525 Organizations: EDMOND (SCHOOL DISTRICT)
FREEMAN HOMES - PALO VERDE DEVELOPMENT (1800 NORTHWESTERN in EDMOND, OK)
(Integrated Compliance Information System) - ICIS-06-1997-0749, FORMAL ENFORCEMENT ACTION Business SIC classification: GENERAL CONTRACTORS-SINGLE-FAMILY HOUSES; OPERATIVE BUILDERS
BROUKHAUS MOBILE HOME PARK (800 N CHOWNING STE 60 in EDMOND, OK)
(Integrated Compliance Information System) - ICIS-06-1995-0312, FORMAL ENFORCEMENT ACTION, ICIS-06-1994-0005, ICIS-06-1992-0161, ICIS-06-1993-0033, Business SIC classification: WATER SUPPLY
BOB HOWARD BODY SHOP (3700 SOUTH BROADWAY EXTENSION in EDMOND, OK)
AIR MINOR (AIRS/AFS) Small Quantity Generators, between 100 kg and 1000 kg of hazardous waste/month (Resource Conservation and Recovery Act (tracking hazardous waste)) - notification Business SIC classification: BUSINESS ASSOCIATIONS Organizations: BOB MOORE (CONTACT/OWNER)
Alternative names: BOB HOWARD PAINT AN 3700 S BROADWAY B, BOB HOWARD PAINT & /3700 S BROADWAY BODY
COLLISION CENTER II THE (600 S BROADWAY in EDMOND, OK)
(Resource Conservation and Recovery Act (tracking hazardous waste)) Organizations: BILL BINSWANGER (CONTACT/OPERATOR)
EDMOND CITY OF (315 SW 33RD in EDMOND, OK)
COMPLIANCE ACTIVITY (Tracking inspections of insecticide, fungicide, and rodenticide, and toxic substances) Conditionally Exempt Small Quantity Generators, less than 100 kg/month of hazardous waste (Resource Conservation and Recovery Act (tracking hazardous waste)) - notification Business SIC classification: ELECTRIC SERVICES Organizations: CITY OF EDMOND (CONTACT/OWNER)
Alternative names: CITY OF EDMOND, EDMOND CITY OF, ELECTRIC DEPT
MCBRIDE & SONS CONST CO (5600 N I-35 INDUSTRIAL BLVD in EDMOND, OK)
(Resource Conservation and Recovery Act (tracking hazardous waste)) Organizations: DON MCBRIDE (CONTACT/OWNER)
EDMOND DODGE (3701 S BROADWAY in EDMOND, OK)
(Resource Conservation and Recovery Act (tracking hazardous waste)) Organizations: MONTY MINOR (CONTACT/OWNER)
CENTRAL STATE UNIV (100 N UNIVERSITY BLVD in EDMOND, OK)
(Resource Conservation and Recovery Act (tracking hazardous waste)) Organizations: STATE OF OK (CONTACT/OWNER)
EDMOND PUBLIC SCHOOLS (125 N ST in EDMOND, OK)
(Resource Conservation and Recovery Act (tracking hazardous waste))
COMET CLNRS & LNDRY (1319 S BROADWAY in EDMOND, OK)
(Resource Conservation and Recovery Act (tracking hazardous waste)) Organizations: JOHN MOORE (CONTACT/OWNER)
Housing units lacking complete plumbing facilities: 1.2% Housing units lacking complete kitchen facilities: 2.2%
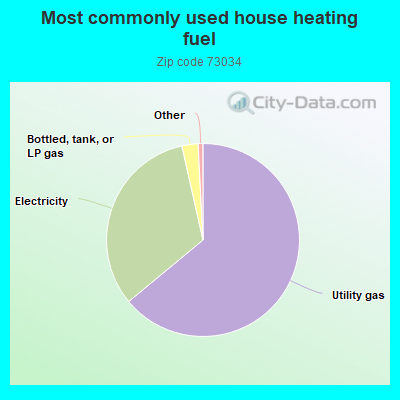
64.0%Utility gas
32.5%Electricity
2.7%Bottled, tank, or LP gas
Population in 1990: 43,814.
Place of birth for U.S.-born residents:
This state: 25,875
Northeast: 1,590
Midwest: 5,367
South: 7,069
West: 4,610
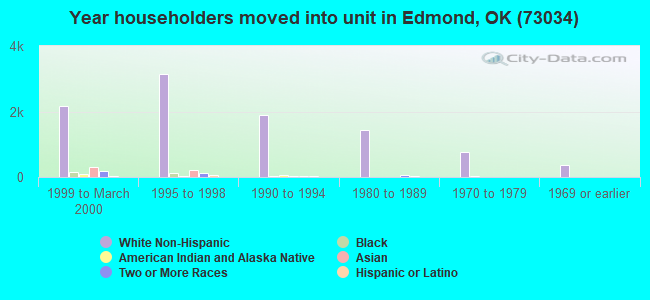
47% of the 73034 zip code residents lived in the same house 5 years ago. Out of people who lived in different houses, 48% lived in this county. Out of people who lived in different counties, 50% lived in Oklahoma.
90% of the 73034 zip code residents lived in the same house 1 year ago. Out of people who lived in different houses, 48% moved from this county. Out of people who lived in different houses, 17% moved from different county within same state. Out of people who lived in different houses, 32% moved from different state. Out of people who lived in different houses, 6% moved from abroad.
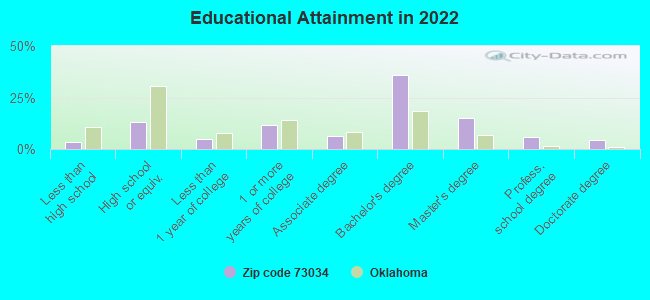
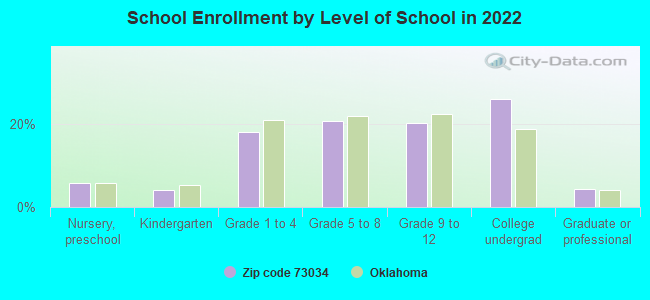
Private vs. public school enrollment:
Students in private schools in grades 1 to 8 (elementary and middle school): 822
Here:
14.8%
Oklahoma:
11.7%
Students in private schools in grades 9 to 12 (high school): 550
Here:
18.9%
Oklahoma:
11.7%
Students in private undergraduate colleges: 834
Here:
22.2%
Oklahoma:
19.3%
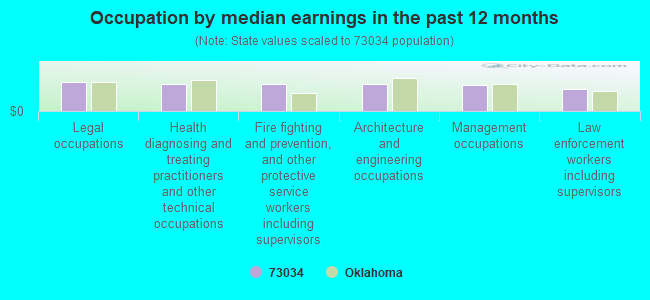
Occupation by median earnings in the past 12 months ($)
114,537Legal occupations
105,567Health diagnosing and treating practitioners and other technical occupations
104,247Fire fighting and prevention, and other protective service workers including supervisors
103,574Architecture and engineering occupations
101,418Management occupations
86,761Law enforcement workers including supervisors
Companies with biggest federal contracts located in this zip code (EDMOND, OK):
TTK CONSTRUCTION COMPANY (5860 INDUSTRIAL BLVD; small business) : $5,504,004 in 12 contractsfrom 2001 to 2005
Contracts for Construction of Structures and Facilities -- Highways, Roads, Streets, Bridges, and Railways (includes resurfacing), Maintenance, Repair or Alteration of Real Property -- Airport Runways by Army Signed by year:2000: $0; 2001: $1,244,360; 2002: $0; 2003: $4,009,497; 2004: $139,736; 2005: $110,411; 2006: $0.
Biggest contracts:
$4,080,448 with Army for Construction of Structures and Facilities -- Highways, Roads, Streets, Bridges, and Railways (includes resurfacing). Signed on 2003-09-28. Completion date: 2005-01-31.
$1,244,360 with Army for Maintenance, Repair or Alteration of Real Property -- Airport Runways. Signed on 2001-07-16. Completion date: 2002-04-30.
$99,323 with Army for Construction of Structures and Facilities -- Highways, Roads, Streets, Bridges, and Railways (includes resurfacing). Signed on 2005-05-31. Completion date: 2005-12-30.
$88,000, same as above.Signed on 2004-02-04. Completion date: 2005-01-31.
ACORN LANDSCAPING AND CONSTRUC (4401 SYCAMORE LN; small business) : $1,171,192 in 14 contractsfrom 2001 to 2005
Contracts for Maintenance, Repair or Alteration of Real Property -- Office Buildings, Demolition of Structures or Facilities (Other than Buildings), Construction of Structures and Facilities -- Hospitals and Infirmaries, Maintenance, Repair or Alteration of Real Property -- Troop Housing Facilities, and moreby Air Force, Department of Veterans Affairs, Army, U.S. Army Corps of Engineers - civil program financing only, and others Signed by year:2000: $0; 2001: $263,813; 2002: $104,533; 2003: $623,420; 2004: $0; 2005: $179,426; 2006: $0.
Biggest contracts:
$304,000 with Air Force for Maintenance, Repair or Alteration of Real Property -- Office Buildings. Signed on 2003-08-21. Completion date: 2003-11-19.
$191,070 with Air Force for Demolition of Structures or Facilities (Other than Buildings). Signed on 2003-07-30. Completion date: 2003-09-25.
$143,000 with Department of Veterans Affairs for Construction of Structures and Facilities -- Hospitals and Infirmaries. Signed on 2001-05-15. Completion date: 2001-11-15.
$132,626 with Air Force for Maintenance, Repair or Alteration of Real Property -- Troop Housing Facilities. Taking place in TX. Signed on 2005-09-16. Completion date: 2006-02-24.
PRIMARY STRUCTURAL ELEMENTS IN (909 MARSTON DR; small business) : $718,824 in 23 contractsfrom 2002 to 2006
Contracts for Airframe Structural Components, Guided Missile Components, Gas Turbines and Jet Engines, Aircraft; Prime Moving, and Components, Guided Missile Handling and Servicing Equipment by Air Force, Army, Defense Logistics Agency Signed by year:2000: $0; 2001: $0; 2002: $76,859; 2003: $302,328; 2004: $204,630; 2005: $197,007; 2006: -$62,000.
Biggest contracts:
$162,500 with Air Force for Airframe Structural Components. Signed on 2004-12-16. Completion date: 2005-04-30.
$151,900, same as above.Signed on 2003-08-01. Completion date: 2004-03-15.
$125,928, same as above.Signed on 2003-07-17. Completion date: 2003-04-30.
$77,963 with Army for Airframe Structural Components. Signed on 2005-11-15. Completion date: 2010-11-15.
SPACES, INC (2801 COLTRANE PL STE 1; small business) : $221,502 in 26 contractsfrom 2003 to 2006
Contracts for Office Furniture, Installation of Equipment -- Furniture, Construction of Structures and Facilities -- Other Administrative Facilities and Service Buildings by Army, Public Buildings Service Signed by year:2000: $0; 2001: $0; 2002: $0; 2003: $15,737; 2004: $92,553; 2005: $108,482; 2006: $4,730.
Biggest contracts:
$32,517 with Army for Office Furniture. Signed on 2005-09-01. Completion date: 2006-01-27.
$32,259 with Army for Installation of Equipment -- Furniture. Signed on 2005-01-27. Completion date: 2005-03-31.
$31,059 with Army for Office Furniture. Signed on 2004-05-26. Completion date: 2004-08-13.
$17,800 with Public Buildings Service for Office Furniture. Signed on 2004-04-15. Completion date: 2004-04-30.
KIDSPLACE DESIGNS LLC (808 STONEHENGE DRIVE; small business)
$138,861 with Air Force for Construction of Structures and Facilities -- Recreation Facilities (Non-Building). Signed on 2001-09-21. Completion date: 2001-09-20.
ENTERPRISE LEASING COMPANY-SOU (1320 E 9TH ST STE 1) : $103,536 in 9 contractsfrom 2000 to 2005
Contracts for Lease or Rental of Equipment -- Ground Effect Vehicles, Motor Vehicles, Trailers, and Cycles, Motor Pool Operations, Passenger Motor Vehicles by Air Force, Army Signed by year:2000: $50,625; 2001: $2,100; 2002: $0; 2003: $10,898; 2004: $20,038; 2005: $19,875; 2006: $0.
Biggest contracts:
$50,625 with Air Force for Lease or Rental of Equipment -- Ground Effect Vehicles, Motor Vehicles, Trailers, and Cycles. Taking place in AR. Signed on 2000-06-28. Completion date: 2000-07-28.
$18,640, same as above.Signed on 2004-10-19. Completion date: 2004-11-10.
$13,569, same as above.Signed on 2005-10-01. Completion date: 2005-10-10.
$10,898 with Army for Lease or Rental of Equipment -- Ground Effect Vehicles, Motor Vehicles, Trailers, and Cycles. Taking place in AR. Signed on 2003-08-20. Completion date: 2003-08-30.
SUSAN L. MEHARGUE (1920 E. 2ND ST., APT. 2411; small business)
$52,000 with Air Force for Nursing Services. Signed on 2000-01-19. Completion date: 2001-01-23.
BOB SEEDERS BUFFER ZONE (3215 OAKLEAF DRIVE; small business)
$39,600 with Defense Logistics Agency for Miscellaneous Chemical Specialties. Signed on 2000-01-31. Completion date: 2000-03-31.
TRIBBLE DESIGN ASSOCIATES, INC (2501 BRIXTON RD; small business)
$38,000 with Army for Other Professional Services. Signed on 2004-09-08. Completion date: 2004-11-12.
DIVERSIFIED CONSTRUCTION OF OK (6288 BOUCHER DRIVE; small business)
$34,599 with Air Force for Prefabricated and Portable Buildings. Signed on 2003-01-21. Completion date: 2003-05-30.
Top industries in this zip code by the number of employees in 2005:
Real Estate and Rental and Leasing: Passenger Car Rental (over 1000 employees: 1 establishment, 1-4 employees: 1 establishment)
2002 - 2018 National Fire Incident Reporting System (NFIRS) incidents
According to the data from the years 2002 - 2018 the average number of fire incidents per year is 167. The highest number of fires - 313 took place in 2011, and the least - 104 in 2002. The data has an increasing trend.
When looking into fire subcategories, the most incidents belonged to: Outside Fires (55.6%), and Structure Fires (29.0%).
Fire incident types reported to NFIRS in Zip Code 73034


 Nearest zip codes: 73003, 73013, 73007, 73131, 73151, 73025.


 According to the data from the years 2002 - 2018 the average number of fire incidents per year is 167. The highest number of fires - 313 took place in 2011, and the least - 104 in 2002. The data has an increasing trend.
 When looking into fire subcategories, the most incidents belonged to: Outside Fires (55.6%), and Structure Fires (29.0%).