Estimated zip code population in 2022: 58,933 Zip code population in 2010: 43,933 Zip code population in 2000: 32,091
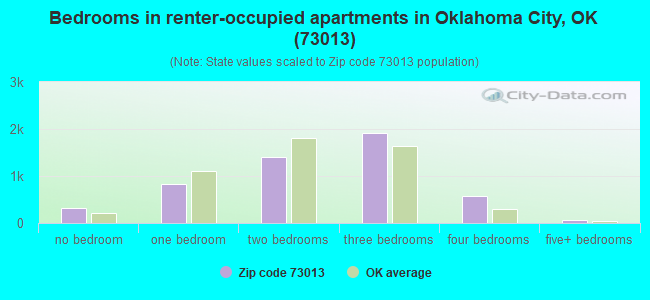
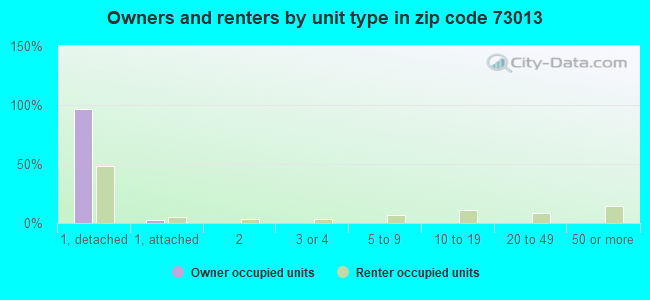
Houses and condos: 23,310 Renter-occupied apartments: 5,129
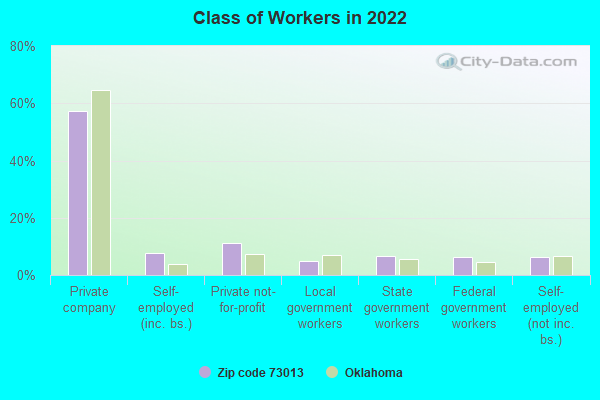
% of renters here:
23%
State:
35%
March 2022 cost of living index in zip code 73013: 86.7 (less than average, U.S. average is 100)
Land area: 29.3 sq. mi. Water area: 0.4 sq. mi.
Population density: 2,013 people per square mile
(low).
OSM Map
General Map
Google Map
MSN Map
OSM Map
General Map
Google Map
MSN Map
OSM Map
General Map
Google Map
MSN Map
OSM Map
General Map
Google Map
MSN Map
Please wait while loading the map...
Real estate property taxes paid for housing units in 2022:
This zip code:
1.0% ($3,088)
Oklahoma:
0.8% ($1,501)
Median real estate property taxes paid for housing units with mortgages in 2022: $3,143 (1.0%) Median real estate property taxes paid for housing units with no mortgage in 2022: $2,931 (0.9%)
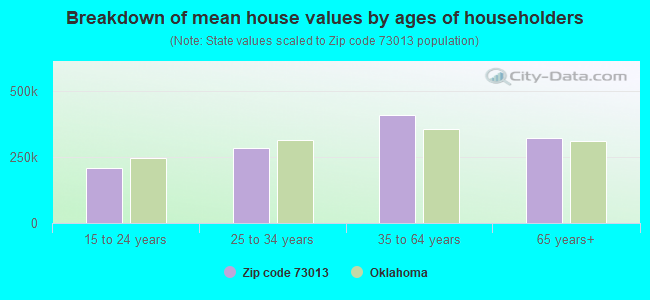
Estimated median house/condo value in 2022: $303,459
73013:
$303,459
Oklahoma:
$191,700
According to our research of Oklahoma and other state lists, there were 30 registered sex offenders living in 73013 zip code as of April 26, 2024. The ratio of all residents to sex offenders in zip code 73013 is 1,678 to 1. The ratio of registered sex offenders to all residents in this zip code is much lower than the state average.
Median resident age:
This zip code:
35.3 years
Oklahoma median age:
37.1 years
Average household size:
This zip code:
2.6 people
Oklahoma:
2.5 people
Averages for the 2020 tax year for zip code 73013, filed in 2021:
Average Adjusted Gross Income (AGI) in 2020: $105,222 (Individual Income Tax Returns)
Here:
$105,222
State:
$63,060
Salary/wage: $83,948 (reported on 81.9% of returns)
Here:
$83,948
State:
$52,427
(% of AGI for various income ranges: 1123.3% for AGIs below $25k, 3572.8% for AGIs $25k-50k, 6514.6% for AGIs $50k-75k, 9595.6% for AGIs $75k-100k, 17812.3% for AGIs $100k-200k, 74984.4% for AGIs over 200k)
Taxable interest for individuals: $2,252 (reported on 40.7% of returns)
This zip code:
$2,252
Oklahoma:
$1,603
(% of AGI for various income ranges: 20.2% for AGIs below $25k, 33.2% for AGIs $25k-50k, 54.6% for AGIs $50k-75k, 100.7% for AGIs $75k-100k, 169.4% for AGIs $100k-200k, 1386.3% for AGIs over 200k)
Ordinary dividends: $8,463 (reported on 26.4% of returns)
Here:
$8,463
State:
$7,001
(% of AGI for various income ranges: 33.0% for AGIs below $25k, 57.0% for AGIs $25k-50k, 107.1% for AGIs $50k-75k, 214.6% for AGIs $75k-100k, 389.1% for AGIs $100k-200k, 3761.2% for AGIs over 200k)
Net capital gain/loss in AGI: +$25,104 (reported on 26.2% of returns)
Here:
+$25,104
State:
+$19,855
(% of AGI for various income ranges: 21.7% for AGIs below $25k, 45.6% for AGIs $25k-50k, 118.1% for AGIs $50k-75k, 197.6% for AGIs $75k-100k, 652.1% for AGIs $100k-200k, 14812.8% for AGIs over 200k)
Profit/loss from business: +$13,806 (reported on 20.5% of returns)
Here:
+$13,806
State:
+$9,904
(% of AGI for various income ranges: 131.9% for AGIs below $25k, 154.9% for AGIs $25k-50k, 285.0% for AGIs $50k-75k, 285.5% for AGIs $75k-100k, 554.0% for AGIs $100k-200k, 3366.1% for AGIs over 200k)
Taxable individual retirement arrangement distribution: $24,408 (reported on 10.8% of returns)
73013:
$24,408
Oklahoma:
$20,476
(% of AGI for various income ranges: 58.1% for AGIs below $25k, 112.5% for AGIs $25k-50k, 241.7% for AGIs $50k-75k, 445.5% for AGIs $75k-100k, 838.9% for AGIs $100k-200k, 2245.1% for AGIs over 200k)
Self-employed (Keogh) retirement plans: $21,237 (reported on 0.7% of returns)
73013:
$21,237
Oklahoma:
$23,482
(% of AGI for various income ranges: 7.9% for AGIs $50k-75k, 18.5% for AGIs $100k-200k, 345.2% for AGIs over 200k)
Total itemized deductions: $41,766 (reported on 14.3% of returns)
Here:
$41,766
State:
$39,736
(% of AGI for various income ranges: 65.3% for AGIs below $25k, 156.5% for AGIs $25k-50k, 370.0% for AGIs $50k-75k, 577.6% for AGIs $75k-100k, 1179.9% for AGIs $100k-200k, 9482.8% for AGIs over 200k)
Charity contributions: $21,420 (reported on 12.2% of returns)
Here:
$21,420
State:
$17,288
(% of AGI for various income ranges: 6.8% for AGIs below $25k, 25.1% for AGIs $25k-50k, 75.0% for AGIs $50k-75k, 150.3% for AGIs $75k-100k, 401.0% for AGIs $100k-200k, 5210.0% for AGIs over 200k)
Taxes paid: $7,940 (reported on 14.2% of returns)
73013:
$7,940
State:
$7,046
(% of AGI for various income ranges: 8.2% for AGIs below $25k, 27.6% for AGIs $25k-50k, 75.1% for AGIs $50k-75k, 142.3% for AGIs $75k-100k, 320.9% for AGIs $100k-200k, 1418.7% for AGIs over 200k)
Earned income credit: $2,200 (reported on 10.1% of returns)
Here:
$2,200
State:
$2,435
(% of AGI for various income ranges: 70.2% for AGIs below $25k, 61.1% for AGIs $25k-50k, 1.2% for AGIs $50k-75k)
Percentage of individuals using paid preparers for their 2020 taxes: 92.8%
Here:
93%
State:
94%
(% for various income ranges: 91.5% for AGIs below $25k, 93.0% for AGIs $25k-50k, 92.6% for AGIs $50k-75k, 92.8% for AGIs $75k-100k, 93.5% for AGIs $100k-200k, 94.4% for AGIs over 200k)
Averages for the 2012 tax year for zip code 73013, filed in 2013:
Average Adjusted Gross Income (AGI) in 2012: $105,466 (Individual Income Tax Returns)
Here:
$105,466
State:
$58,581
Salary/wage: $79,186 (reported on 84.2% of returns)
Here:
$79,186
State:
$45,973
(% of AGI for various income ranges: 74.9% for AGIs below $25k, 77.7% for AGIs $25k-50k, 74.6% for AGIs $50k-75k, 75.3% for AGIs $75k-100k, 75.9% for AGIs $100k-200k, 50.1% for AGIs over 200k)
Taxable interest for individuals: $2,367 (reported on 46.0% of returns)
This zip code:
$2,367
Oklahoma:
$1,625
(% of AGI for various income ranges: 1.6% for AGIs below $25k, 0.8% for AGIs $25k-50k, 0.9% for AGIs $50k-75k, 0.8% for AGIs $75k-100k, 0.7% for AGIs $100k-200k, 1.3% for AGIs over 200k)
Ordinary dividends: $7,287 (reported on 28.4% of returns)
Here:
$7,287
State:
$6,374
(% of AGI for various income ranges: 2.2% for AGIs below $25k, 1.2% for AGIs $25k-50k, 1.2% for AGIs $50k-75k, 1.1% for AGIs $75k-100k, 1.3% for AGIs $100k-200k, 2.7% for AGIs over 200k)
Net capital gain/loss in AGI: +$34,709 (reported on 24.0% of returns)
Here:
+$34,709
State:
+$24,023
(% of AGI for various income ranges: 0.3% for AGIs $25k-50k, 0.9% for AGIs $50k-75k, 0.7% for AGIs $75k-100k, 1.4% for AGIs $100k-200k, 15.2% for AGIs over 200k)
Profit/loss from business: +$17,202 (reported on 20.3% of returns)
Here:
+$17,202
State:
+$11,913
(% of AGI for various income ranges: 8.2% for AGIs below $25k, 4.6% for AGIs $25k-50k, 3.2% for AGIs $50k-75k, 3.5% for AGIs $75k-100k, 2.9% for AGIs $100k-200k, 3.0% for AGIs over 200k)
Taxable individual retirement arrangement distribution: $20,791 (reported on 11.6% of returns)
73013:
$20,791
Oklahoma:
$15,242
(% of AGI for various income ranges: 3.3% for AGIs below $25k, 2.5% for AGIs $25k-50k, 2.6% for AGIs $50k-75k, 2.7% for AGIs $75k-100k, 2.8% for AGIs $100k-200k, 1.8% for AGIs over 200k)
Self-employment retirement plans: $18,771 (reported on 1.0% of returns)
73013:
$18,771
Oklahoma:
$20,266
(% of AGI for various income ranges: 0.1% for AGIs $50k-75k, 0.1% for AGIs $100k-200k, 0.3% for AGIs over 200k)
Total itemized deductions: $28,310 (16% of AGI, reported on 48.0% of returns)
Here:
$28,310
State:
$24,882
Here:
15.8% of AGI
State:
18.8% of AGI
(% of AGI for various income ranges: 13.5% for AGIs below $25k, 12.5% for AGIs $25k-50k, 14.0% for AGIs $50k-75k, 14.2% for AGIs $75k-100k, 15.0% for AGIs $100k-200k, 11.4% for AGIs over 200k)
Charity contributions: $7,892 (reported on 41.3% of returns)
Here:
$7,892
State:
$6,591
(% of AGI for various income ranges: 1.4% for AGIs below $25k, 2.0% for AGIs $25k-50k, 2.5% for AGIs $50k-75k, 2.9% for AGIs $75k-100k, 3.4% for AGIs $100k-200k, 3.4% for AGIs over 200k)
Taxes paid: $10,201 (reported on 47.8% of returns)
73013:
$10,201
State:
$7,196
(% of AGI for various income ranges: 2.4% for AGIs below $25k, 2.7% for AGIs $25k-50k, 3.6% for AGIs $50k-75k, 4.3% for AGIs $75k-100k, 5.4% for AGIs $100k-200k, 4.9% for AGIs over 200k)
Earned income credit: $2,109 (reported on 9.7% of returns)
Here:
$2,109
State:
$2,354
(% of AGI for various income ranges: 4.5% for AGIs below $25k, 0.9% for AGIs $25k-50k)
Percentage of individuals using paid preparers for their 2012 taxes: 52.2%
Here:
52%
State:
56%
(% for various income ranges: 45.1% for AGIs below $25k, 46.5% for AGIs $25k-50k, 50.3% for AGIs $50k-75k, 52.5% for AGIs $75k-100k, 57.4% for AGIs $100k-200k, 77.3% for AGIs over 200k)
Averages for the 2004 tax year for zip code 73013, filed in 2005:
Average Adjusted Gross Income (AGI) in 2004: $73,633 (Individual Income Tax Returns)
Here:
$73,633
State:
$41,245
Salary/wage: $60,817 (reported on 82.9% of returns)
Here:
$60,817
State:
$35,318
(% of AGI for various income ranges: 616.0% for AGIs below $10k, 71.0% for AGIs $10k-25k, 73.2% for AGIs $25k-50k, 76.4% for AGIs $50k-75k, 78.4% for AGIs $75k-100k, 62.0% for AGIs over 100k)
Taxable interest for individuals: $2,241 (reported on 56.7% of returns)
This zip code:
$2,241
Oklahoma:
$1,745
(% of AGI for various income ranges: 45.4% for AGIs below $10k, 3.5% for AGIs $10k-25k, 2.0% for AGIs $25k-50k, 1.3% for AGIs $50k-75k, 1.3% for AGIs $75k-100k, 1.6% for AGIs over 100k)
Taxable dividends: $3,341 (reported on 34.6% of returns)
Here:
$3,341
State:
$2,920
(% of AGI for various income ranges: 28.7% for AGIs below $10k, 2.3% for AGIs $10k-25k, 1.5% for AGIs $25k-50k, 1.1% for AGIs $50k-75k, 1.1% for AGIs $75k-100k, 1.7% for AGIs over 100k)
Net capital gain/loss: +$13,870 (reported on 29.8% of returns)
Here:
+$13,870
State:
+$10,653
(% of AGI for various income ranges: -20.5% for AGIs below $10k, 0.4% for AGIs $10k-25k, 1.1% for AGIs $25k-50k, 0.7% for AGIs $50k-75k, 1.2% for AGIs $75k-100k, 8.8% for AGIs over 100k)
Profit/loss from business: +$14,160 (reported on 21.3% of returns)
Here:
+$14,160
State:
+$8,532
(% of AGI for various income ranges: 1.0% for AGIs below $10k, 5.8% for AGIs $10k-25k, 4.1% for AGIs $25k-50k, 3.4% for AGIs $50k-75k, 2.8% for AGIs $75k-100k, 4.4% for AGIs over 100k)
IRA payment deduction: $3,433 (reported on 3.0% of returns)
73013:
$3,433
Oklahoma:
$3,127
(% of AGI for various income ranges: 0.2% for AGIs $10k-25k, 0.3% for AGIs $25k-50k, 0.2% for AGIs $50k-75k, 0.2% for AGIs $75k-100k, 0.1% for AGIs over 100k)
Self-employed pension: $13,413 (reported on 1.2% of returns)
Here:
$13,413
Oklahoma:
$14,276
(% of AGI for various income ranges: 0.1% for AGIs $10k-25k, 0.0% for AGIs $25k-50k, 0.1% for AGIs $50k-75k, 0.2% for AGIs $75k-100k, 0.3% for AGIs over 100k)
Total itemized deductions: $21,676 (19% of AGI, reported on 54.8% of returns)
Here:
$21,676
State:
$17,093
Here:
18.6% of AGI
State:
20.5% of AGI
(% of AGI for various income ranges: 96.2% for AGIs below $10k, 16.5% for AGIs $10k-25k, 19.2% for AGIs $25k-50k, 18.9% for AGIs $50k-75k, 18.8% for AGIs $75k-100k, 14.2% for AGIs over 100k)
Charity contributions deductions: $5,876 (5% of AGI, reported on 49.9% of returns)
Here:
$5,876
State:
$4,240
Here:
4.8% of AGI
State:
4.8% of AGI
(% of AGI for various income ranges: 7.0% for AGIs below $10k, 2.3% for AGIs $10k-25k, 3.2% for AGIs $25k-50k, 3.5% for AGIs $50k-75k, 3.7% for AGIs $75k-100k, 4.4% for AGIs over 100k)
Total tax: $14,281 (reported on 80.5% of returns)
73013:
$14,281
State:
$6,542
(% of AGI for various income ranges: 21.2% for AGIs below $10k, 4.5% for AGIs $10k-25k, 6.9% for AGIs $25k-50k, 8.9% for AGIs $50k-75k, 10.3% for AGIs $75k-100k, 20.4% for AGIs over 100k)
Earned income credit: $1,706 (reported on 8.2% of returns)
Here:
$1,706
State:
$1,830
Percentage of individuals using paid preparers for their 2004 taxes: 56.4%
Here:
56%
State:
63%
(% for various income ranges: 49.7% for AGIs below $10k, 54.2% for AGIs $10k-25k, 56.0% for AGIs $25k-50k, 56.2% for AGIs $50k-75k, 54.8% for AGIs $75k-100k, 67.0% for AGIs over 100k)
Likely homosexual households (counted as self-reported same-sex unmarried-partner households)
Lesbian couples: 0.1% of all households
Gay men: 0.0% of all households
Household received Food Stamps/SNAP in the past 12 months: 867 Household did not receive Food Stamps/SNAP in the past 12 months: 20,875
Women who had a birth in the past 12 months: 931 (907 now married, 42 unmarried) Women who did not have a birth in the past 12 months: 12,832 (6,203 now married, 6,629 unmarried)
Housing units in zip code 73013 with a mortgage: 11,502 (780 second mortgage, 522 both second mortgage and home equity loan) Houses without a mortgage: 58
Median monthly owner costs for units with a mortgage: $1,866 Median monthly owner costs for units without a mortgage: $780
Residents with income below the poverty level in 2022:
This zip code:
6.6%
Whole state:
15.7%
Residents with income below 50% of the poverty level in 2022:
This zip code:
3.5%
Whole state:
8.3%
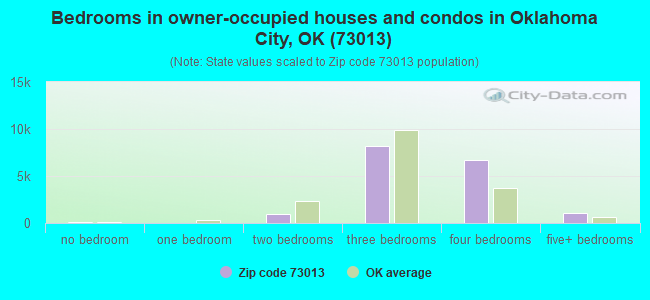
Median number of rooms in houses and condos:
Here:
6.8
State:
6.1
Median number of rooms in apartments:
Here:
5.1
State:
4.5
Notable locations in this zip code not listed on our city pages
Notable locations in zip code 73013: Boulevard Plaza (A), Edmond Crossing (B), Edmond Plaza (C), Memorial West (D), Edmond Fire Department Station 4 (E). Display/hide their locations on the map
Churches in zip code 73013 include: Southern Hills Christian Church (A), Seventh Day Adventist Church (B), New Covenant United Methodist Church (C), Lord of Life Lutheran Church (D), Liberty Church (E), Memorial Road Church of Christ (F), Henderson Hills Baptist Church (G), Heritage Presbyterian Church (H), First Freewill Baptist Church (I). Display/hide their locations on the map
11,319 married couples with children.
3,416 single-parent households (761 men, 2,655 women).
91.3% of residents of 73013 zip code speak English at home.
1.5% of residents speak Spanish at home (75% very well, 24% well, 1% not well).
2.5% of residents speak other Indo-European language at home (59% very well, 26% well, 15% not well).
3.1% of residents speak Asian or Pacific Island language at home (60% very well, 25% well, 10% not well, 5% not at all).
1.1% of residents speak other language at home (70% very well, 30% well).
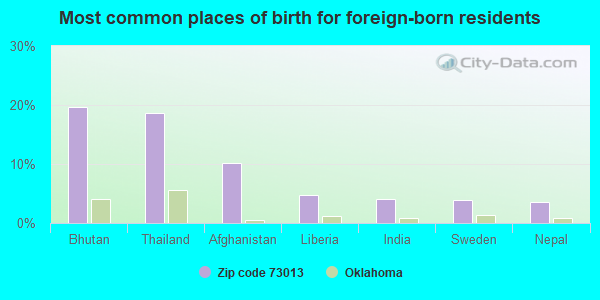
Foreign born population: 4,009 (6.8%) (60.3% of them are naturalized citizens)
DIMAGGIOS CLEANERS & LAUNDRY (2629 S BROADWAY COURT in EDMOND, OK)
(Resource Conservation and Recovery Act (tracking hazardous waste)) Organizations: DIMAGGIO JOHN (CONTACT/OWNER)
BELL AMERICAN HOMES (500 W 15TH ST in EDMOND, OK)
National Pollutant Discharge Elimination System NON-MAJOR (Tracking pollutant discharge elimination systems) - permit
DEFS EDMOND BOOSTER (2445 NW 164TH STREET in EDMOND, OK)
Conditionally Exempt Small Quantity Generators, less than 100 kg/month of hazardous waste (Resource Conservation and Recovery Act (tracking hazardous waste)) Organizations: DUKE ENERGY FIELD SERVICES LP (CONTACT/OPERATOR)
, DUKE ENERGY FIELD SVCS (CONTACT/OWNER)
Alternative names: PHILLIPS 66 EDMOND BOOSTER
AUTOMATIC SERVICE CORP (2600 S KELLY in EDMOND, OK)
Conditionally Exempt Small Quantity Generators, less than 100 kg/month of hazardous waste (Resource Conservation and Recovery Act (tracking hazardous waste)) - notification
BOB HOWARD HONDA (14137 N BROADWAY EXT in EDMOND, OK)
Conditionally Exempt Small Quantity Generators, less than 100 kg/month of hazardous waste (Resource Conservation and Recovery Act (tracking hazardous waste)) - notification
Housing units lacking complete plumbing facilities: 0.0% Housing units lacking complete kitchen facilities: 2.0%
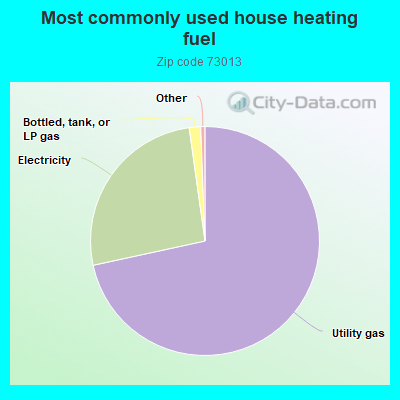
71.6%Utility gas
26.2%Electricity
1.6%Bottled, tank, or LP gas
Population in 1990: 22,802. Population change in the 1990s: +9,289 (+40.7%).
Place of birth for U.S.-born residents:
This state: 31,906
Northeast: 2,024
Midwest: 6,719
South: 8,575
West: 5,062
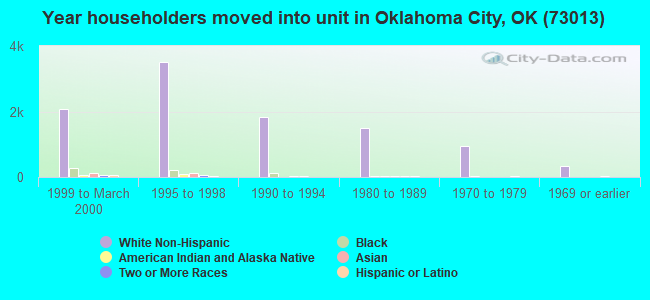
47% of the 73013 zip code residents lived in the same house 5 years ago. Out of people who lived in different houses, 58% lived in this county. Out of people who lived in different counties, 50% lived in Oklahoma.
86% of the 73013 zip code residents lived in the same house 1 year ago. Out of people who lived in different houses, 58% moved from this county. Out of people who lived in different houses, 12% moved from different county within same state. Out of people who lived in different houses, 21% moved from different state. Out of people who lived in different houses, 6% moved from abroad.
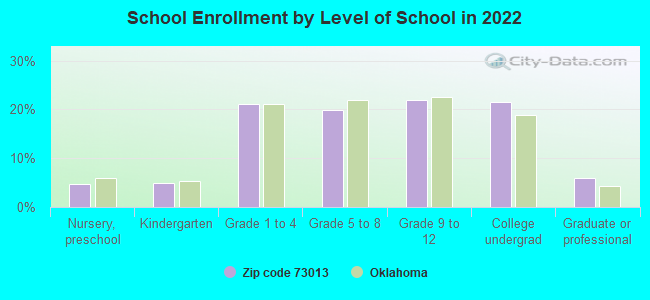
Private vs. public school enrollment:
Students in private schools in grades 1 to 8 (elementary and middle school): 1,467
Here:
19.5%
Oklahoma:
11.7%
Students in private schools in grades 9 to 12 (high school): 965
Here:
23.9%
Oklahoma:
11.7%
Students in private undergraduate colleges: 1,552
Here:
38.1%
Oklahoma:
19.3%
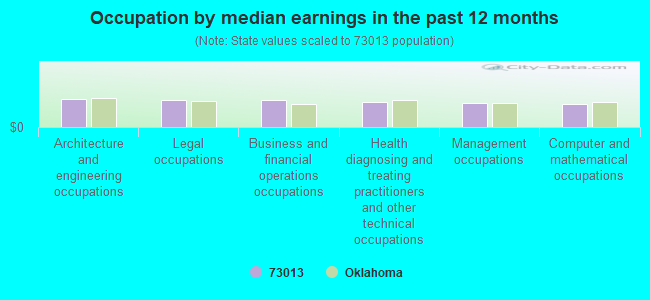
Occupation by median earnings in the past 12 months ($)
97,567Architecture and engineering occupations
94,907Legal occupations
94,291Business and financial operations occupations
88,610Health diagnosing and treating practitioners and other technical occupations
84,544Management occupations
80,711Computer and mathematical occupations
Companies with biggest federal contracts located in this zip code (EDMOND, OK):
SOUTHWIND CONSTRUCTION COMPANY (1701 S STATE STREET; small business) : $131,736,829 in 970 contractsfrom 1999 to 2006
Contracts for Maintenance, Repair or Alteration of Real Property -- Office Buildings, Maintenance, Repair or Alteration of Real Property -- Other Industrial Buildings, Maintenance, Repair or Alteration of Real Property -- Other Non-Building Facilities, Construction of Structures and Facilities -- Other Industrial Buildings, and moreby Air Force, Army, Navy, U.S. Army Corps of Engineers - civil program financing only, and others Signed by year:2000: $7,878,647; 2001: $14,941,609; 2002: $16,966,439; 2003: $33,334,246; 2004: $25,438,884; 2005: $22,824,921; 2006: $10,129,944.
Biggest contracts:
$3,975,000 with Air Force for Maintenance, Repair or Alteration of Real Property -- Office Buildings. Signed on 2003-09-30. Completion date: 2004-09-30.
$3,675,000 with Army for Maintenance, Repair or Alteration of Real Property -- Other Industrial Buildings. Signed on 2006-07-10. Completion date: 2007-03-06.
$3,525,000 with Air Force for Maintenance, Repair or Alteration of Real Property -- Office Buildings. Signed on 2001-05-14. Completion date: 2001-05-24.
$2,987,900 with Army for Maintenance, Repair or Alteration of Real Property -- Other Non-Building Facilities. Signed on 2000-09-21. Completion date: 2001-06-30.
SHILOH ENTERPRISES, INC (1600 SE 19TH ST STE 502; small business) : $6,720,679 in 8 contractsfrom 2002 to 2004
Contracts for Construction of Structures and Facilities -- Other Administrative Facilities and Service Buildings by Army Signed by year:2000: $0; 2001: $0; 2002: $5,976,000; 2003: $321,051; 2004: $423,628; 2005: $0; 2006: $0.
Biggest contracts:
$5,976,000 with Army for Construction of Structures and Facilities -- Other Administrative Facilities and Service Buildings. Signed on 2002-09-18. Completion date: 2003-04-15.
$362,539, same as above.Signed on 2004-09-30. Completion date: 2004-11-30.
$226,651, same as above.Signed on 2003-06-18. Completion date: 2004-04-15.
$58,700, same as above.Signed on 2003-11-02. Completion date: 2004-04-15.
UPTIME LTD (2948 VIA ESPERANZA; small business) : $552,249 in 26 contractsfrom 2001 to 2006
Contracts for ADP Central Processing Unit (CPU, Computer), Analog, ADP Support Equipment, Miscellaneous Office Machines, ADP Software, and moreby National Oceanic and Atmospheric Administration/Under Secretary for Oceans and Atmosphere, U.S. Army Corps of Engineers - civil program financing only, Army, Navy, and others Signed by year:2000: $0; 2001: $62,000; 2002: $149,797; 2003: $25,424; 2004: $82,667; 2005: $204,554; 2006: $27,807.
Biggest contracts:
$62,000 with National Oceanic and Atmospheric Administration/Under Secretary for Oceans and Atmosphere for ADP Central Processing Unit (CPU, Computer), Analog. Signed on 2001-07-15. Completion date: 2001-10-15.
$60,028 with U.S. Army Corps of Engineers - civil program financing only for ADP Support Equipment. Taking place in NE. Signed on 2002-08-26. Completion date: 2002-09-30.
$58,976 with Army for ADP Support Equipment. Signed on 2005-03-14. Completion date: 2005-04-08.
$47,918 with U.S. Army Corps of Engineers - civil program financing only for Miscellaneous Office Machines. Signed on 2002-08-20. Completion date: 2003-07-16.
CIRCA INC (709 GLENLAKE DR; small business) : $293,643 in 14 contractsfrom 2001 to 2006
Contracts for Installation of Equipment -- Miscellaneous, Maintenance, Repair and Rebuilding of Equipment -- Electric Wire, and Power and Distribution Equipment, Jams, Jellies, and Preserves, Maintenance, Repair and Rebuilding of Equipment -- Automatic Data Processing Equipment (Including Firmware), Software, Supplies and Support Equipment, and moreby Air Force, Department of Defense, Federal Technology Service Signed by year:2000: $0; 2001: $47,750; 2002: $25,909; 2003: $6,300; 2004: $166,484; 2005: $6,492; 2006: $40,708.
Biggest contracts:
$142,782 with Air Force for Installation of Equipment -- Miscellaneous. Signed on 2004-06-16. Completion date: 2004-07-31.
$60,000 with Air Force for Maintenance, Repair and Rebuilding of Equipment -- Electric Wire, and Power and Distribution Equipment. Signed on 2006-05-01. Completion date: 2007-04-30.
$47,750 with Department of Defense for Jams, Jellies, and Preserves. Signed on 2001-04-10. Completion date: 2002-06-09.
$25,909 with Air Force for Maintenance, Repair and Rebuilding of Equipment -- Automatic Data Processing Equipment (Including Firmware), Software, Supplies and Support Equipment. Signed on 2002-01-31. Completion date: 2002-03-15.
OPEN SOLUTIONS, INC (1909 INLAND HARBOR DR; small business) : $195,070 in 2 contractsfrom 2000 to 2005
$99,980 with Air Force for Other Research and Development -- Basic Research (R&D). Signed on 2005-08-24. Completion date: 2006-06-30.
$95,090 with Defense Logistics Agency for Machining Centers and Way-Type Machines. Signed on 2000-09-25. Completion date: 2000-10-16.
SOUTHWIND TODD A JOINT VENTURE (1701 S STATE STREET; small business) : $122,711 in 19 contractsfrom 1999 to 2000
Contracts for Maintenance, Repair or Alteration of Real Property -- Office Buildings by Air Force Signed by year:2000: $81,594; 2001: $0; 2002: $0; 2003: $0; 2004: $0; 2005: $0; 2006: $0.
Biggest contracts:
$39,358 with Air Force for Maintenance, Repair or Alteration of Real Property -- Office Buildings. Taking place in FL. Signed on 2000-02-08. Completion date: 2000-03-24.
$22,000, same as above.Signed on 2000-03-09. Completion date: 2000-05-12.
$21,885 with Air Force for Maintenance, Repair or Alteration of Real Property -- Office Buildings. Signed on 1999-12-01. Completion date: 2000-01-30.
$12,416 with Air Force for Maintenance, Repair or Alteration of Real Property -- Office Buildings. Taking place in FL. Signed on 2000-02-08. Completion date: 2000-02-18.
K-TRONICS INTERNATIONAL INC (1718 S KELLY AVE; small business) : $78,249 in 3 contractsin 2003
$38,220 with Navy for ADP Input/Output and Storage Devices. Signed on 2003-02-25. Completion date: 2003-05-26.
$29,724, same as above.Signed on 2003-09-26. Completion date: 2003-11-14.
$10,305 with Army for Microcircuits, Electronic. Signed on 2003-01-28. Completion date: 2003-02-28.
SPACE SOLUTIONS INC (13900 DEEP FORK POINT; small business) : $77,300 in 5 contractsfrom 2000 to 2006
Contracts for Freight Elevators, Maintenance, Repair and Rebuilding of Equipment -- Electrical and Electronic Equipment Components, Maintenance, Repair and Rebuilding of Equipment -- Furniture by Bureau of Prisoners/Federal Prison System, Air Force Signed by year:2000: $53,000; 2001: $0; 2002: $0; 2003: $0; 2004: $0; 2005: $21,300; 2006: $3,000.
Biggest contracts:
$53,000 with Bureau of Prisoners/Federal Prison System for Freight Elevators. Signed on 2000-08-15. Completion date: 2000-12-15.
$12,000 with Air Force for Maintenance, Repair and Rebuilding of Equipment -- Electrical and Electronic Equipment Components. Signed on 2005-05-23. Completion date: 2006-05-11.
$5,000, same as above.Signed on 2005-04-19. Completion date: 2005-05-11.
$4,300 with Air Force for Maintenance, Repair and Rebuilding of Equipment -- Furniture. Signed on 2005-08-02. Completion date: 2005-08-19.
TONJA PILGRIM (828 NW 140TH ST; small business) : $46,628 in 5 contractsfrom 2004 to 2005
Contracts for Legal Services, Transcription Services, ADP Data Entry Services by Navy Signed by year:2000: $0; 2001: $0; 2002: $0; 2003: $0; 2004: $19,128; 2005: $27,500; 2006: $0.
Biggest contracts:
$20,000 with Navy for Legal Services. Signed on 2005-05-04. Completion date: 2005-04-30.
$12,000 with Navy for Transcription Services. Taking place in NC. Signed on 2004-11-22. Completion date: 2005-09-30.
$7,500 with Navy for Transcription Services. Signed on 2005-08-31. Completion date: 2006-08-31.
$4,128, same as above.Signed on 2004-12-07. Completion date: 2005-01-05.
CROSSROADS FITNESS LLC (16325 N SANTA FE STEF #122; small business) : $26,138 in 3 contractsfrom 2004 to 2006
$37,500 with Air Force for Maintenance, Repair and Rebuilding of Equipment -- Recreational and Athletic Equipment. Signed on 2004-12-01. Completion date: 2005-09-30.
-$1,362, same as above.Signed on 2006-05-05. Completion date: 2005-09-30.
-$10,000, same as above.Signed on 2005-09-19. Completion date: 2005-09-30.
Top industries in this zip code by the number of employees in 2005:
2002 - 2018 National Fire Incident Reporting System (NFIRS) incidents
According to the data from the years 2002 - 2018 the average number of fires per year is 94. The highest number of reported fires - 130 took place in 2014, and the least - 72 in 2004. The data has an increasing trend.
When looking into fire subcategories, the most incidents belonged to: Outside Fires (47.7%), and Structure Fires (29.1%).
Fire incident types reported to NFIRS in Zip Code 73013

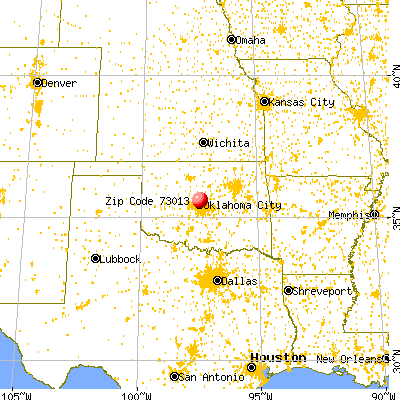


 Nearest zip codes: 73131, 73003, 73114, 73151, 73134, 73120.


 According to the data from the years 2002 - 2018 the average number of fires per year is 94. The highest number of reported fires - 130 took place in 2014, and the least - 72 in 2004. The data has an increasing trend.
 When looking into fire subcategories, the most incidents belonged to: Outside Fires (47.7%), and Structure Fires (29.1%).