Estimated zip code population in 2022: 618 Zip code population in 2010: 441 Zip code population in 2000: 436
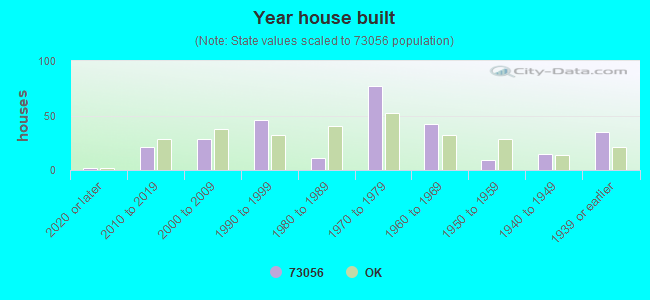
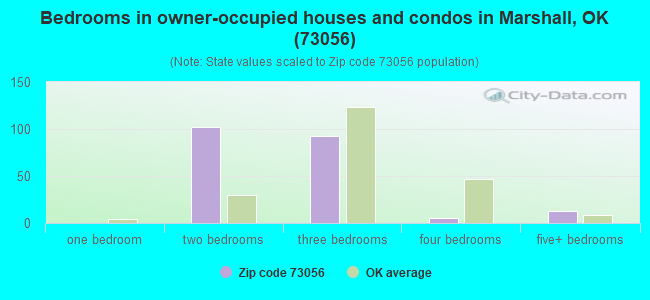
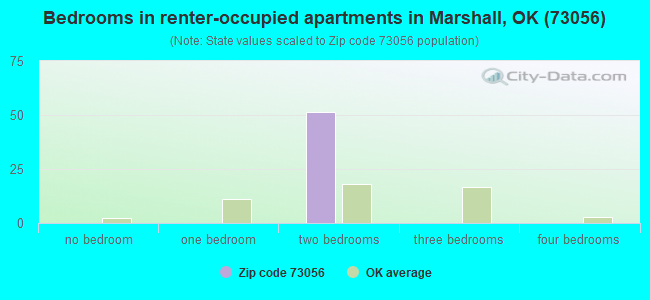
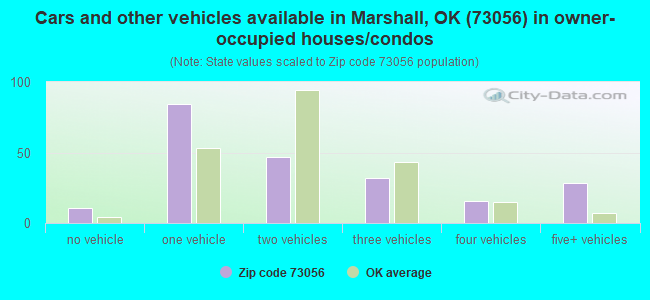
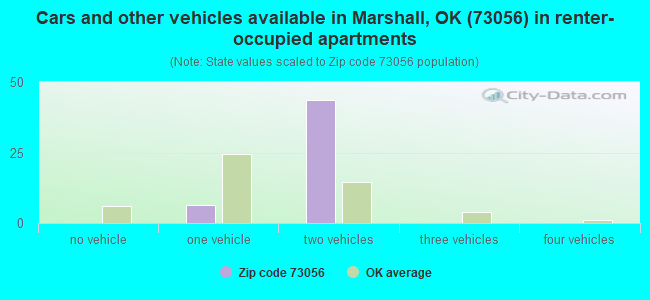
Houses and condos: 296 Renter-occupied apartments: 51
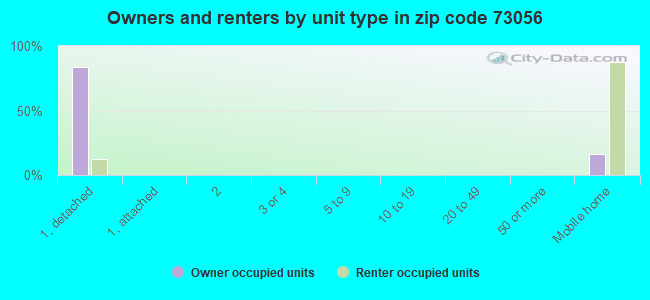
% of renters here:
19%
State:
35%
March 2022 cost of living index in zip code 73056: 75.2 (low, U.S. average is 100)
Land area: 113.2 sq. mi. Water area: 0.3 sq. mi.
Population density: 5 people per square mile
(very low).
OSM Map
General Map
Google Map
MSN Map
OSM Map
General Map
Google Map
MSN Map
OSM Map
General Map
Google Map
MSN Map
OSM Map
General Map
Google Map
MSN Map
Please wait while loading the map...
Real estate property taxes paid for housing units in 2022:
This zip code:
0.4% ($289)
Oklahoma:
0.8% ($1,501)
Median real estate property taxes paid for housing units with mortgages in 2022: $673 (0.4%) Median real estate property taxes paid for housing units with no mortgage in 2022: $251 (0.8%)
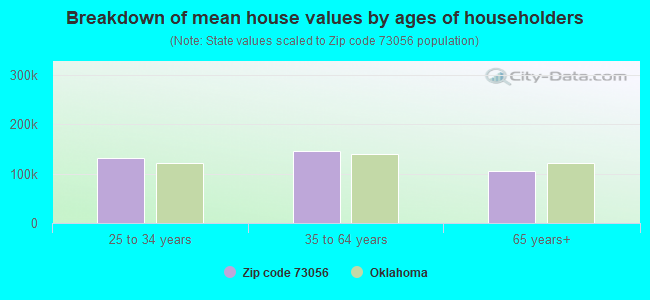
Estimated median house/condo value in 2022: $69,709
73056:
$69,709
Oklahoma:
$191,700
According to our research of Oklahoma and other state lists, there was 1 registered sex offender living in 73056 zip code as of April 25, 2024. The ratio of all residents to sex offenders in zip code 73056 is 503 to 1. The ratio of registered sex offenders to all residents in this zip code is near the state average.
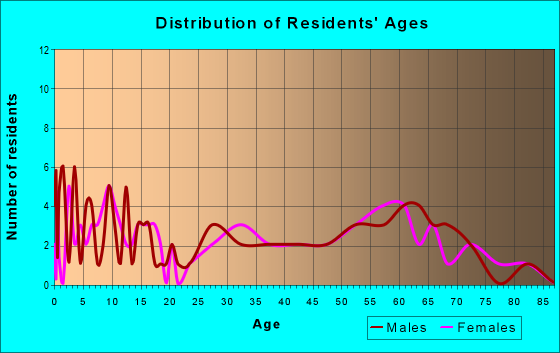
Median resident age:
This zip code:
46.2 years
Oklahoma median age:
37.1 years
Average household size:
This zip code:
2.3 people
Oklahoma:
2.5 people
Averages for the 2020 tax year for zip code 73056, filed in 2021:
Average Adjusted Gross Income (AGI) in 2020: $47,570 (Individual Income Tax Returns)
Here:
$47,570
State:
$63,060
Salary/wage: $41,562 (reported on 80.0% of returns)
Here:
$41,562
State:
$52,427
(% of AGI for various income ranges: 1178.0% for AGIs below $25k, 3660.0% for AGIs $25k-50k, 5593.3% for AGIs $50k-75k, 9730.0% for AGIs $75k-100k)
Taxable interest for individuals: $433 (reported on 30.0% of returns)
This zip code:
$433
Oklahoma:
$1,603
(% of AGI for various income ranges: 24.0% for AGIs below $25k, 46.7% for AGIs $50k-75k)
Ordinary dividends: $1,100 (reported on 15.0% of returns)
Here:
$1,100
State:
$7,001
(% of AGI for various income ranges: 82.5% for AGIs $25k-50k)
Net capital gain/loss in AGI: +$1,667 (reported on 15.0% of returns)
Here:
+$1,667
State:
+$19,855
(% of AGI for various income ranges: 125.0% for AGIs $25k-50k)
Profit/loss from business: +$3,200 (reported on 15.0% of returns)
Here:
+$3,200
State:
+$9,904
(% of AGI for various income ranges: 240.0% for AGIs $25k-50k)
Earned income credit: $2,733 (reported on 15.0% of returns)
Here:
$2,733
State:
$2,435
(% of AGI for various income ranges: 164.0% for AGIs below $25k)
Percentage of individuals using paid preparers for their 2020 taxes: 95.0%
Here:
95%
State:
94%
(% for various income ranges: 100.0% for AGIs below $25k, 100.0% for AGIs $25k-50k, 75.0% for AGIs $50k-75k, 100.0% for AGIs $75k-100k, 100.0% for AGIs $100k-200k)
Averages for the 2012 tax year for zip code 73056, filed in 2013:
Average Adjusted Gross Income (AGI) in 2012: $50,047 (Individual Income Tax Returns)
Here:
$50,047
State:
$58,581
Salary/wage: $40,914 (reported on 73.7% of returns)
Here:
$40,914
State:
$45,973
(% of AGI for various income ranges: 73.6% for AGIs below $25k, 81.8% for AGIs $25k-50k, 66.3% for AGIs $50k-75k, 120.7% for AGIs $75k-100k)
Taxable interest for individuals: $257 (reported on 36.8% of returns)
This zip code:
$257
Oklahoma:
$1,625
Ordinary dividends: $433 (reported on 15.8% of returns)
Here:
$433
State:
$6,374
Net capital gain/loss in AGI: +$7,333 (reported on 15.8% of returns)
Here:
+$7,333
State:
+$24,023
Profit/loss from business: +$5,267 (reported on 15.8% of returns)
Here:
+$5,267
State:
+$11,913
Total itemized deductions: $17,875 (21% of AGI, reported on 21.1% of returns)
Here:
$17,875
State:
$24,882
Here:
21.1% of AGI
State:
18.8% of AGI
Charity contributions: $3,367 (reported on 15.8% of returns)
Here:
$3,367
State:
$6,591
Taxes paid: $3,900 (reported on 15.8% of returns)
73056:
$3,900
State:
$7,196
Earned income credit: $2,267 (reported on 15.8% of returns)
Here:
$2,267
State:
$2,354
(% of AGI for various income ranges: 7.5% for AGIs below $25k)
Percentage of individuals using paid preparers for their 2012 taxes: 63.2%
Here:
63%
State:
56%
(% for various income ranges: 85.7% for AGIs below $25k, 66.7% for AGIs $50k-75k, 133.3% for AGIs $75k-100k)
Averages for the 2004 tax year for zip code 73056, filed in 2005:
Average Adjusted Gross Income (AGI) in 2004: $27,622 (Individual Income Tax Returns)
Here:
$27,622
State:
$41,245
Salary/wage: $26,596 (reported on 73.1% of returns)
Here:
$26,596
State:
$35,318
(% of AGI for various income ranges: 74.3% for AGIs $10k-25k, 81.9% for AGIs $25k-50k, 88.8% for AGIs $50k-75k)
Taxable interest for individuals: $747 (reported on 43.0% of returns)
This zip code:
$747
Oklahoma:
$1,745
(% of AGI for various income ranges: 2.1% for AGIs $10k-25k, 0.9% for AGIs $25k-50k, 0.3% for AGIs $50k-75k)
Taxable dividends: $429 (reported on 18.1% of returns)
Here:
$429
State:
$2,920
Net capital gain/loss: +$2,559 (reported on 17.6% of returns)
Here:
+$2,559
State:
+$10,653
Profit/loss from business: +$3,667 (reported on 15.5% of returns)
Here:
+$3,667
State:
+$8,532
Total itemized deductions: $12,056 (28% of AGI, reported on 18.7% of returns)
Here:
$12,056
State:
$17,093
Here:
28.1% of AGI
State:
20.5% of AGI
Charity contributions deductions: $3,156 (6% of AGI, reported on 16.6% of returns)
Here:
$3,156
State:
$4,240
Here:
6.4% of AGI
State:
4.8% of AGI
Total tax: $3,379 (reported on 64.2% of returns)
73056:
$3,379
State:
$6,542
(% of AGI for various income ranges: 3.4% for AGIs $10k-25k, 5.2% for AGIs $25k-50k, 9.2% for AGIs $50k-75k, 13.9% for AGIs $75k-100k)
Earned income credit: $2,176 (reported on 17.6% of returns)
Here:
$2,176
State:
$1,830
Percentage of individuals using paid preparers for their 2004 taxes: 73.6%
Here:
74%
State:
63%
(% for various income ranges: 67.3% for AGIs below $10k, 78.2% for AGIs $10k-25k, 65.4% for AGIs $25k-50k, 83.3% for AGIs $50k-75k, 100.0% for AGIs $75k-100k)
Household received Food Stamps/SNAP in the past 12 months: 10 Household did not receive Food Stamps/SNAP in the past 12 months: 254
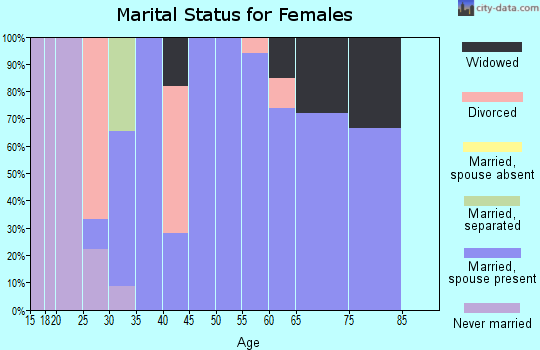
Women who had a birth in the past 12 months: 2 (2 now married, 0 unmarried) Women who did not have a birth in the past 12 months: 129 (117 now married, 12 unmarried)
Housing units in zip code 73056 with a mortgage: 68 Median monthly owner costs for units with a mortgage: $1,196 Median monthly owner costs for units without a mortgage: $269
Residents with income below the poverty level in 2022:
This zip code:
11.1%
Whole state:
15.7%
Residents with income below 50% of the poverty level in 2022:
This zip code:
5.8%
Whole state:
8.3%
Median number of rooms in houses and condos:
Here:
5.5
State:
6.1
Median number of rooms in apartments:
Here:
3.1
State:
4.5
Notable locations in this zip code not listed on our city pages
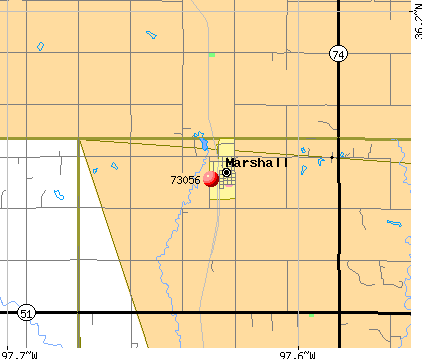
Cemeteries: Bethel Cemetery (1), North Marshall Independent Order of Odd Fellows Cemetery (2), Pleasant Ridge Cemetery (3). Display/hide their locations on the map
Creeks: Crows Nest Creek (A), Bitter Creek (B), Cottonwood Creek (C), Spring Creek (D), Camp Creek (E), Lyon Creek (F), Four-D Creek (G), Elkhorn Creek (H), Horse Creek (I). Display/hide their locations on the map
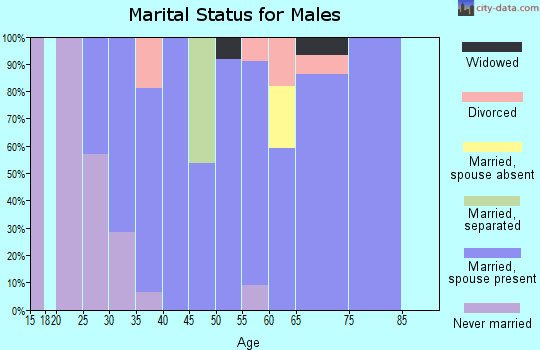
Size of family households: 96 2-persons, 20 3-persons, 38 4-persons, 16 5-persons
Size of nonfamily households: 89 1-person, 6 2-persons
105 married couples with children.
9 single-parent households (9 men).
99.0% of residents of 73056 zip code speak English at home.
1.2% of residents speak Spanish at home (100% very well).
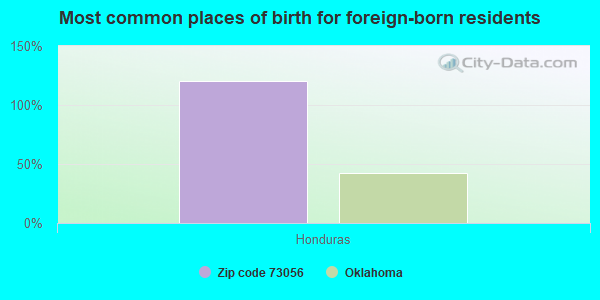
Foreign born population: 5 (1.0%) (0.0% of them are naturalized citizens)
:
1.0%
Whole state:
6.0%
120%Honduras
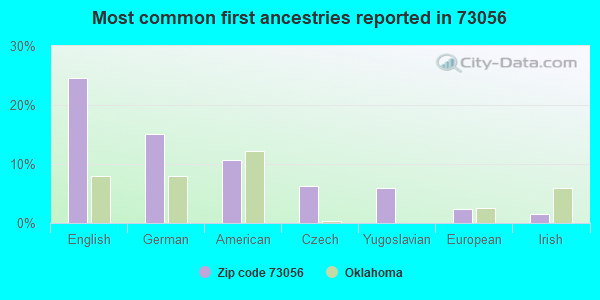
25%English
15%German
11%American
6%Czech
6%Yugoslavian
2%European
2%Irish
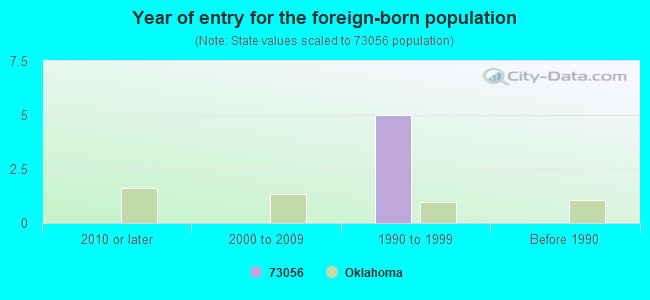
Year of entry for the foreign-born population
02010 or later
02000 to 2009
51990 to 1999
0Before 1990
Facilities with environmental interests located in this zip code:
CENTRAL OKLAHOMA SERVICES (WEST LAKE & RAILROAD AVENUE in MARSHALL, OK)
ENFORCEMENT/COMPLIANCE ACTIVITY (Integrated Compliance Information System)
Housing units lacking complete plumbing facilities: 1.6% Housing units lacking complete kitchen facilities: 3.0%
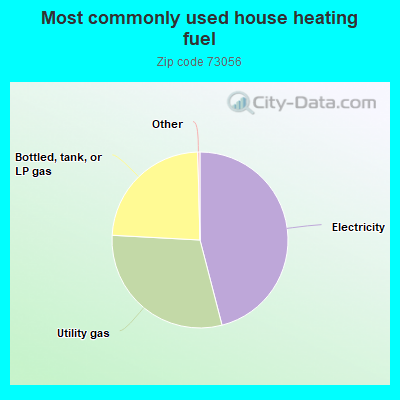
46.3%Electricity
30.1%Utility gas
23.9%Bottled, tank, or LP gas
Population in 1990: 479.
Place of birth for U.S.-born residents:
This state: 469
Midwest: 45
South: 45
West: 51
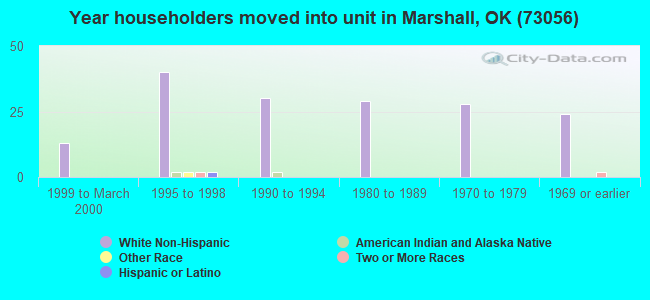
67% of the 73056 zip code residents lived in the same house 5 years ago. Out of people who lived in different houses, 56% lived in this county. Out of people who lived in different counties, 50% lived in Oklahoma.
99% of the 73056 zip code residents lived in the same house 1 year ago. Out of people who lived in different houses, 183% moved from different county within same state.
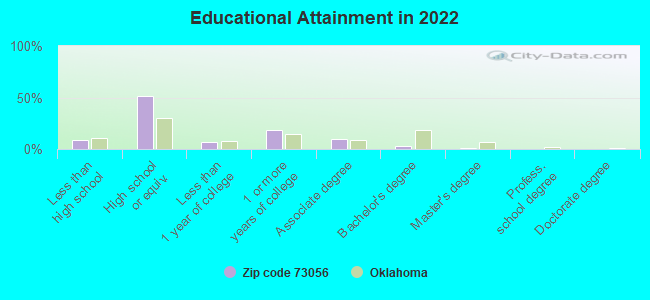
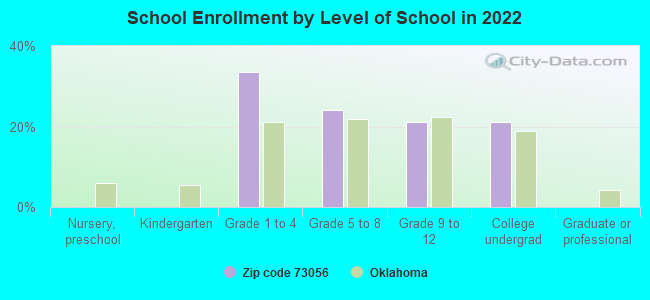
Private vs. public school enrollment:
Students in private schools in grades 1 to 8 (elementary and middle school): 8
Here:
10.4%
Oklahoma:
11.7%
Students in private schools in grades 9 to 12 (high school):
Here:
0.0%
Oklahoma:
11.7%
Students in private undergraduate colleges:
Here:
0.0%
Oklahoma:
19.3%
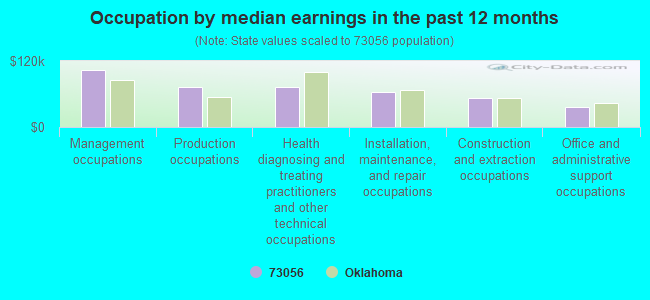
Occupation by median earnings in the past 12 months ($)
103,306Management occupations
73,137Production occupations
72,010Health diagnosing and treating practitioners and other technical occupations
63,444Installation, maintenance, and repair occupations
53,455Construction and extraction occupations
37,107Office and administrative support occupations
Top industries in this zip code by the number of employees in 2005:
Wholesale Trade: Grain and Field Bean Merchant Wholesalers (10-19 employees: 1 establishment)
Mining: Support Activities for Oil and Gas Operations (1-4: 1)
Other Services (except Public Administration): General Automotive Repair (1-4: 1)
Fatal accident statistics in 2014:
Fatal accident count: 1
Vehicles involved in fatal accidents: 2
Fatal accidents caused by drunken drivers: 0
Fatalities: 1
Persons involved in fatal accidents: 3
Pedestrians involved in fatal accidents: 0
Fatal accident statistics in 2012:
Fatal accident count: 1
Vehicles involved in fatal accidents: 2
Fatal accidents caused by drunken drivers: 1
Fatalities: 1
Persons involved in fatal accidents: 5
Pedestrians involved in fatal accidents: 0
Home Mortgage Disclosure Act Aggregated Statistics For Year 2009 (Based on 2 partial tracts)
A) FHA, FSA/RHS & VA Home Purchase Loans
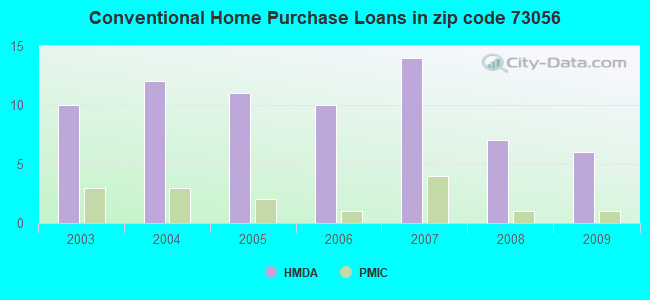
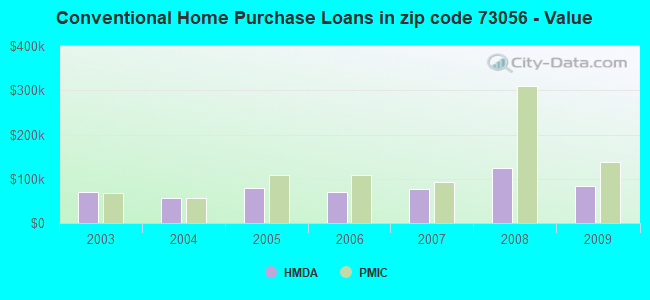
B) Conventional Home Purchase Loans
C) Refinancings
D) Home Improvement Loans
F) Non-occupant Loans on < 5 Family Dwellings (A B C & D)
G) Loans On Manufactured Home Dwelling (A B C & D)
Number
Average Value
Number
Average Value
Number
Average Value
Number
Average Value
Number
Average Value
Number
Average Value
LOANS ORIGINATED
7
$100,617
6
$82,728
16
$110,741
4
$24,310
5
$66,302
4
$56,848
APPLICATIONS APPROVED, NOT ACCEPTED
1
$36,800
0
$0
1
$51,760
1
$4,790
0
$0
1
$28,720
APPLICATIONS DENIED
2
$181,015
4
$82,802
7
$104,121
3
$8,177
0
$0
3
$66,223
APPLICATIONS WITHDRAWN
1
$112,500
1
$84,370
6
$120,078
0
$0
1
$119,680
1
$76,890
FILES CLOSED FOR INCOMPLETENESS
0
$0
1
$105,920
1
$119,680
0
$0
0
$0
0
$0
Aggregated Statistics For Year 2008 (Based on 2 partial tracts)
A) FHA, FSA/RHS & VA Home Purchase Loans
B) Conventional Home Purchase Loans
C) Refinancings
D) Home Improvement Loans
F) Non-occupant Loans on < 5 Family Dwellings (A B C & D)
G) Loans On Manufactured Home Dwelling (A B C & D)
Number
Average Value
Number
Average Value
Number
Average Value
Number
Average Value
Number
Average Value
Number
Average Value
LOANS ORIGINATED
3
$86,070
7
$124,424
14
$94,569
4
$25,132
3
$63,230
6
$77,842
APPLICATIONS APPROVED, NOT ACCEPTED
0
$0
1
$78,990
1
$28,420
0
$0
0
$0
0
$0
APPLICATIONS DENIED
0
$0
3
$57,847
7
$90,187
4
$43,160
0
$0
1
$102,330
APPLICATIONS WITHDRAWN
0
$0
1
$131,350
5
$130,032
1
$11,070
1
$58,340
1
$85,270
FILES CLOSED FOR INCOMPLETENESS
1
$103,520
0
$0
1
$26,630
0
$0
0
$0
0
$0
Aggregated Statistics For Year 2007 (Based on 2 partial tracts)
A) FHA, FSA/RHS & VA Home Purchase Loans
B) Conventional Home Purchase Loans
C) Refinancings
D) Home Improvement Loans
F) Non-occupant Loans on < 5 Family Dwellings (A B C & D)
G) Loans On Manufactured Home Dwelling (A B C & D)
Number
Average Value
Number
Average Value
Number
Average Value
Number
Average Value
Number
Average Value
Number
Average Value
LOANS ORIGINATED
1
$114,590
14
$77,044
14
$102,989
6
$25,980
5
$29,740
8
$53,182
APPLICATIONS APPROVED, NOT ACCEPTED
0
$0
2
$33,660
1
$109,810
1
$31,120
0
$0
2
$46,375
APPLICATIONS DENIED
1
$60,140
5
$71,390
11
$100,341
7
$37,059
1
$38,300
3
$62,033
APPLICATIONS WITHDRAWN
0
$0
1
$32,910
4
$87,368
0
$0
0
$0
1
$51,160
FILES CLOSED FOR INCOMPLETENESS
0
$0
0
$0
2
$88,265
0
$0
0
$0
0
$0
Aggregated Statistics For Year 2006 (Based on 2 partial tracts)
A) FHA, FSA/RHS & VA Home Purchase Loans
B) Conventional Home Purchase Loans
C) Refinancings
D) Home Improvement Loans
F) Non-occupant Loans on < 5 Family Dwellings (A B C & D)
G) Loans On Manufactured Home Dwelling (A B C & D)
Number
Average Value
Number
Average Value
Number
Average Value
Number
Average Value
Number
Average Value
Number
Average Value
LOANS ORIGINATED
4
$88,938
10
$69,863
20
$85,436
7
$41,546
8
$33,361
6
$52,560
APPLICATIONS APPROVED, NOT ACCEPTED
0
$0
3
$83,177
4
$83,028
0
$0
1
$27,230
1
$102,030
APPLICATIONS DENIED
1
$43,980
9
$78,657
17
$92,734
6
$19,797
3
$38,397
3
$53,957
APPLICATIONS WITHDRAWN
0
$0
3
$43,183
7
$69,799
0
$0
1
$36,200
1
$26,630
FILES CLOSED FOR INCOMPLETENESS
0
$0
1
$94,850
3
$90,260
0
$0
0
$0
0
$0
Aggregated Statistics For Year 2005 (Based on 2 partial tracts)
A) FHA, FSA/RHS & VA Home Purchase Loans
B) Conventional Home Purchase Loans
C) Refinancings
D) Home Improvement Loans
F) Non-occupant Loans on < 5 Family Dwellings (A B C & D)
G) Loans On Manufactured Home Dwelling (A B C & D)
Number
Average Value
Number
Average Value
Number
Average Value
Number
Average Value
Number
Average Value
Number
Average Value
LOANS ORIGINATED
2
$67,470
11
$79,152
26
$68,195
6
$22,092
7
$63,131
5
$49,786
APPLICATIONS APPROVED, NOT ACCEPTED
0
$0
5
$59,600
4
$96,418
1
$5,980
1
$44,580
2
$49,665
APPLICATIONS DENIED
1
$65,520
7
$45,691
18
$63,447
3
$15,657
0
$0
5
$38,418
APPLICATIONS WITHDRAWN
1
$27,830
5
$56,548
9
$71,442
1
$66,420
0
$0
1
$49,070
FILES CLOSED FOR INCOMPLETENESS
0
$0
1
$39,490
0
$0
1
$19,450
0
$0
0
$0
Aggregated Statistics For Year 2004 (Based on 2 partial tracts)
A) FHA, FSA/RHS & VA Home Purchase Loans
B) Conventional Home Purchase Loans
C) Refinancings
D) Home Improvement Loans
F) Non-occupant Loans on < 5 Family Dwellings (A B C & D)
G) Loans On Manufactured Home Dwelling (A B C & D)
Number
Average Value
Number
Average Value
Number
Average Value
Number
Average Value
Number
Average Value
Number
Average Value
LOANS ORIGINATED
3
$77,393
12
$55,851
19
$62,911
6
$25,782
3
$36,103
5
$72,048
APPLICATIONS APPROVED, NOT ACCEPTED
0
$0
1
$299,800
2
$169,645
1
$5,090
0
$0
0
$0
APPLICATIONS DENIED
2
$50,415
7
$74,459
15
$73,743
4
$31,042
1
$42,490
5
$72,766
APPLICATIONS WITHDRAWN
0
$0
1
$183,710
6
$62,732
0
$0
0
$0
0
$0
FILES CLOSED FOR INCOMPLETENESS
0
$0
1
$69,120
1
$92,150
0
$0
0
$0
0
$0
Aggregated Statistics For Year 2003 (Based on 2 partial tracts)
A) FHA, FSA/RHS & VA Home Purchase Loans
B) Conventional Home Purchase Loans
C) Refinancings
D) Home Improvement Loans
F) Non-occupant Loans on < 5 Family Dwellings (A B C & D)
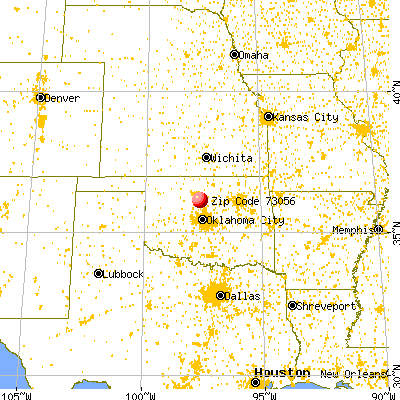


 Nearest zip codes: 73733, 73730, 73736, 73028, 73757, 73073.