Estimated zip code population in 2022: 3,165 Zip code population in 2010: 3,053 Zip code population in 2000: 3,186
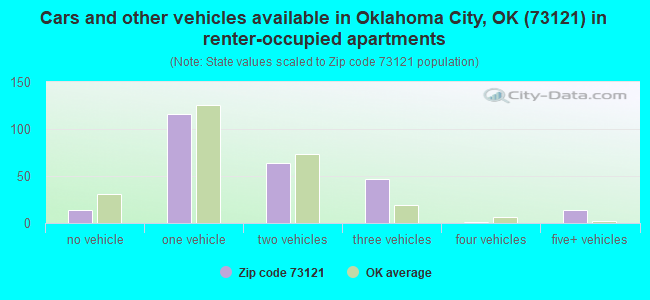
Houses and condos: 1,579 Renter-occupied apartments: 261
% of renters here:
19%
State:
35%
March 2022 cost of living index in zip code 73121: 85.2 (less than average, U.S. average is 100)
Land area: 10.0 sq. mi. Water area: 0.0 sq. mi.
Population density: 315 people per square mile
(very low).
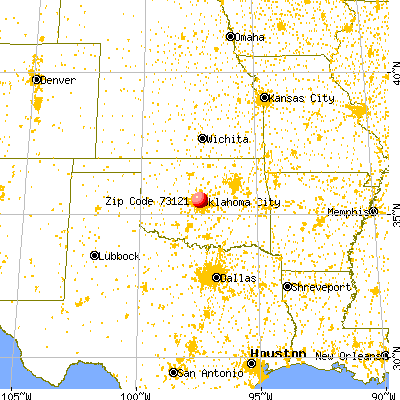
OSM Map
General Map
Google Map
MSN Map
OSM Map
General Map
Google Map
MSN Map
OSM Map
General Map
Google Map
MSN Map
OSM Map
General Map
Google Map
MSN Map
Please wait while loading the map...
Real estate property taxes paid for housing units in 2022:
This zip code:
0.7% ($1,850)
Oklahoma:
0.8% ($1,501)
Median real estate property taxes paid for housing units with mortgages in 2022: $2,556 (0.9%) Median real estate property taxes paid for housing units with no mortgage in 2022: $1,612 (0.7%)
Business Search- 14 Million verified businesses
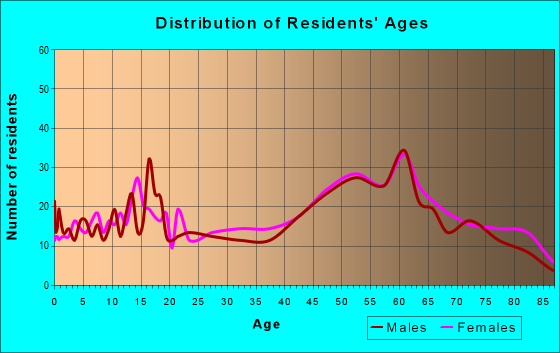
Males: 1,444
(45.6%)
Females: 1,721
(54.4%)
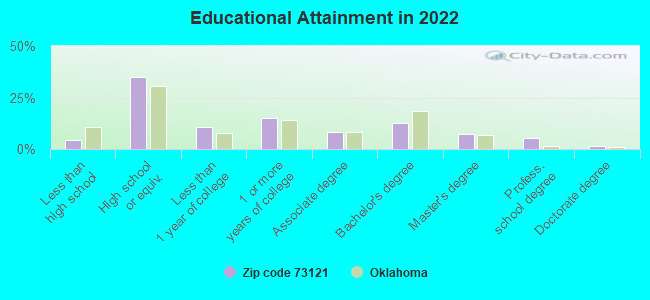
For population 25 years and over in 73121:
High school or higher: 95.3%
Bachelor's degree or higher: 26.6%
Graduate or professional degree: 13.9%
Unemployed: 2.7%
Mean travel time to work (commute): 20.3 minutes
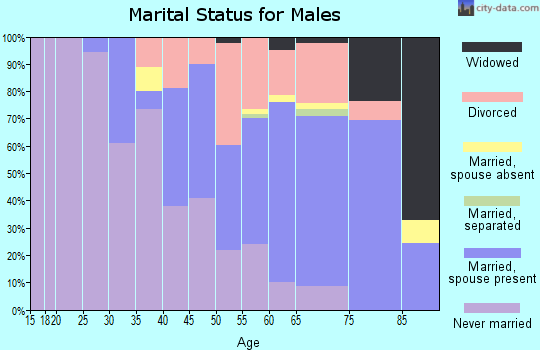
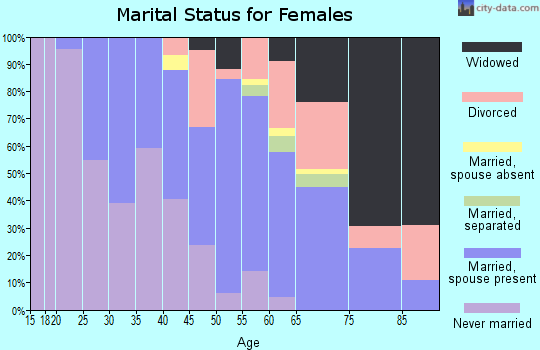
For population 15 years and over in 73121:
Never married: 32.6%
Now married: 46.4%
Separated: 1.0%
Widowed: 5.5%
Divorced: 14.6%
Zip code 73121 compared to state average:
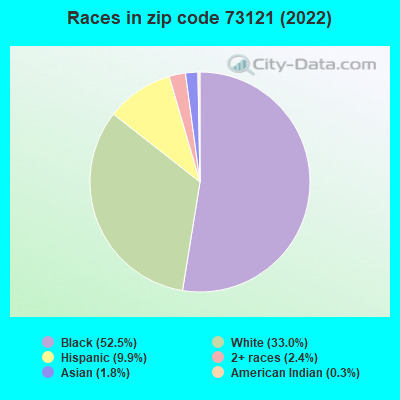
Black race population percentage significantly above state average.
Median age significantly above state average.
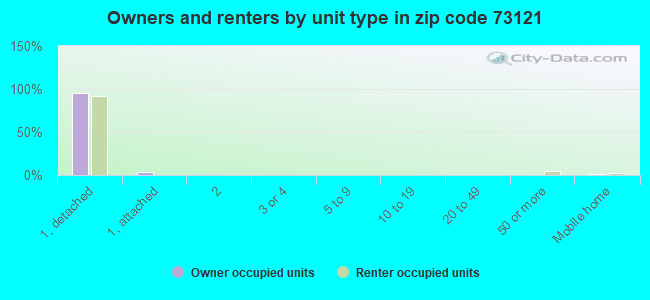
Renting percentage below state average.
Length of stay since moving in significantly above state average.
Averages for the 2020 tax year for zip code 73121, filed in 2021:
Average Adjusted Gross Income (AGI) in 2020: $75,097 (Individual Income Tax Returns)
Here:
$75,097
State:
$63,060
Salary/wage: $50,164 (reported on 75.5% of returns)
Here:
$50,164
State:
$52,427
(% of AGI for various income ranges: 1242.1% for AGIs below $25k, 3480.0% for AGIs $25k-50k, 6623.1% for AGIs $50k-75k, 8436.7% for AGIs $75k-100k, 13666.7% for AGIs $100k-200k)
Taxable interest for individuals: $1,945 (reported on 28.4% of returns)
This zip code:
$1,945
Oklahoma:
$1,603
(% of AGI for various income ranges: 3.7% for AGIs below $25k, 9.7% for AGIs $25k-50k, 45.4% for AGIs $50k-75k, 52.2% for AGIs $75k-100k, 103.3% for AGIs $100k-200k)
Ordinary dividends: $5,505 (reported on 12.9% of returns)
Here:
$5,505
State:
$7,001
(% of AGI for various income ranges: 13.9% for AGIs $25k-50k, 19.2% for AGIs $50k-75k, 112.2% for AGIs $75k-100k, 343.3% for AGIs $100k-200k)
Net capital gain/loss in AGI: +$17,676 (reported on 11.0% of returns)
Here:
+$17,676
State:
+$19,855
(% of AGI for various income ranges: 12.6% for AGIs $25k-50k, 308.9% for AGIs $75k-100k, 1012.2% for AGIs $100k-200k)
Profit/loss from business: +$6,647 (reported on 21.9% of returns)
Here:
+$6,647
State:
+$9,904
(% of AGI for various income ranges: 36.0% for AGIs below $25k, 130.3% for AGIs $25k-50k, 256.2% for AGIs $50k-75k, 166.7% for AGIs $75k-100k, 386.7% for AGIs $100k-200k)
Taxable individual retirement arrangement distribution: $24,075 (reported on 7.7% of returns)
73121:
$24,075
Oklahoma:
$20,476
(% of AGI for various income ranges: 99.0% for AGIs $25k-50k, 251.5% for AGIs $50k-75k, 412.2% for AGIs $75k-100k, 2093.3% for AGIs $100k-200k)
Total itemized deductions: $33,520 (reported on 12.9% of returns)
Here:
$33,520
State:
$39,736
(% of AGI for various income ranges: 263.2% for AGIs $25k-50k, 710.0% for AGIs $50k-75k, 982.2% for AGIs $75k-100k, 1844.4% for AGIs $100k-200k)
Charity contributions: $13,082 (reported on 11.0% of returns)
Here:
$13,082
State:
$17,288
(% of AGI for various income ranges: 62.9% for AGIs $25k-50k, 183.8% for AGIs $50k-75k, 256.7% for AGIs $75k-100k, 738.9% for AGIs $100k-200k)
Taxes paid: $5,915 (reported on 12.9% of returns)
73121:
$5,915
State:
$7,046
(% of AGI for various income ranges: 50.3% for AGIs $25k-50k, 123.1% for AGIs $50k-75k, 191.1% for AGIs $75k-100k, 400.0% for AGIs $100k-200k)
Earned income credit: $2,387 (reported on 20.0% of returns)
Here:
$2,387
State:
$2,435
(% of AGI for various income ranges: 123.3% for AGIs below $25k, 67.7% for AGIs $25k-50k)
Percentage of individuals using paid preparers for their 2020 taxes: 89.0%
Here:
89%
State:
94%
(% for various income ranges: 91.1% for AGIs below $25k, 90.2% for AGIs $25k-50k, 86.4% for AGIs $50k-75k, 85.7% for AGIs $75k-100k, 81.2% for AGIs $100k-200k, 100.0% for AGIs over 200k)
Averages for the 2012 tax year for zip code 73121, filed in 2013:
Average Adjusted Gross Income (AGI) in 2012: $71,881 (Individual Income Tax Returns)
Here:
$71,881
State:
$58,581
Salary/wage: $42,510 (reported on 80.0% of returns)
Here:
$42,510
State:
$45,973
(% of AGI for various income ranges: 75.2% for AGIs below $25k, 69.3% for AGIs $25k-50k, 63.6% for AGIs $50k-75k, 57.1% for AGIs $75k-100k, 62.2% for AGIs $100k-200k, 26.0% for AGIs over 200k)
Taxable interest for individuals: $2,624 (reported on 30.0% of returns)
This zip code:
$2,624
Oklahoma:
$1,625
(% of AGI for various income ranges: 0.5% for AGIs below $25k, 0.6% for AGIs $25k-50k, 0.4% for AGIs $50k-75k, 0.6% for AGIs $75k-100k, 0.4% for AGIs $100k-200k, 1.8% for AGIs over 200k)
Ordinary dividends: $4,670 (reported on 13.3% of returns)
Here:
$4,670
State:
$6,374
(% of AGI for various income ranges: 0.1% for AGIs below $25k, 0.1% for AGIs $25k-50k, 0.5% for AGIs $50k-75k, 0.3% for AGIs $75k-100k, 1.1% for AGIs $100k-200k, 1.3% for AGIs over 200k)
Net capital gain/loss in AGI: +$28,493 (reported on 10.0% of returns)
Here:
+$28,493
State:
+$24,023
(% of AGI for various income ranges: 0.5% for AGIs $50k-75k, 0.3% for AGIs $100k-200k, 8.5% for AGIs over 200k)
Profit/loss from business: +$7,404 (reported on 18.7% of returns)
Here:
+$7,404
State:
+$11,913
(% of AGI for various income ranges: 7.5% for AGIs below $25k, 2.2% for AGIs $25k-50k, 1.6% for AGIs $50k-75k, 2.9% for AGIs $75k-100k, 4.6% for AGIs $100k-200k)
Taxable individual retirement arrangement distribution: $18,721 (reported on 9.3% of returns)
73121:
$18,721
Oklahoma:
$15,242
(% of AGI for various income ranges: 3.8% for AGIs $25k-50k, 5.4% for AGIs $50k-75k, 9.3% for AGIs $100k-200k)
Total itemized deductions: $26,186 (17% of AGI, reported on 34.0% of returns)
Here:
$26,186
State:
$24,882
Here:
16.6% of AGI
State:
18.8% of AGI
(% of AGI for various income ranges: 9.4% for AGIs below $25k, 13.4% for AGIs $25k-50k, 20.2% for AGIs $50k-75k, 16.0% for AGIs $75k-100k, 17.7% for AGIs $100k-200k, 8.2% for AGIs over 200k)
Charity contributions: $7,070 (reported on 31.3% of returns)
Here:
$7,070
State:
$6,591
(% of AGI for various income ranges: 1.8% for AGIs below $25k, 3.5% for AGIs $25k-50k, 4.5% for AGIs $50k-75k, 4.6% for AGIs $75k-100k, 5.5% for AGIs $100k-200k, 1.8% for AGIs over 200k)
Taxes paid: $9,169 (reported on 34.0% of returns)
73121:
$9,169
State:
$7,196
(% of AGI for various income ranges: 1.6% for AGIs below $25k, 2.4% for AGIs $25k-50k, 4.9% for AGIs $50k-75k, 3.7% for AGIs $75k-100k, 5.1% for AGIs $100k-200k, 5.1% for AGIs over 200k)
Earned income credit: $2,348 (reported on 22.0% of returns)
Here:
$2,348
State:
$2,354
(% of AGI for various income ranges: 7.8% for AGIs below $25k, 1.1% for AGIs $25k-50k)
Percentage of individuals using paid preparers for their 2012 taxes: 57.3%
Here:
57%
State:
56%
(% for various income ranges: 52.3% for AGIs below $25k, 54.1% for AGIs $25k-50k, 65.0% for AGIs $50k-75k, 63.6% for AGIs $75k-100k, 66.7% for AGIs $100k-200k, 80.0% for AGIs over 200k)
Averages for the 2004 tax year for zip code 73121, filed in 2005:
Average Adjusted Gross Income (AGI) in 2004: $51,762 (Individual Income Tax Returns)
Here:
$51,762
State:
$41,245
Salary/wage: $37,317 (reported on 77.6% of returns)
Here:
$37,317
State:
$35,318
(% of AGI for various income ranges: 102.6% for AGIs below $10k, 71.0% for AGIs $10k-25k, 71.9% for AGIs $25k-50k, 63.0% for AGIs $50k-75k, 68.4% for AGIs $75k-100k, 40.6% for AGIs over 100k)
Taxable interest for individuals: $3,180 (reported on 38.6% of returns)
This zip code:
$3,180
Oklahoma:
$1,745
(% of AGI for various income ranges: 7.2% for AGIs below $10k, 1.4% for AGIs $10k-25k, 1.1% for AGIs $25k-50k, 1.3% for AGIs $50k-75k, 1.3% for AGIs $75k-100k, 3.4% for AGIs over 100k)
Taxable dividends: $4,120 (reported on 18.0% of returns)
Here:
$4,120
State:
$2,920
(% of AGI for various income ranges: 0.9% for AGIs below $10k, 0.3% for AGIs $10k-25k, 0.6% for AGIs $25k-50k, 0.7% for AGIs $50k-75k, 0.1% for AGIs $75k-100k, 2.5% for AGIs over 100k)
Net capital gain/loss: +$8,166 (reported on 11.7% of returns)
Here:
+$8,166
State:
+$10,653
(% of AGI for various income ranges: -2.2% for AGIs below $10k, -0.3% for AGIs $10k-25k, -0.3% for AGIs $25k-50k, 0.7% for AGIs $50k-75k, 0.9% for AGIs $75k-100k, 3.8% for AGIs over 100k)
Profit/loss from business: +$9,731 (reported on 18.3% of returns)
Here:
+$9,731
State:
+$8,532
(% of AGI for various income ranges: 9.9% for AGIs below $10k, 3.2% for AGIs $10k-25k, 1.6% for AGIs $25k-50k, 1.7% for AGIs $50k-75k, -0.8% for AGIs $75k-100k, 5.3% for AGIs over 100k)
IRA payment deduction: $3,429 (reported on 1.0% of returns)
73121:
$3,429
Oklahoma:
$3,127
Total itemized deductions: $18,974 (21% of AGI, reported on 40.4% of returns)
Here:
$18,974
State:
$17,093
Here:
21.1% of AGI
State:
20.5% of AGI
(% of AGI for various income ranges: 13.3% for AGIs below $10k, 13.3% for AGIs $10k-25k, 18.2% for AGIs $25k-50k, 20.7% for AGIs $50k-75k, 19.8% for AGIs $75k-100k, 11.1% for AGIs over 100k)
Charity contributions deductions: $5,616 (6% of AGI, reported on 36.4% of returns)
Here:
$5,616
State:
$4,240
Here:
6.3% of AGI
State:
4.8% of AGI
(% of AGI for various income ranges: 1.6% for AGIs below $10k, 3.0% for AGIs $10k-25k, 4.2% for AGIs $25k-50k, 6.0% for AGIs $50k-75k, 5.5% for AGIs $75k-100k, 3.2% for AGIs over 100k)
Total tax: $9,859 (reported on 70.3% of returns)
73121:
$9,859
State:
$6,542
(% of AGI for various income ranges: 3.1% for AGIs below $10k, 3.4% for AGIs $10k-25k, 6.4% for AGIs $25k-50k, 9.3% for AGIs $50k-75k, 10.3% for AGIs $75k-100k, 20.3% for AGIs over 100k)
Earned income credit: $1,835 (reported on 24.0% of returns)
Here:
$1,835
State:
$1,830
Percentage of individuals using paid preparers for their 2004 taxes: 63.9%
Here:
64%
State:
63%
(% for various income ranges: 63.7% for AGIs below $10k, 64.0% for AGIs $10k-25k, 61.7% for AGIs $25k-50k, 62.6% for AGIs $50k-75k, 55.7% for AGIs $75k-100k, 79.5% for AGIs over 100k)
Likely homosexual households (counted as self-reported same-sex unmarried-partner households)
Lesbian couples: 1.0% of all households
Gay men: 0.0% of all households
Household received Food Stamps/SNAP in the past 12 months: 264 Household did not receive Food Stamps/SNAP in the past 12 months: 1,112
Women who had a birth in the past 12 months: 49 (28 now married, 20 unmarried) Women who did not have a birth in the past 12 months: 588 (176 now married, 412 unmarried)
Housing units in zip code 73121 with a mortgage: 491 (44 second mortgage, 42 both second mortgage and home equity loan) Median monthly owner costs for units with a mortgage: $1,687 Median monthly owner costs for units without a mortgage: $468
Residents with income below the poverty level in 2022:
This zip code:
12.2%
Whole state:
15.7%
Residents with income below 50% of the poverty level in 2022:
This zip code:
4.1%
Whole state:
8.3%
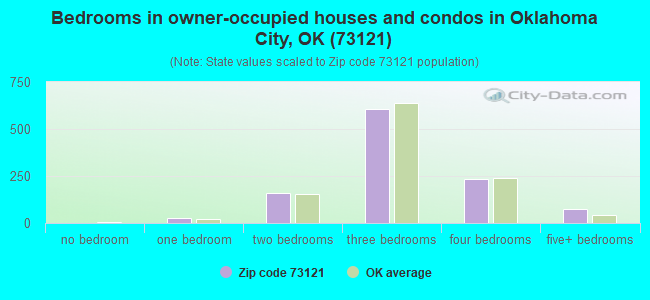
Median number of rooms in houses and condos:
Here:
6.2
State:
6.1
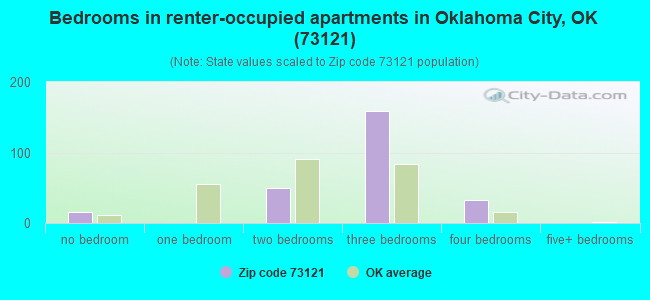
Median number of rooms in apartments:
Here:
6.5
State:
4.5
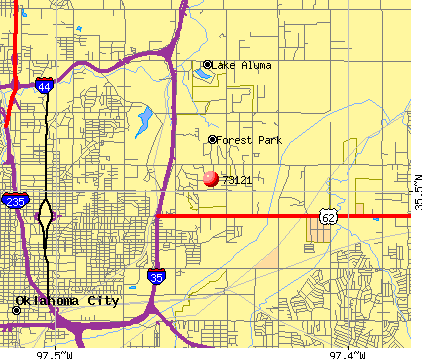
Notable locations in this zip code not listed on our city pages
Churches in zip code 73121 include: United Church (A), Mimosa Heights Church (B), Pilgrim Rest Church (C), Vien Grac Buddhist Temple (D), Sunnylane Missionary Baptist Church (E), Saint Mathews Primitive Baptist Church (F), Paradise Baptist Church (G), Northeast Missionary Baptist Church (H), Greater Marshall Memorial Baptist Church (I). Display/hide their locations on the map
Cemeteries: Rogan Cemetery (1), Riverside Gardens Cemetery (2), East View Cemetery (3), Pilgrim Rest Cemetery (4), Trice Hill Cemetery (5). Display/hide their locations on the map
247 married couples with children.
72 single-parent households (26 men, 46 women).
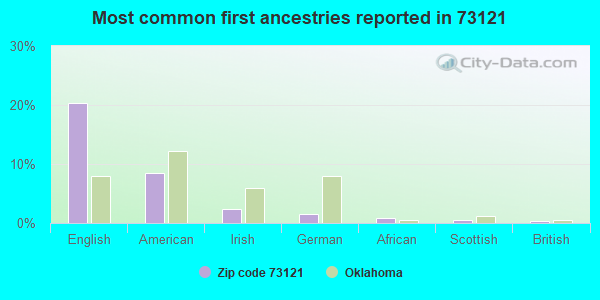
90.4% of residents of 73121 zip code speak English at home.
8.6% of residents speak Spanish at home (64% very well, 28% well, 7% not well, 1% not at all).
0.4% of residents speak other Indo-European language at home (100% very well).
1.1% of residents speak Asian or Pacific Island language at home (68% very well, 6% well, 26% not well).
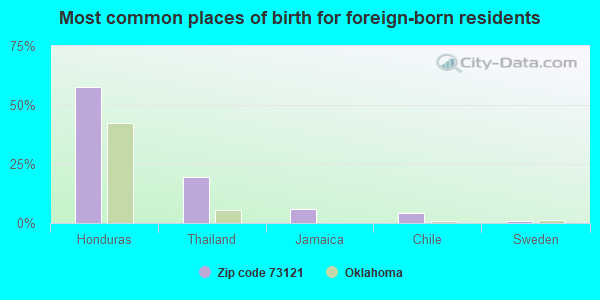
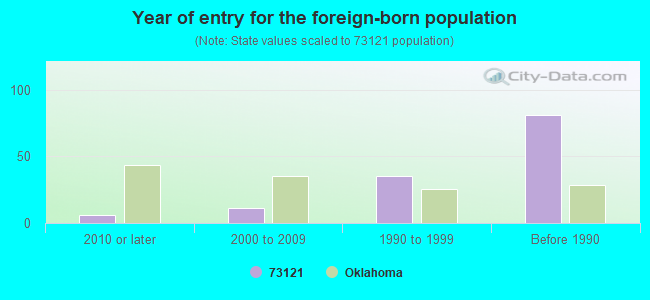
Foreign born population: 139 (4.4%) (60.2% of them are naturalized citizens)
Facilities with environmental interests located in this zip code:
BRAUM WH INC/BAKERY (6200 N BRYANT in OKLAHOMA CITY, OK)
AIR MINOR (AIRS/AFS) Business SIC classification: BREAD AND OTHER BAKERY PRODUCTS, EXCEPT COOKIES AND CRACKERS
ARROW PIPE SVC (7115 N BRYANT in OKLAHOMA CITY, OK)
Conditionally Exempt Small Quantity Generators, less than 100 kg/month of hazardous waste (Resource Conservation and Recovery Act (tracking hazardous waste)) - notification Organizations: JOE CUNNINGHAM (CONTACT/OWNER)
GILBERT CENTRAL OKLAHOMA (3591 NE 50TH ST in OKLAHOMA CITY, OK)
Conditionally Exempt Small Quantity Generators, less than 100 kg/month of hazardous waste (Resource Conservation and Recovery Act (tracking hazardous waste)) - notification Organizations: SOUTH PRAIRIE CONSTR (CONTACT/OWNER)
Alternative names: GILBERT CENTRAL CON 3591 N E 50TH
DUKE ENERGY FIELD S WITCHER COMPRESSOR S (6900 N. BRYANT in OKLAHOMA CITY, OK)
CRITERIA AND HAZARDOUS AIR POLLUTANT INVENTORY (Inventory of air pollution sources) Business SIC classification: NATURAL GAS TRANSMISSION Alternative names: DUKE ENERGY/6900 N. BRYAN
Housing units lacking complete plumbing facilities: 6.4% Housing units lacking complete kitchen facilities: 7.5%
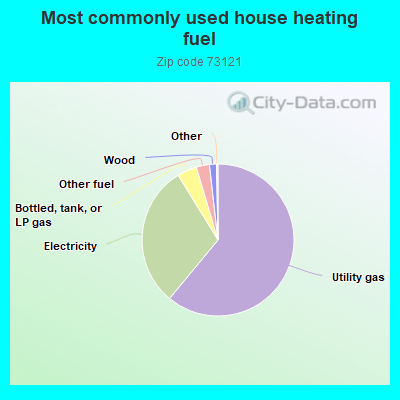
61.2%Utility gas
30.3%Electricity
4.2%Bottled, tank, or LP gas
2.8%Other fuel
1.5%Wood
Population in 1990: 3,134. Population change in the 1990s: +52 (+1.7%).
Place of birth for U.S.-born residents:
This state: 2,297
Northeast: 32
Midwest: 257
South: 325
West: 89
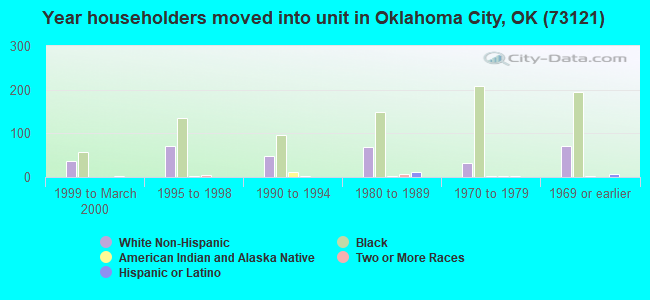
71% of the 73121 zip code residents lived in the same house 5 years ago. Out of people who lived in different houses, 69% lived in this county. Out of people who lived in different counties, 50% lived in Oklahoma.
89% of the 73121 zip code residents lived in the same house 1 year ago. Out of people who lived in different houses, 63% moved from this county. Out of people who lived in different houses, 24% moved from different county within same state. Out of people who lived in different houses, 8% moved from different state.
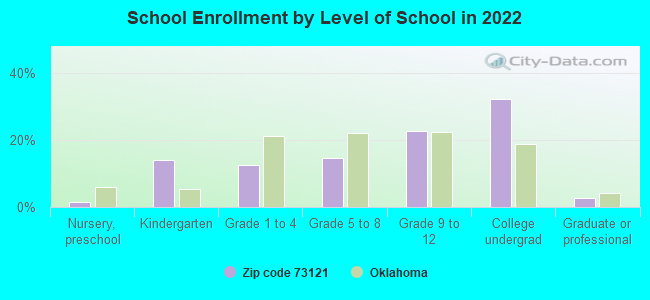
Private vs. public school enrollment:
Students in private schools in grades 1 to 8 (elementary and middle school): 49
Here:
33.7%
Oklahoma:
11.7%
Students in private schools in grades 9 to 12 (high school): 48
Here:
38.3%
Oklahoma:
11.7%
Students in private undergraduate colleges: 36
Here:
21.0%
Oklahoma:
19.3%
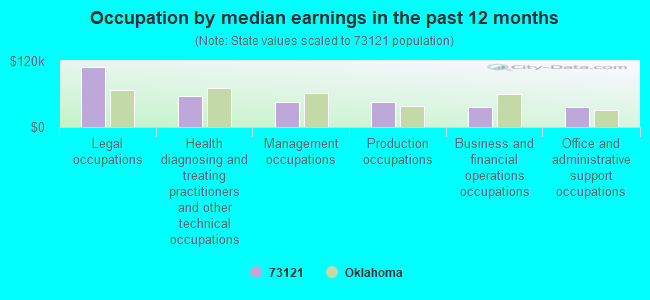
Occupation by median earnings in the past 12 months ($)
109,698Legal occupations
56,752Health diagnosing and treating practitioners and other technical occupations
46,068Management occupations
44,769Production occupations
36,741Business and financial operations occupations
35,742Office and administrative support occupations
Companies with federal contracts located in this zip code (OKLAHOMA CITY, OK):
HERTZ EQUIPMENT RENTAL CORPORA (5222 N BRYANT AVENUE) : $677,625 in 20 contractsfrom 2002 to 2006
Contracts for Motor Vehicle Maintenance and Repair Shop Specialized Equipment, Lease or Rental of Equipment -- Ground Effect Vehicles, Motor Vehicles, Trailers, and Cycles, Lease or Rental of Equipment -- Materials Handling Equipment, Lease or Rental of Equipment -- Weapons, and moreby Air Force, Navy, Army, National Park Service, and others Signed by year:2000: $0; 2001: $0; 2002: $82,687; 2003: $374,716; 2004: $71,700; 2005: $86,435; 2006: $62,087.
Biggest contracts:
$317,420 with Air Force for Motor Vehicle Maintenance and Repair Shop Specialized Equipment. Signed on 2003-11-18. Completion date: 2004-11-30.
$51,911 with Navy for Lease or Rental of Equipment -- Ground Effect Vehicles, Motor Vehicles, Trailers, and Cycles. Signed on 2003-12-09. Completion date: 2004-03-31.
$50,940 with Air Force for Lease or Rental of Equipment -- Materials Handling Equipment. Signed on 2006-07-12. Completion date: 2007-06-13.
$47,400, same as above.Signed on 2005-05-29. Completion date: 2006-05-29.
BLASTRAC N A , INC (6215 ALUMA VALLEY DR; small business) : $363,038 in 12 contractsfrom 2003 to 2006
Contracts for Non-nuclear Ship Repair (West) Ship repair (including overhauls and conversions) performed on. non-nuclear propelled and nonpropelled ships west of the 108th meridian, Hose and Flexible Tubing by Navy Signed by year:2000: $0; 2001: $0; 2002: $0; 2003: $113,648; 2004: $0; 2005: $207,371; 2006: $42,019.
Biggest contracts:
$82,500 with Navy for Non-nuclear Ship Repair (West) Ship repair (including overhauls and conversions) performed on. non-nuclear propelled and nonpropelled ships west of the 108th meridian. Signed on 2003-01-13. Completion date: 2003-03-01.
$42,019 with Navy for Non-nuclear Ship Repair (West) Ship repair (including overhauls and conversions) performed on. non-nuclear propelled and nonpropelled ships west of the 108th meridian. Taking place in CA. Signed on 2006-03-15. Completion date: 2006-03-23.
$39,140, same as above.Signed on 2005-09-21. Completion date: 2005-12-01.
$38,250 with Navy for Non-nuclear Ship Repair (West) Ship repair (including overhauls and conversions) performed on. non-nuclear propelled and nonpropelled ships west of the 108th meridian. Signed on 2005-08-01. Completion date: 2005-08-29.
M & M DOCUMENT SYSTEMS INC (1 OAKWOOD DR; small business) : $211,893 in 6 contractsfrom 2001 to 2005
Contracts for Other Administrative Support Services, Food Items For Resale, ADP Software, ADP Facility Operation and Maintenance Services by Army, Department of Defense Signed by year:2000: $0; 2001: $36,600; 2002: $0; 2003: -$28,555; 2004: $0; 2005: $203,848; 2006: $0.
Biggest contracts:
$137,088 with Army for Other Administrative Support Services. Signed on 2005-11-30. Completion date: 2006-09-30.
$79,968, same as above.Signed on 2005-02-17. Completion date: 2005-09-30.
$36,600 with Department of Defense for Food Items For Resale. Signed on 2001-03-21. Completion date: 2002-02-11.
$0 with Department of Defense for ADP Software. Signed on 2005-03-05. Completion date: 2005-03-05.
BRAUM, W H INC (3000 NE 63RD ST; small business)
$4,500 with Army for Food Items For Resale. Taking place in AR. Signed on 2002-09-06. Completion date: 2002-09-06.
INTERNATIONAL PIPE & SUPPLY LL (3300 NE 60TH ST; small business) : $0 in 2 contractsin 2004
$35,245 with Army for Pipe, Tube and Rigid Tubing. Signed on 2004-02-17. Completion date: 2004-02-24.
-$35,245, same as above.Signed on 2004-02-18. Completion date: 2004-02-24.
Top industries in this zip code by the number of employees in 2005:
Management of Companies and Enterprises: Corporate, Subsidiary, and Regional Managing Offices (50-99 employees: 1 establishment, 5-9 employees: 2 establishments)
Health Care and Social Assistance: Nursing Care Facilities (50-99: 1, 1-4: 1)
Arts, Entertainment, and Recreation: Promoters of Performing Arts, Sports, and Similar Events without Facilities (50-99: 1)
Professional, Scientific, and Technical Services: Offices of Certified Public Accountants (50-99: 1)
Arts, Entertainment, and Recreation: All Other Amusement and Recreation Industries (50-99: 1)
Other Services (except Public Administration): Automotive Body, Paint, and Interior Repair and Maintenance (20-49: 1, 10-19: 1)
Other Services (except Public Administration): Religious Organizations (10-19: 2, 5-9: 1, 1-4: 1)
Construction: Commercial and Institutional Building Construction (20-49: 1)
2002 - 2018 National Fire Incident Reporting System (NFIRS) incidents
Based on the data from the years 2002 - 2018 the average number of fires per year is 26. The highest number of fire incidents - 49 took place in 2011, and the least - 14 in 2002. The data has an increasing trend.
When looking into fire subcategories, the most incidents belonged to: Outside Fires (49.3%), and Structure Fires (26.9%).
Fire incident types reported to NFIRS in Zip Code 73121


 Nearest zip codes: 73111, 73141, 73117, 73151, 73105, 73131.


 Based on the data from the years 2002 - 2018 the average number of fires per year is 26. The highest number of fire incidents - 49 took place in 2011, and the least - 14 in 2002. The data has an increasing trend.
 When looking into fire subcategories, the most incidents belonged to: Outside Fires (49.3%), and Structure Fires (26.9%).