Midwest City, Oklahoma Submit your own pictures of this city and show them to the world
OSM Map
General Map
Google Map
MSN Map
OSM Map
General Map
Google Map
MSN Map
OSM Map
General Map
Google Map
MSN Map
OSM Map
General Map
Google Map
MSN Map
Please wait while loading the map...
Population in 2022: 57,950 (100% urban, 0% rural). Population change since 2000: +7.1%Males: 27,337 Females: 30,613
March 2022 cost of living index in Midwest City: 85.3 (less than average, U.S. average is 100) Percentage of residents living in poverty in 2022: 15.2%for White Non-Hispanic residents , 21.4% for Black residents , 18.6% for Hispanic or Latino residents , 20.2% for American Indian residents , 27.4% for other race residents , 17.8% for two or more races residents )
Profiles of local businesses
Business Search - 14 Million verified businesses
Data:
Median household income ($)
Median household income (% change since 2000)
Household income diversity
Ratio of average income to average house value (%)
Ratio of average income to average rent
Median household income ($) - White
Median household income ($) - Black or African American
Median household income ($) - Asian
Median household income ($) - Hispanic or Latino
Median household income ($) - American Indian and Alaska Native
Median household income ($) - Multirace
Median household income ($) - Other Race
Median household income for houses/condos with a mortgage ($)
Median household income for apartments without a mortgage ($)
Races - White alone (%)
Races - White alone (% change since 2000)
Races - Black alone (%)
Races - Black alone (% change since 2000)
Races - American Indian alone (%)
Races - American Indian alone (% change since 2000)
Races - Asian alone (%)
Races - Asian alone (% change since 2000)
Races - Hispanic (%)
Races - Hispanic (% change since 2000)
Races - Native Hawaiian and Other Pacific Islander alone (%)
Races - Native Hawaiian and Other Pacific Islander alone (% change since 2000)
Races - Two or more races (%)
Races - Two or more races (% change since 2000)
Races - Other race alone (%)
Races - Other race alone (% change since 2000)
Racial diversity
Unemployment (%)
Unemployment (% change since 2000)
Unemployment (%) - White
Unemployment (%) - Black or African American
Unemployment (%) - Asian
Unemployment (%) - Hispanic or Latino
Unemployment (%) - American Indian and Alaska Native
Unemployment (%) - Multirace
Unemployment (%) - Other Race
Population density (people per square mile)
Population - Males (%)
Population - Females (%)
Population - Males (%) - White
Population - Males (%) - Black or African American
Population - Males (%) - Asian
Population - Males (%) - Hispanic or Latino
Population - Males (%) - American Indian and Alaska Native
Population - Males (%) - Multirace
Population - Males (%) - Other Race
Population - Females (%) - White
Population - Females (%) - Black or African American
Population - Females (%) - Asian
Population - Females (%) - Hispanic or Latino
Population - Females (%) - American Indian and Alaska Native
Population - Females (%) - Multirace
Population - Females (%) - Other Race
Coronavirus confirmed cases (Apr 27, 2024)
Deaths caused by coronavirus (Apr 27, 2024)
Coronavirus confirmed cases (per 100k population) (Apr 27, 2024)
Deaths caused by coronavirus (per 100k population) (Apr 27, 2024)
Daily increase in number of cases (Apr 27, 2024)
Weekly increase in number of cases (Apr 27, 2024)
Cases doubled (in days) (Apr 27, 2024)
Hospitalized patients (Apr 18, 2022)
Negative test results (Apr 18, 2022)
Total test results (Apr 18, 2022)
COVID Vaccine doses distributed (per 100k population) (Sep 19, 2023)
COVID Vaccine doses administered (per 100k population) (Sep 19, 2023)
COVID Vaccine doses distributed (Sep 19, 2023)
COVID Vaccine doses administered (Sep 19, 2023)
Likely homosexual households (%)
Likely homosexual households (% change since 2000)
Likely homosexual households - Lesbian couples (%)
Likely homosexual households - Lesbian couples (% change since 2000)
Likely homosexual households - Gay men (%)
Likely homosexual households - Gay men (% change since 2000)
Cost of living index
Median gross rent ($)
Median contract rent ($)
Median monthly housing costs ($)
Median house or condo value ($)
Median house or condo value ($ change since 2000)
Mean house or condo value by units in structure - 1, detached ($)
Mean house or condo value by units in structure - 1, attached ($)
Mean house or condo value by units in structure - 2 ($)
Mean house or condo value by units in structure by units in structure - 3 or 4 ($)
Mean house or condo value by units in structure - 5 or more ($)
Mean house or condo value by units in structure - Boat, RV, van, etc. ($)
Mean house or condo value by units in structure - Mobile home ($)
Median house or condo value ($) - White
Median house or condo value ($) - Black or African American
Median house or condo value ($) - Asian
Median house or condo value ($) - Hispanic or Latino
Median house or condo value ($) - American Indian and Alaska Native
Median house or condo value ($) - Multirace
Median house or condo value ($) - Other Race
Median resident age
Resident age diversity
Median resident age - Males
Median resident age - Females
Median resident age - White
Median resident age - Black or African American
Median resident age - Asian
Median resident age - Hispanic or Latino
Median resident age - American Indian and Alaska Native
Median resident age - Multirace
Median resident age - Other Race
Median resident age - Males - White
Median resident age - Males - Black or African American
Median resident age - Males - Asian
Median resident age - Males - Hispanic or Latino
Median resident age - Males - American Indian and Alaska Native
Median resident age - Males - Multirace
Median resident age - Males - Other Race
Median resident age - Females - White
Median resident age - Females - Black or African American
Median resident age - Females - Asian
Median resident age - Females - Hispanic or Latino
Median resident age - Females - American Indian and Alaska Native
Median resident age - Females - Multirace
Median resident age - Females - Other Race
Commute - mean travel time to work (minutes)
Travel time to work - Less than 5 minutes (%)
Travel time to work - Less than 5 minutes (% change since 2000)
Travel time to work - 5 to 9 minutes (%)
Travel time to work - 5 to 9 minutes (% change since 2000)
Travel time to work - 10 to 19 minutes (%)
Travel time to work - 10 to 19 minutes (% change since 2000)
Travel time to work - 20 to 29 minutes (%)
Travel time to work - 20 to 29 minutes (% change since 2000)
Travel time to work - 30 to 39 minutes (%)
Travel time to work - 30 to 39 minutes (% change since 2000)
Travel time to work - 40 to 59 minutes (%)
Travel time to work - 40 to 59 minutes (% change since 2000)
Travel time to work - 60 to 89 minutes (%)
Travel time to work - 60 to 89 minutes (% change since 2000)
Travel time to work - 90 or more minutes (%)
Travel time to work - 90 or more minutes (% change since 2000)
Marital status - Never married (%)
Marital status - Now married (%)
Marital status - Separated (%)
Marital status - Widowed (%)
Marital status - Divorced (%)
Median family income ($)
Median family income (% change since 2000)
Median non-family income ($)
Median non-family income (% change since 2000)
Median per capita income ($)
Median per capita income (% change since 2000)
Median family income ($) - White
Median family income ($) - Black or African American
Median family income ($) - Asian
Median family income ($) - Hispanic or Latino
Median family income ($) - American Indian and Alaska Native
Median family income ($) - Multirace
Median family income ($) - Other Race
Median year house/condo built
Median year apartment built
Year house built - Built 2005 or later (%)
Year house built - Built 2000 to 2004 (%)
Year house built - Built 1990 to 1999 (%)
Year house built - Built 1980 to 1989 (%)
Year house built - Built 1970 to 1979 (%)
Year house built - Built 1960 to 1969 (%)
Year house built - Built 1950 to 1959 (%)
Year house built - Built 1940 to 1949 (%)
Year house built - Built 1939 or earlier (%)
Average household size
Household density (households per square mile)
Average household size - White
Average household size - Black or African American
Average household size - Asian
Average household size - Hispanic or Latino
Average household size - American Indian and Alaska Native
Average household size - Multirace
Average household size - Other Race
Occupied housing units (%)
Vacant housing units (%)
Owner occupied housing units (%)
Renter occupied housing units (%)
Vacancy status - For rent (%)
Vacancy status - For sale only (%)
Vacancy status - Rented or sold, not occupied (%)
Vacancy status - For seasonal, recreational, or occasional use (%)
Vacancy status - For migrant workers (%)
Vacancy status - Other vacant (%)
Residents with income below the poverty level (%)
Residents with income below 50% of the poverty level (%)
Children below poverty level (%)
Poor families by family type - Married-couple family (%)
Poor families by family type - Male, no wife present (%)
Poor families by family type - Female, no husband present (%)
Poverty status for native-born residents (%)
Poverty status for foreign-born residents (%)
Poverty among high school graduates not in families (%)
Poverty among people who did not graduate high school not in families (%)
Residents with income below the poverty level (%) - White
Residents with income below the poverty level (%) - Black or African American
Residents with income below the poverty level (%) - Asian
Residents with income below the poverty level (%) - Hispanic or Latino
Residents with income below the poverty level (%) - American Indian and Alaska Native
Residents with income below the poverty level (%) - Multirace
Residents with income below the poverty level (%) - Other Race
Air pollution - Air Quality Index (AQI)
Air pollution - CO
Air pollution - NO2
Air pollution - SO2
Air pollution - Ozone
Air pollution - PM10
Air pollution - PM25
Air pollution - Pb
Crime - Murders per 100,000 population
Crime - Rapes per 100,000 population
Crime - Robberies per 100,000 population
Crime - Assaults per 100,000 population
Crime - Burglaries per 100,000 population
Crime - Thefts per 100,000 population
Crime - Auto thefts per 100,000 population
Crime - Arson per 100,000 population
Crime - City-data.com crime index
Crime - Violent crime index
Crime - Property crime index
Crime - Murders per 100,000 population (5 year average)
Crime - Rapes per 100,000 population (5 year average)
Crime - Robberies per 100,000 population (5 year average)
Crime - Assaults per 100,000 population (5 year average)
Crime - Burglaries per 100,000 population (5 year average)
Crime - Thefts per 100,000 population (5 year average)
Crime - Auto thefts per 100,000 population (5 year average)
Crime - Arson per 100,000 population (5 year average)
Crime - City-data.com crime index (5 year average)
Crime - Violent crime index (5 year average)
Crime - Property crime index (5 year average)
1996 Presidential Elections Results (%) - Democratic Party (Clinton)
1996 Presidential Elections Results (%) - Republican Party (Dole)
1996 Presidential Elections Results (%) - Other
2000 Presidential Elections Results (%) - Democratic Party (Gore)
2000 Presidential Elections Results (%) - Republican Party (Bush)
2000 Presidential Elections Results (%) - Other
2004 Presidential Elections Results (%) - Democratic Party (Kerry)
2004 Presidential Elections Results (%) - Republican Party (Bush)
2004 Presidential Elections Results (%) - Other
2008 Presidential Elections Results (%) - Democratic Party (Obama)
2008 Presidential Elections Results (%) - Republican Party (McCain)
2008 Presidential Elections Results (%) - Other
2012 Presidential Elections Results (%) - Democratic Party (Obama)
2012 Presidential Elections Results (%) - Republican Party (Romney)
2012 Presidential Elections Results (%) - Other
2016 Presidential Elections Results (%) - Democratic Party (Clinton)
2016 Presidential Elections Results (%) - Republican Party (Trump)
2016 Presidential Elections Results (%) - Other
2020 Presidential Elections Results (%) - Democratic Party (Biden)
2020 Presidential Elections Results (%) - Republican Party (Trump)
2020 Presidential Elections Results (%) - Other
Ancestries Reported - Arab (%)
Ancestries Reported - Czech (%)
Ancestries Reported - Danish (%)
Ancestries Reported - Dutch (%)
Ancestries Reported - English (%)
Ancestries Reported - French (%)
Ancestries Reported - French Canadian (%)
Ancestries Reported - German (%)
Ancestries Reported - Greek (%)
Ancestries Reported - Hungarian (%)
Ancestries Reported - Irish (%)
Ancestries Reported - Italian (%)
Ancestries Reported - Lithuanian (%)
Ancestries Reported - Norwegian (%)
Ancestries Reported - Polish (%)
Ancestries Reported - Portuguese (%)
Ancestries Reported - Russian (%)
Ancestries Reported - Scotch-Irish (%)
Ancestries Reported - Scottish (%)
Ancestries Reported - Slovak (%)
Ancestries Reported - Subsaharan African (%)
Ancestries Reported - Swedish (%)
Ancestries Reported - Swiss (%)
Ancestries Reported - Ukrainian (%)
Ancestries Reported - United States (%)
Ancestries Reported - Welsh (%)
Ancestries Reported - West Indian (%)
Ancestries Reported - Other (%)
Educational Attainment - No schooling completed (%)
Educational Attainment - Less than high school (%)
Educational Attainment - High school or equivalent (%)
Educational Attainment - Less than 1 year of college (%)
Educational Attainment - 1 or more years of college (%)
Educational Attainment - Associate degree (%)
Educational Attainment - Bachelor's degree (%)
Educational Attainment - Master's degree (%)
Educational Attainment - Professional school degree (%)
Educational Attainment - Doctorate degree (%)
School Enrollment - Nursery, preschool (%)
School Enrollment - Kindergarten (%)
School Enrollment - Grade 1 to 4 (%)
School Enrollment - Grade 5 to 8 (%)
School Enrollment - Grade 9 to 12 (%)
School Enrollment - College undergrad (%)
School Enrollment - Graduate or professional (%)
School Enrollment - Not enrolled in school (%)
School enrollment - Public schools (%)
School enrollment - Private schools (%)
School enrollment - Not enrolled (%)
Median number of rooms in houses and condos
Median number of rooms in apartments
Housing units lacking complete plumbing facilities (%)
Housing units lacking complete kitchen facilities (%)
Density of houses
Urban houses (%)
Rural houses (%)
Households with people 60 years and over (%)
Households with people 65 years and over (%)
Households with people 75 years and over (%)
Households with one or more nonrelatives (%)
Households with no nonrelatives (%)
Population in households (%)
Family households (%)
Nonfamily households (%)
Population in families (%)
Family households with own children (%)
Median number of bedrooms in owner occupied houses
Mean number of bedrooms in owner occupied houses
Median number of bedrooms in renter occupied houses
Mean number of bedrooms in renter occupied houses
Median number of vehichles in owner occupied houses
Mean number of vehichles in owner occupied houses
Median number of vehichles in renter occupied houses
Mean number of vehichles in renter occupied houses
Mortgage status - with mortgage (%)
Mortgage status - with second mortgage (%)
Mortgage status - with home equity loan (%)
Mortgage status - with both second mortgage and home equity loan (%)
Mortgage status - without a mortgage (%)
Average family size
Average family size - White
Average family size - Black or African American
Average family size - Asian
Average family size - Hispanic or Latino
Average family size - American Indian and Alaska Native
Average family size - Multirace
Average family size - Other Race
Geographical mobility - Same house 1 year ago (%)
Geographical mobility - Moved within same county (%)
Geographical mobility - Moved from different county within same state (%)
Geographical mobility - Moved from different state (%)
Geographical mobility - Moved from abroad (%)
Place of birth - Born in state of residence (%)
Place of birth - Born in other state (%)
Place of birth - Native, outside of US (%)
Place of birth - Foreign born (%)
Housing units in structures - 1, detached (%)
Housing units in structures - 1, attached (%)
Housing units in structures - 2 (%)
Housing units in structures - 3 or 4 (%)
Housing units in structures - 5 to 9 (%)
Housing units in structures - 10 to 19 (%)
Housing units in structures - 20 to 49 (%)
Housing units in structures - 50 or more (%)
Housing units in structures - Mobile home (%)
Housing units in structures - Boat, RV, van, etc. (%)
House/condo owner moved in on average (years ago)
Renter moved in on average (years ago)
Year householder moved into unit - Moved in 1999 to March 2000 (%)
Year householder moved into unit - Moved in 1995 to 1998 (%)
Year householder moved into unit - Moved in 1990 to 1994 (%)
Year householder moved into unit - Moved in 1980 to 1989 (%)
Year householder moved into unit - Moved in 1970 to 1979 (%)
Year householder moved into unit - Moved in 1969 or earlier (%)
Means of transportation to work - Drove car alone (%)
Means of transportation to work - Carpooled (%)
Means of transportation to work - Public transportation (%)
Means of transportation to work - Bus or trolley bus (%)
Means of transportation to work - Streetcar or trolley car (%)
Means of transportation to work - Subway or elevated (%)
Means of transportation to work - Railroad (%)
Means of transportation to work - Ferryboat (%)
Means of transportation to work - Taxicab (%)
Means of transportation to work - Motorcycle (%)
Means of transportation to work - Bicycle (%)
Means of transportation to work - Walked (%)
Means of transportation to work - Other means (%)
Working at home (%)
Industry diversity
Most Common Industries - Agriculture, forestry, fishing and hunting, and mining (%)
Most Common Industries - Agriculture, forestry, fishing and hunting (%)
Most Common Industries - Mining, quarrying, and oil and gas extraction (%)
Most Common Industries - Construction (%)
Most Common Industries - Manufacturing (%)
Most Common Industries - Wholesale trade (%)
Most Common Industries - Retail trade (%)
Most Common Industries - Transportation and warehousing, and utilities (%)
Most Common Industries - Transportation and warehousing (%)
Most Common Industries - Utilities (%)
Most Common Industries - Information (%)
Most Common Industries - Finance and insurance, and real estate and rental and leasing (%)
Most Common Industries - Finance and insurance (%)
Most Common Industries - Real estate and rental and leasing (%)
Most Common Industries - Professional, scientific, and management, and administrative and waste management services (%)
Most Common Industries - Professional, scientific, and technical services (%)
Most Common Industries - Management of companies and enterprises (%)
Most Common Industries - Administrative and support and waste management services (%)
Most Common Industries - Educational services, and health care and social assistance (%)
Most Common Industries - Educational services (%)
Most Common Industries - Health care and social assistance (%)
Most Common Industries - Arts, entertainment, and recreation, and accommodation and food services (%)
Most Common Industries - Arts, entertainment, and recreation (%)
Most Common Industries - Accommodation and food services (%)
Most Common Industries - Other services, except public administration (%)
Most Common Industries - Public administration (%)
Occupation diversity
Most Common Occupations - Management, business, science, and arts occupations (%)
Most Common Occupations - Management, business, and financial occupations (%)
Most Common Occupations - Management occupations (%)
Most Common Occupations - Business and financial operations occupations (%)
Most Common Occupations - Computer, engineering, and science occupations (%)
Most Common Occupations - Computer and mathematical occupations (%)
Most Common Occupations - Architecture and engineering occupations (%)
Most Common Occupations - Life, physical, and social science occupations (%)
Most Common Occupations - Education, legal, community service, arts, and media occupations (%)
Most Common Occupations - Community and social service occupations (%)
Most Common Occupations - Legal occupations (%)
Most Common Occupations - Education, training, and library occupations (%)
Most Common Occupations - Arts, design, entertainment, sports, and media occupations (%)
Most Common Occupations - Healthcare practitioners and technical occupations (%)
Most Common Occupations - Health diagnosing and treating practitioners and other technical occupations (%)
Most Common Occupations - Health technologists and technicians (%)
Most Common Occupations - Service occupations (%)
Most Common Occupations - Healthcare support occupations (%)
Most Common Occupations - Protective service occupations (%)
Most Common Occupations - Fire fighting and prevention, and other protective service workers including supervisors (%)
Most Common Occupations - Law enforcement workers including supervisors (%)
Most Common Occupations - Food preparation and serving related occupations (%)
Most Common Occupations - Building and grounds cleaning and maintenance occupations (%)
Most Common Occupations - Personal care and service occupations (%)
Most Common Occupations - Sales and office occupations (%)
Most Common Occupations - Sales and related occupations (%)
Most Common Occupations - Office and administrative support occupations (%)
Most Common Occupations - Natural resources, construction, and maintenance occupations (%)
Most Common Occupations - Farming, fishing, and forestry occupations (%)
Most Common Occupations - Construction and extraction occupations (%)
Most Common Occupations - Installation, maintenance, and repair occupations (%)
Most Common Occupations - Production, transportation, and material moving occupations (%)
Most Common Occupations - Production occupations (%)
Most Common Occupations - Transportation occupations (%)
Most Common Occupations - Material moving occupations (%)
People in Group quarters - Institutionalized population (%)
People in Group quarters - Correctional institutions (%)
People in Group quarters - Federal prisons and detention centers (%)
People in Group quarters - Halfway houses (%)
People in Group quarters - Local jails and other confinement facilities (including police lockups) (%)
People in Group quarters - Military disciplinary barracks (%)
People in Group quarters - State prisons (%)
People in Group quarters - Other types of correctional institutions (%)
People in Group quarters - Nursing homes (%)
People in Group quarters - Hospitals/wards, hospices, and schools for the handicapped (%)
People in Group quarters - Hospitals/wards and hospices for chronically ill (%)
People in Group quarters - Hospices or homes for chronically ill (%)
People in Group quarters - Military hospitals or wards for chronically ill (%)
People in Group quarters - Other hospitals or wards for chronically ill (%)
People in Group quarters - Hospitals or wards for drug/alcohol abuse (%)
People in Group quarters - Mental (Psychiatric) hospitals or wards (%)
People in Group quarters - Schools, hospitals, or wards for the mentally retarded (%)
People in Group quarters - Schools, hospitals, or wards for the physically handicapped (%)
People in Group quarters - Institutions for the deaf (%)
People in Group quarters - Institutions for the blind (%)
People in Group quarters - Orthopedic wards and institutions for the physically handicapped (%)
People in Group quarters - Wards in general hospitals for patients who have no usual home elsewhere (%)
People in Group quarters - Wards in military hospitals for patients who have no usual home elsewhere (%)
People in Group quarters - Juvenile institutions (%)
People in Group quarters - Long-term care (%)
People in Group quarters - Homes for abused, dependent, and neglected children (%)
People in Group quarters - Residential treatment centers for emotionally disturbed children (%)
People in Group quarters - Training schools for juvenile delinquents (%)
People in Group quarters - Short-term care, detention or diagnostic centers for delinquent children (%)
People in Group quarters - Type of juvenile institution unknown (%)
People in Group quarters - Noninstitutionalized population (%)
People in Group quarters - College dormitories (includes college quarters off campus) (%)
People in Group quarters - Military quarters (%)
People in Group quarters - On base (%)
People in Group quarters - Barracks, unaccompanied personnel housing (UPH), (Enlisted/Officer), ;and similar group living quarters for military personnel (%)
People in Group quarters - Transient quarters for temporary residents (%)
People in Group quarters - Military ships (%)
People in Group quarters - Group homes (%)
People in Group quarters - Homes or halfway houses for drug/alcohol abuse (%)
People in Group quarters - Homes for the mentally ill (%)
People in Group quarters - Homes for the mentally retarded (%)
People in Group quarters - Homes for the physically handicapped (%)
People in Group quarters - Other group homes (%)
People in Group quarters - Religious group quarters (%)
People in Group quarters - Dormitories (%)
People in Group quarters - Agriculture workers' dormitories on farms (%)
People in Group quarters - Job Corps and vocational training facilities (%)
People in Group quarters - Other workers' dormitories (%)
People in Group quarters - Crews of maritime vessels (%)
People in Group quarters - Other nonhousehold living situations (%)
People in Group quarters - Other noninstitutional group quarters (%)
Residents speaking English at home (%)
Residents speaking English at home - Born in the United States (%)
Residents speaking English at home - Native, born elsewhere (%)
Residents speaking English at home - Foreign born (%)
Residents speaking Spanish at home (%)
Residents speaking Spanish at home - Born in the United States (%)
Residents speaking Spanish at home - Native, born elsewhere (%)
Residents speaking Spanish at home - Foreign born (%)
Residents speaking other language at home (%)
Residents speaking other language at home - Born in the United States (%)
Residents speaking other language at home - Native, born elsewhere (%)
Residents speaking other language at home - Foreign born (%)
Class of Workers - Employee of private company (%)
Class of Workers - Self-employed in own incorporated business (%)
Class of Workers - Private not-for-profit wage and salary workers (%)
Class of Workers - Local government workers (%)
Class of Workers - State government workers (%)
Class of Workers - Federal government workers (%)
Class of Workers - Self-employed workers in own not incorporated business and Unpaid family workers (%)
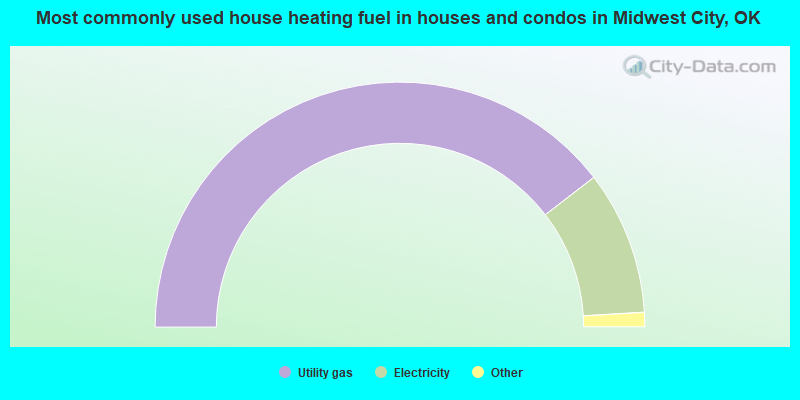
House heating fuel used in houses and condos - Utility gas (%)
House heating fuel used in houses and condos - Bottled, tank, or LP gas (%)
House heating fuel used in houses and condos - Electricity (%)
House heating fuel used in houses and condos - Fuel oil, kerosene, etc. (%)
House heating fuel used in houses and condos - Coal or coke (%)
House heating fuel used in houses and condos - Wood (%)
House heating fuel used in houses and condos - Solar energy (%)
House heating fuel used in houses and condos - Other fuel (%)
House heating fuel used in houses and condos - No fuel used (%)
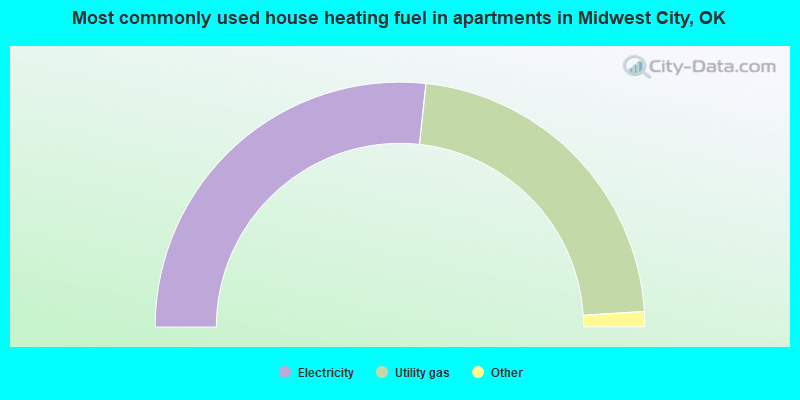
House heating fuel used in apartments - Utility gas (%)
House heating fuel used in apartments - Bottled, tank, or LP gas (%)
House heating fuel used in apartments - Electricity (%)
House heating fuel used in apartments - Fuel oil, kerosene, etc. (%)
House heating fuel used in apartments - Coal or coke (%)
House heating fuel used in apartments - Wood (%)
House heating fuel used in apartments - Solar energy (%)
House heating fuel used in apartments - Other fuel (%)
House heating fuel used in apartments - No fuel used (%)
Armed forces status - In Armed Forces (%)
Armed forces status - Civilian (%)
Armed forces status - Civilian - Veteran (%)
Armed forces status - Civilian - Nonveteran (%)
Fatal accidents locations in years 2005-2021
Fatal accidents locations in 2005
Fatal accidents locations in 2006
Fatal accidents locations in 2007
Fatal accidents locations in 2008
Fatal accidents locations in 2009
Fatal accidents locations in 2010
Fatal accidents locations in 2011
Fatal accidents locations in 2012
Fatal accidents locations in 2013
Fatal accidents locations in 2014
Fatal accidents locations in 2015
Fatal accidents locations in 2016
Fatal accidents locations in 2017
Fatal accidents locations in 2018
Fatal accidents locations in 2019
Fatal accidents locations in 2020
Fatal accidents locations in 2021
Alcohol use - People drinking some alcohol every month (%)
Alcohol use - People not drinking at all (%)
Alcohol use - Average days/month drinking alcohol
Alcohol use - Average drinks/week
Alcohol use - Average days/year people drink much
Audiometry - Average condition of hearing (%)
Audiometry - People that can hear a whisper from across a quiet room (%)
Audiometry - People that can hear normal voice from across a quiet room (%)
Audiometry - Ears ringing, roaring, buzzing (%)
Audiometry - Had a job exposure to loud noise (%)
Audiometry - Had off-work exposure to loud noise (%)
Blood Pressure & Cholesterol - Has high blood pressure (%)
Blood Pressure & Cholesterol - Checking blood pressure at home (%)
Blood Pressure & Cholesterol - Frequently checking blood cholesterol (%)
Blood Pressure & Cholesterol - Has high cholesterol level (%)
Consumer Behavior - Money monthly spent on food at supermarket/grocery store
Consumer Behavior - Money monthly spent on food at other stores
Consumer Behavior - Money monthly spent on eating out
Consumer Behavior - Money monthly spent on carryout/delivered foods
Consumer Behavior - Income spent on food at supermarket/grocery store (%)
Consumer Behavior - Income spent on food at other stores (%)
Consumer Behavior - Income spent on eating out (%)
Consumer Behavior - Income spent on carryout/delivered foods (%)
Current Health Status - General health condition (%)
Current Health Status - Blood donors (%)
Current Health Status - Has blood ever tested for HIV virus (%)
Current Health Status - Left-handed people (%)
Dermatology - People using sunscreen (%)
Diabetes - Diabetics (%)
Diabetes - Had a blood test for high blood sugar (%)
Diabetes - People taking insulin (%)
Diet Behavior & Nutrition - Diet health (%)
Diet Behavior & Nutrition - Milk product consumption (# of products/month)
Diet Behavior & Nutrition - Meals not home prepared (#/week)
Diet Behavior & Nutrition - Meals from fast food or pizza place (#/week)
Diet Behavior & Nutrition - Ready-to-eat foods (#/month)
Diet Behavior & Nutrition - Frozen meals/pizza (#/month)
Drug Use - People that ever used marijuana or hashish (%)
Drug Use - Ever used hard drugs (%)
Drug Use - Ever used any form of cocaine (%)
Drug Use - Ever used heroin (%)
Drug Use - Ever used methamphetamine (%)
Health Insurance - People covered by health insurance (%)
Kidney Conditions-Urology - Avg. # of times urinating at night
Medical Conditions - People with asthma (%)
Medical Conditions - People with anemia (%)
Medical Conditions - People with psoriasis (%)
Medical Conditions - People with overweight (%)
Medical Conditions - Elderly people having difficulties in thinking or remembering (%)
Medical Conditions - People who ever received blood transfusion (%)
Medical Conditions - People having trouble seeing even with glass/contacts (%)
Medical Conditions - People with arthritis (%)
Medical Conditions - People with gout (%)
Medical Conditions - People with congestive heart failure (%)
Medical Conditions - People with coronary heart disease (%)
Medical Conditions - People with angina pectoris (%)
Medical Conditions - People who ever had heart attack (%)
Medical Conditions - People who ever had stroke (%)
Medical Conditions - People with emphysema (%)
Medical Conditions - People with thyroid problem (%)
Medical Conditions - People with chronic bronchitis (%)
Medical Conditions - People with any liver condition (%)
Medical Conditions - People who ever had cancer or malignancy (%)
Mental Health - People who have little interest in doing things (%)
Mental Health - People feeling down, depressed, or hopeless (%)
Mental Health - People who have trouble sleeping or sleeping too much (%)
Mental Health - People feeling tired or having little energy (%)
Mental Health - People with poor appetite or overeating (%)
Mental Health - People feeling bad about themself (%)
Mental Health - People who have trouble concentrating on things (%)
Mental Health - People moving or speaking slowly or too fast (%)
Mental Health - People having thoughts they would be better off dead (%)
Oral Health - Average years since last visit a dentist
Oral Health - People embarrassed because of mouth (%)
Oral Health - People with gum disease (%)
Oral Health - General health of teeth and gums (%)
Oral Health - Average days a week using dental floss/device
Oral Health - Average days a week using mouthwash for dental problem
Oral Health - Average number of teeth
Pesticide Use - Households using pesticides to control insects (%)
Pesticide Use - Households using pesticides to kill weeds (%)
Physical Activity - People doing vigorous-intensity work activities (%)
Physical Activity - People doing moderate-intensity work activities (%)
Physical Activity - People walking or bicycling (%)
Physical Activity - People doing vigorous-intensity recreational activities (%)
Physical Activity - People doing moderate-intensity recreational activities (%)
Physical Activity - Average hours a day doing sedentary activities
Physical Activity - Average hours a day watching TV or videos
Physical Activity - Average hours a day using computer
Physical Functioning - People having limitations keeping them from working (%)
Physical Functioning - People limited in amount of work they can do (%)
Physical Functioning - People that need special equipment to walk (%)
Physical Functioning - People experiencing confusion/memory problems (%)
Physical Functioning - People requiring special healthcare equipment (%)
Prescription Medications - Average number of prescription medicines taking
Preventive Aspirin Use - Adults 40+ taking low-dose aspirin (%)
Reproductive Health - Vaginal deliveries (%)
Reproductive Health - Cesarean deliveries (%)
Reproductive Health - Deliveries resulted in a live birth (%)
Reproductive Health - Pregnancies resulted in a delivery (%)
Reproductive Health - Women breastfeeding newborns (%)
Reproductive Health - Women that had a hysterectomy (%)
Reproductive Health - Women that had both ovaries removed (%)
Reproductive Health - Women that have ever taken birth control pills (%)
Reproductive Health - Women taking birth control pills (%)
Reproductive Health - Women that have ever used Depo-Provera or injectables (%)
Reproductive Health - Women that have ever used female hormones (%)
Sexual Behavior - People 18+ that ever had sex (vaginal, anal, or oral) (%)
Sexual Behavior - Males 18+ that ever had vaginal sex with a woman (%)
Sexual Behavior - Males 18+ that ever performed oral sex on a woman (%)
Sexual Behavior - Males 18+ that ever had anal sex with a woman (%)
Sexual Behavior - Males 18+ that ever had any sex with a man (%)
Sexual Behavior - Females 18+ that ever had vaginal sex with a man (%)
Sexual Behavior - Females 18+ that ever performed oral sex on a man (%)
Sexual Behavior - Females 18+ that ever had anal sex with a man (%)
Sexual Behavior - Females 18+ that ever had any kind of sex with a woman (%)
Sexual Behavior - Average age people first had sex
Sexual Behavior - Average number of female sex partners in lifetime (males 18+)
Sexual Behavior - Average number of female vaginal sex partners in lifetime (males 18+)
Sexual Behavior - Average age people first performed oral sex on a woman (18+)
Sexual Behavior - Average number of woman performed oral sex on in lifetime (18+)
Sexual Behavior - Average number of male sex partners in lifetime (males 18+)
Sexual Behavior - Average number of male anal sex partners in lifetime (males 18+)
Sexual Behavior - Average age people first performed oral sex on a man (18+)
Sexual Behavior - Average number of male oral sex partners in lifetime (18+)
Sexual Behavior - People using protection when performing oral sex (%)
Sexual Behavior - Average number of times people have vaginal or anal sex a year
Sexual Behavior - People having sex without condom (%)
Sexual Behavior - Average number of male sex partners in lifetime (females 18+)
Sexual Behavior - Average number of male vaginal sex partners in lifetime (females 18+)
Sexual Behavior - Average number of female sex partners in lifetime (females 18+)
Sexual Behavior - Circumcised males 18+ (%)
Sleep Disorders - Average hours sleeping at night
Sleep Disorders - People that has trouble sleeping (%)
Smoking-Cigarette Use - People smoking cigarettes (%)
Taste & Smell - People 40+ having problems with smell (%)
Taste & Smell - People 40+ having problems with taste (%)
Taste & Smell - People 40+ that ever had wisdom teeth removed (%)
Taste & Smell - People 40+ that ever had tonsils teeth removed (%)
Taste & Smell - People 40+ that ever had a loss of consciousness because of a head injury (%)
Taste & Smell - People 40+ that ever had a broken nose or other serious injury to face or skull (%)
Taste & Smell - People 40+ that ever had two or more sinus infections (%)
Weight - Average height (inches)
Weight - Average weight (pounds)
Weight - Average BMI
Weight - People that are obese (%)
Weight - People that ever were obese (%)
Weight - People trying to lose weight (%)
According to our research of Oklahoma and other state lists, there were 33 registered sex offenders living in Midwest City, Oklahoma as of April 27, 2024 . The ratio of all residents to sex offenders in Midwest City is 1,766 to 1.The ratio of registered sex offenders to all residents in this city is much lower than the state average.
The City-Data.com crime index weighs serious crimes and violent crimes more heavily. Higher means more crime, U.S. average is 246.1. It adjusts for the number of visitors and daily workers commuting into cities.
- means the value is smaller than the state average.
- means the value is about the same as the state average.
- means the value is bigger than the state average.
- means the value is much bigger than the state average.
Crime rate in Midwest City detailed stats: murders, rapes, robberies, assaults, burglaries, thefts, arson Officers per 1,000 residents here:
1.68Oklahoma average:
2.27
Latest news from Midwest City, OK collected exclusively by city-data.com from local newspapers, TV, and radio stations
Midwest City, OK City Guides: Ancestries: American (8.9%), English (5.4%), German (5.2%), Irish (3.9%), African (1.7%), European (1.5%).
Current Local Time:
Land area: 24.6 square miles.
Population density: 2,356 people per square mile (low).
2,036 residents are foreign born (1.4% Latin America , 1.2% Asia , 0.4% Africa ).
This city:
3.5%Oklahoma:
6.1%
Median real estate property taxes paid for housing units with mortgages in 2022: $1,719 (0.9%)Median real estate property taxes paid for housing units with no mortgage in 2022: $1,352 (1.0%)
Nearest city with pop. 200,000+: Oklahoma City, OK
Nearest city with pop. 1,000,000+: Dallas, TX
Nearest cities:
Smith Village, OK (2.0 miles),
Lake Aluma, OK (2.4 miles),
Latitude: 35.46 N, Longitude: 97.38 W
Daytime population change due to commuting: -6,845 (-11.7%)Workers who live and work in this city: 7,630 (29.0%)
Property values in Midwest City, OK
Single-family new house construction building permits:
2022: 96 buildings , average cost: $256,2002021: 153 buildings , average cost: $169,5002020: 121 buildings , average cost: $179,1002019: 142 buildings , average cost: $149,1002018: 144 buildings , average cost: $158,0002017: 123 buildings , average cost: $158,5002016: 111 buildings , average cost: $158,6002015: 106 buildings , average cost: $158,0002014: 92 buildings , average cost: $160,7002013: 113 buildings , average cost: $151,4002012: 123 buildings , average cost: $155,1002011: 95 buildings , average cost: $134,1002010: 157 buildings , average cost: $154,0002009: 198 buildings , average cost: $132,5002008: 146 buildings , average cost: $148,6002007: 194 buildings , average cost: $140,1002006: 269 buildings , average cost: $152,8002005: 237 buildings , average cost: $132,0002004: 246 buildings , average cost: $128,0002003: 183 buildings , average cost: $146,9002002: 167 buildings , average cost: $133,1002001: 119 buildings , average cost: $119,6002000: 81 buildings , average cost: $109,4001999: 184 buildings , average cost: $102,6001998: 81 buildings , average cost: $106,8001997: 103 buildings , average cost: $98,800Unemployment in December 2023:
Population change in the 1990s: +1,716 (+3.3%).
Most common occupations in Midwest City, OK (%)
Both Males Females
Other office and administrative support workers, including supervisors (5.4%)
Material recording, scheduling, dispatching, and distributing workers (3.6%)
Information and record clerks, except customer service representatives (3.4%)
Other management occupations, except farmers and farm managers (3.4%)
Vehicle and mobile equipment mechanics, installers, and repairers (3.4%)
Other sales and related occupations, including supervisors (3.3%)
Electrical equipment mechanics and other installation, maintenance, and repair workers, including supervisors (3.1%)
Vehicle and mobile equipment mechanics, installers, and repairers (6.1%)
Electrical equipment mechanics and other installation, maintenance, and repair workers, including supervisors (5.5%)
Other production occupations, including supervisors (4.7%)
Laborers and material movers, hand (4.2%)
Material recording, scheduling, dispatching, and distributing workers (3.9%)
Driver/sales workers and truck drivers (3.8%)
Other management occupations, except farmers and farm managers (3.6%)
Other office and administrative support workers, including supervisors (7.8%)
Information and record clerks, except customer service representatives (5.8%)
Secretaries and administrative assistants (5.5%)
Preschool, kindergarten, elementary, and middle school teachers (4.0%)
Health technologists and technicians (3.7%)
Other sales and related occupations, including supervisors (3.4%)
Child care workers (3.3%)
Tornado activity:
Midwest City-area historical tornado activity is slightly above Oklahoma state average. It is 255% greater than the overall U.S. average.
On 5/3/1999, a category F5 (max. wind speeds 261-318 mph) tornado 2.7 miles away from the Midwest City city center killed 36 people and injured 583 people and caused $1000 million in damages.
On 5/1/1954, a category F4 (max. wind speeds 207-260 mph) tornado 4.4 miles away from the city center injured 65 people and caused between $500,000 and $5,000,000 in damages.
Earthquake activity:
Midwest City-area historical earthquake activity is significantly above Oklahoma state average. It is 836% greater than the overall U.S. average. On 11/6/2011 at 03:53:10, a magnitude 5.7 (5.7 MW, Depth: 3.2 mi, Class: Moderate, Intensity: VI - VII) earthquake occurred 35.2 miles away from the city center On 9/3/2016 at 12:02:44, a magnitude 5.8 (5.8 MW, Depth: 3.5 mi) earthquake occurred 71.3 miles away from the city center On 11/7/2016 at 01:44:24, a magnitude 5.0 (5.0 MW, Depth: 2.8 mi) earthquake occurred 49.0 miles away from Midwest City center On 11/8/2011 at 02:46:57, a magnitude 4.8 (4.8 MW, Depth: 3.1 mi, Class: Light, Intensity: IV - V) earthquake occurred 33.9 miles away from the city center On 11/5/2011 at 07:12:45, a magnitude 4.8 (4.8 MW, Depth: 1.9 mi) earthquake occurred 35.4 miles away from Midwest City center On 2/13/2016 at 17:07:06, a magnitude 5.1 (5.1 MW, Depth: 5.2 mi) earthquake occurred 102.7 miles away from Midwest City center Magnitude types: moment magnitude (MW) Natural disasters: The number of natural disasters in Oklahoma County (43) is a lot greater than the US average (15).Major Disasters (Presidential) Declared: 26Emergencies Declared: 6Storms: 18, Floods: 15, Fires: 12, Tornadoes: 12, Winter Storms: 8, Winds: 3, Explosion: 1, Hurricane: 1, Ice Storm: 1, Snow: 1, Other: 1 (Note: some incidents may be assigned to more than one category). Hospitals and medical centers in Midwest City: HORIZON SPECIALTY HOSP (provides emergency services, 8210 NATIONAL AVE) MIDWEST REGIONAL MEDICAL CENTER (Proprietary, 2825 PARKLAWN DRIVE) BUENA VISTA CARE AND REHABILITATION CENTER (1400 BUENA VISTA)
COLONIAL MANOR NURSING HOME (8016 SOUTHEAST 15TH STREET)
MANORCARE HEALTH SERVICES-MIDWEST CITY (2900 PARKLAWN DRIVE)
MIDWEST CITY NURSING CENTER (8200 NATIONAL AVENUE)
SIENNA EXTENDED CARE AND REHAB (9221 HARMONY DRIVE)
DAVITA - MIDWEST CITY (7221 E RENO AVE)
FMCNA - HERITAGE PARK (310 S HIGHLAND AVE)
MIDWEST CITY REG MED CTR HOME HEALTH SERVICES (2825 PARKLAWN DRIVE)
Amtrak stations near Midwest City: 8 miles: OKLAHOMA CITY (100 SOUTH E. K. GAYLORD BLVD.) 18 miles: NORMAN (200 S. JONES AVE.)
Colleges/Universities in Midwest City: Rose State College Full-time enrollment: 4,896; Location: 6420 S E 15th; Public; Website: www.rose.edu)
Mid-Del Technology Center Full-time enrollment: 112; Location: 1621 Maple Dr; Public; Website: www.middeltech.com)
Other colleges/universities with over 2000 students near Midwest City:
University of Oklahoma-Health Sciences Center (about 7 miles; Oklahoma City, OK ; Full-time enrollment: 2,507)
Oklahoma City University (about 10 miles; Oklahoma City, OK ; FT enrollment: 2,547)
Oklahoma Christian University (about 12 miles; Edmond, OK ; FT enrollment: 2,173)
Oklahoma State University-Oklahoma City (about 12 miles; Oklahoma City, OK ; FT enrollment: 4,784)
Oklahoma City Community College (about 12 miles; Oklahoma City, OK ; FT enrollment: 8,904)
Mid-America Christian University (about 14 miles; Oklahoma City, OK ; FT enrollment: 2,869)
Southern Nazarene University (about 15 miles; Bethany, OK ; FT enrollment: 2,064)
Public high school in Midwest City: MIDWEST CITY HS Students: 1,606, Location: 213 E ELM STREET, Grades: 9-12)Private high school in Midwest City: HARVEST LIFE SCHOOL Students: 58, Location: 9125 SE 15TH ST, Grades: PK-12)
Public elementary/middle schools in Midwest City: SOLDIER CREEK ES Students: 658, Location: 9021 SE 15TH STREET, Grades: PK-5)STEED ES Students: 438, Location: 2118 FLANNERY DRIVE, Grades: PK-5)RIDGECREST ES Students: 418, Location: 137 W RIDGEWOOD DRIVE, Grades: PK-5)CLEVELAND BAILEY ES Students: 374, Location: 3301 SUNVALLEY DRIVE, Grades: PK-5)JARMAN MS Students: 58, Location: 5 W MACARTHUR DRIVE, Grades: 6-8)MONRONEY MS Location: 7400 E RENO AVENUE, Grades: 6-8)
MIDWEST CITY ES Location: 2211 S MIDWEST BLVD, Grades: PK-5)
Private elementary/middle schools in Midwest City: ST PHILIP NERI SCHOOL Students: 192, Location: 1121 FELIX PLACE, Grades: PK-8)
GOOD SHEPHERD LUTHERAN SCHOOL Students: 123, Location: 700 N AIR DEPOT BLVD, Grades: PK-8)
See full list of schools located in Midwest City User-submitted facts and corrections:
Sooner Baptist Church, 5824 SE 15th Street. added by Bob
Notable locations in Midwest City: (A) , Red Horse (B) , Ridgecrest Country Club (C) , Boulevard Marketplace (D) , Downtown Tinker Plaza (E) , Holiday Square (F) , Heritage Plaza (G) , Kenwood Plaza (H) , Gateway Plaza (I) , Dickson Plaza (J) , Midwest City Fire Department Station 1 (K) , Midwest City Fire Department Station 2 (L) , Midwest City Fire Department Station 4 (M) , Midwest City Fire Department Station 5 (N) , Midwest City Fire Department Station 3 (O) . Display/hide their locations on the map
Shopping Centers: (1) , Village Oaks Shopping Center (2) , Greenhaws Shopping Center (3) , Lockheed Shopping Center (4) , Uptown Shopping Center (5) , Gateway Shopping Center (6) , Heritage Shopping Center (7) , Town and Country Shopping Center (8) , 23 Post Plaza Shopping Center (9) . Display/hide their locations on the map
Churches in Midwest City include: (A) , Victory Fellowship Church (B) , Soldier Creek Baptist Church (C) , Seventh Day Adventist Church (D) , Neighborhood Missionary Baptist Church (E) , Midwest City Church of God (F) , Mid-Del African Methodist Episcopal Church (G) , Judah Fellowship Church (H) , Jehovahs Witnesses Church (I) . Display/hide their locations on the map
Cemetery: (1) . Display/hide its location on the map
Creek: (A) . Display/hide its location on the map
Parks in Midwest City include: (1) , Kiwanis Park (2) , Regional Park (3) , Pecan Grove Park (4) , ESA Park (5) , Quinlan Park (6) . Display/hide their locations on the map
Tourist attraction: (1) . Display/hide its approximate location on the map
Hotels: (1) , Meadow Glen Apartments (1250 North Air Depot Boulevard Ofc) (2) . Display/hide their approximate locations on the map
Birthplace of: Matt Kemp - Baseball player, Mike Gundy - College football player, Angela Lindvall - Female model, Brian Tallet - 2005 Major League Baseball player (Cleveland Indians, born : Sep 21, 1977), Matt Grice - Martial artist, Royce D. Applegate - Actor, Ryan Budde - Baseball player, J. D. Runnels - Football player, Cale Gundy - Football player, De'Angelo Alexander - College basketball player (Charlotte 49ers).
Oklahoma County has a predicted average indoor radon screening level less than 2 pCi/L (pico curies per liter) - Low Potential Drinking water stations with addresses in Midwest City and their reported violations in the past:
EDGEWOOD MHP (Address: 8801 S.E. 29th Population served: 350, Purch surface water):
Past health violations:
MCL, Average - Between JAN-2014 and MAR-2014, Contaminant: TTHM. Follow-up actions: St AO (w/penalty) issued (JUN-17-2014), St Public Notif requested (JUN-17-2014), St Public Notif received (JUL-14-2014)
MCL, Average - Between OCT-2013 and DEC-2013, Contaminant: TTHM. Follow-up actions: St AO (w/penalty) issued (JUN-17-2014), St Public Notif requested (JUN-17-2014), St Public Notif received (JUL-14-2014)
MCL, Average - Between JUL-2013 and SEP-2013, Contaminant: TTHM. Follow-up actions: St AO (w/penalty) issued (JUN-17-2014), St Public Notif requested (JUN-17-2014), St Public Notif received (JUL-14-2014)
MCL, Average - Between APR-2013 and JUN-2013, Contaminant: TTHM
MCL, Average - Between JAN-2013 and MAR-2013, Contaminant: TTHM. Follow-up actions: St AO (w/penalty) issued (JUN-17-2014), St Public Notif requested (JUN-17-2014), St Public Notif received (JUL-14-2014)
MCL, Average - Between OCT-2012 and DEC-2012, Contaminant: TTHM
Past monitoring violations:
Failure to Notify Other PWS - In AUG-01-2011, Contaminant: GROUNDWATER RULE. Follow-up actions: St Compliance achieved (OCT-04-2011)
Monitoring, Routine (IDSE) - Between AUG-2008 and JUL-2009, Contaminant: TTHM. Follow-up actions: Fed Violation/Reminder Notice (DEC-08-2008), St Compliance achieved (AUG-01-2012)
Monitoring, Routine (IDSE) - Between AUG-2008 and JUL-2009, Contaminant: Total Haloacetic Acids (HAA5). Follow-up actions: Fed Violation/Reminder Notice (DEC-08-2008), St Compliance achieved (AUG-01-2012)
Address: 320 S. Post Rd. Population served: 40, Purch surface water):
Past monitoring violations:
10 routine major monitoring violations
Average household size: This city:
2.4 peopleOklahoma:
2.5 people
Percentage of family households: This city:
62.9%Whole state:
66.8%
Percentage of households with unmarried partners: This city:
6.5%Whole state:
5.9%
Likely homosexual households (counted as self-reported same-sex unmarried-partner households)
Lesbian couples: 0.3% of all households Gay men: 0.2% of all households
People in group quarters in Midwest City in 2010:
235 people in nursing facilities/skilled-nursing facilities
25 people in local jails and other municipal confinement facilities
25 people in group homes intended for adults
People in group quarters in Midwest City in 2000:
407 people in nursing homes
29 people in local jails and other confinement facilities (including police lockups)
19 people in homes for the mentally retarded
12 people in other group homes
11 people in other noninstitutional group quarters
Banks with most branches in Midwest City (2011 data):
BOKF, National Association: 15th And Post Branch, Midwest City Douglas And Reno - Cres, Midwest City Branch. Info updated 2012/02/28: Bank assets: $25,360.0 mil, Deposits: $19,171.3 mil, headquarters in Tulsa, OK, positive income , Commercial Lending Specialization, 189 total offices , Holding Company: Bok Financial Corporation
JPMorgan Chase Bank, National Association: Central Midwest City at 301 North Midwest Boulevard, branch established on 1979/12/03; Tinker-Mid Del at 7005 Southeast 15th Street, branch established on 1992/12/18. Info updated 2011/11/10: Bank assets: $1,811,678.0 mil, Deposits: $1,190,738.0 mil, headquarters in Columbus, OH, positive income , International Specialization, 5577 total offices , Holding Company: Jpmorgan Chase & Co.
International Bank of Commerce: Midwest City Air Depot Branch at 414 Air Depot Drive, branch established on 1908/01/01; Midwest City Douglas Branch at 2200 South Douglas Boulevard, branch established on 1997/12/02. Info updated 2007/03/28: Bank assets: $9,621.9 mil, Deposits: $6,548.8 mil, headquarters in Laredo, TX, positive income , Commercial Lending Specialization, 197 total offices , Holding Company: International Bancshares Corporation
First National Bank: at 2911 South Air Depot Boulevard, branch established on 1943/06/01; Douglas Blvd Branch at 1213 Douglas Blvd, branch established on 1997/05/27. Info updated 2006/11/03: Bank assets: $432.0 mil, Deposits: $371.1 mil, local headquarters , positive income , 8 total offices , Holding Company: First Midwest Acquisition Corporation
The First State Bank: South Douglas Boulevard Branch at 2600 South Douglas Boulevard, branch established on 2007/12/17. Info updated 2012/01/19: Bank assets: $105.3 mil, Deposits: $92.2 mil, headquarters in Oklahoma City, OK, positive income , Commercial Lending Specialization, 3 total offices , Holding Company: Fsb Investments, Llc
MidFirst Bank: Midwest City Branch at 201 Midwest Blvd., branch established on 2002/08/30. Info updated 2011/07/21: Bank assets: $9,790.2 mil, Deposits: $6,308.2 mil, headquarters in Oklahoma City, OK, positive income , Commercial Lending Specialization, 77 total offices
First Fidelity Bank, National Association: Midwest City Branch at 301 North Air Depot Boulevard, branch established on 1985/08/08. Info updated 2010/09/21: Bank assets: $1,141.9 mil, Deposits: $903.8 mil, headquarters in Oklahoma City, OK, positive income , Commercial Lending Specialization, 28 total offices , Holding Company: First Fidelity Bancorp, Inc.
Bank of the West: Midwest City at 1201 South Air Depot Boulevard, branch established on 1998/10/05. Info updated 2009/11/16: Bank assets: $62,408.3 mil, Deposits: $43,995.2 mil, headquarters in San Francisco, CA, positive income , 647 total offices , Holding Company: Bnp Paribas
Advantage Bank: Midwest City Branch at 10100 Se 15th Street, branch established on 2003/02/10. Info updated 2011/11/10: Bank assets: $56.1 mil, Deposits: $49.5 mil, headquarters in Spencer, OK, positive income , Commercial Lending Specialization, 2 total offices , Holding Company: Spencer Bancshares, Inc.
For population 15 years and over in Midwest City:
Never married: 31.8%Now married: 44.4%Separated: 2.3%Widowed: 6.4%Divorced: 15.1% For population 25 years and over in Midwest City:
High school or higher: 92.9%Bachelor's degree or higher: 25.0%Graduate or professional degree: 6.9%Unemployed: 4.5%Mean travel time to work (commute): 20.6 minutes
Education Gini index (Inequality in education) Here:
9.2Oklahoma average:
11.3
Religion statistics for Midwest City, OK (based on Oklahoma County data)
Religion Adherents Congregations Evangelical Protestant 325,241 609 Mainline Protestant 83,693 122 Catholic 61,318 27 Other 26,587 73 Black Protestant 22,346 64 Orthodox 1,807 10 None 197,641 -
Source: Clifford Grammich, Kirk Hadaway, Richard Houseal, Dale E.Jones, Alexei Krindatch, Richie Stanley and Richard H.Taylor. 2012. 2010 U.S.Religion Census: Religious Congregations & Membership Study. Association of Statisticians of American Religious Bodies. Jones, Dale E., et al. 2002. Congregations and Membership in the United States 2000. Nashville, TN: Glenmary Research Center. Graphs represent county-level data
Food Environment Statistics: Number of grocery stores : 195Oklahoma County :
2.79 / 10,000 pop.Oklahoma :
1.97 / 10,000 pop.
Number of supercenters and club stores : 12Here :
0.17 / 10,000 pop.Oklahoma :
0.20 / 10,000 pop.
Number of convenience stores (no gas) : 29Oklahoma County :
0.41 / 10,000 pop.State :
0.76 / 10,000 pop.
Number of convenience stores (with gas) : 163Oklahoma County :
2.33 / 10,000 pop.Oklahoma :
4.35 / 10,000 pop.
Number of full-service restaurants : 566Oklahoma County :
8.10 / 10,000 pop.Oklahoma :
6.89 / 10,000 pop.
Adult diabetes rate : Oklahoma County :
9.8%Oklahoma :
10.3%
Adult obesity rate : This county :
27.9%Oklahoma :
29.2%
Health and Nutrition: Healthy diet rate : Midwest City:
50.1%State:
48.6%
Average overall health of teeth and gums : This city:
47.9%Oklahoma:
45.2%
People feeling badly about themselves : This city:
20.1%Oklahoma:
21.4%
People not drinking alcohol at all : Midwest City:
11.1%Oklahoma:
10.8%
Average hours sleeping at night : This city:
6.8Oklahoma:
6.8
Overweight people : This city:
34.2%Oklahoma:
33.9%
General health condition : This city:
56.8%Oklahoma:
55.2%
Average condition of hearing : Midwest City:
79.8%Oklahoma:
78.4%
More about Health and Nutrition of Midwest City, OK Residents
Local government employment and payroll (March 2022)
Function
Full-time employees
Monthly full-time payroll
Average yearly full-time wage
Part-time employees
Monthly part-time payroll
Police Protection - Officers
102 $762,769 $89,738 0 $0 Firefighters
84 $747,879 $106,840 0 $0 Other Government Administration
43 $275,564 $76,902 8 $6,455 Sewerage
42 $201,307 $57,516 0 $0 Other and Unallocable
40 $234,567 $70,370 0 $0 Water Supply
33 $175,249 $63,727 0 $0 Streets and Highways
23 $79,761 $41,614 2 $1,618 Solid Waste Management
20 $89,502 $53,701 0 $0 Financial Administration
14 $90,666 $77,714 1 $1,654 Police - Other
13 $82,626 $76,270 0 $0 Parks and Recreation
10 $54,842 $65,810 8 $6,252 Correction
10 $39,545 $47,454 0 $0 Housing and Community Development (Local)
8 $56,463 $84,695 1 $1,483 Judicial and Legal
7 $36,042 $61,786 2 $4,834 Health
6 $27,766 $55,532 1 $2,064 Natural Resources
3 $14,204 $56,816 0 $0 Fire - Other
1 $10,356 $124,272 0 $0
Totals for Government
459 $2,979,109 $77,885 23 $24,359
Midwest City government finances - Expenditure in 2021 (per resident):
Current Operations - Police Protection: $23,617,000 ($407.54)
General - Other: $12,663,000 ($218.52)Local Fire Protection: $11,416,000 ($197.00)Water Utilities: $6,148,000 ($106.09)Housing and Community Development: $5,923,000 ($102.21)Sewerage: $5,590,000 ($96.46)Solid Waste Management: $5,161,000 ($89.06)Regular Highways: $3,493,000 ($60.28)Central Staff Services: $1,834,000 ($31.65)Parks and Recreation: $1,606,000 ($27.71)Financial Administration: $777,000 ($13.41)Judicial and Legal Services: $535,000 ($9.23)Health - Other: $393,000 ($6.78)Miscellaneous Commercial Activities - Other: $180,000 ($3.11)Correctional Institutions: $112,000 ($1.93)General - Interest on Debt: $287,000 ($4.95)
Other Capital Outlay - Regular Highways: $5,060,000 ($87.32)
Health - Other: $2,509,000 ($43.30)Housing and Community Development: $1,410,000 ($24.33)Police Protection: $1,086,000 ($18.74)Local Fire Protection: $448,000 ($7.73)General - Other: $62,000 ($1.07)Parks and Recreation: $21,000 ($0.36)Financial Administration: $3,000 ($0.05)Central Staff Services: $3,000 ($0.05)Total Salaries and Wages: $32,410,000 ($559.28)
Water Utilities - Interest on Debt: $6,277,000 ($108.32)
Midwest City government finances - Revenue in 2021 (per resident):
Charges - Sewerage: $10,208,000 ($176.15)
Solid Waste Management: $7,599,000 ($131.13)Other: $2,130,000 ($36.76)Miscellaneous Commercial Activities: $1,088,000 ($18.77)Parks and Recreation: $1,038,000 ($17.91)Federal Intergovernmental - Housing and Community Development: $742,000 ($12.80)
Other: $167,000 ($2.88)Water Utilities: $37,000 ($0.64)Miscellaneous - Interest Earnings: $36,119,000 ($623.28)
Rents: $8,948,000 ($154.41)Fines and Forfeits: $1,570,000 ($27.09)Sale of Property: $355,000 ($6.13)General Revenue - Other: $329,000 ($5.68)Royalties: $12,000 ($0.21)Donations From Private Sources: $5,000 ($0.09)Revenue - Water Utilities: $7,941,000 ($137.03)
State Intergovernmental - General Local Government Support: $545,000 ($9.40)
Highways: $521,000 ($8.99)Other: $119,000 ($2.05)Housing and Community Development: $105,000 ($1.81)Tax - General Sales and Gross Receipts: $48,204,000 ($831.82)
Property: $5,179,000 ($89.37)Public Utilities Sales: $2,434,000 ($42.00)Other Selective Sales: $532,000 ($9.18)Occupation and Business License - Other: $455,000 ($7.85)Other License: $169,000 ($2.92)
Midwest City government finances - Debt in 2021 (per resident):
Long Term Debt - Outstanding Unspecified Public Purpose: $165,485,000 ($2855.65)
Beginning Outstanding - Unspecified Public Purpose: $164,105,000 ($2831.84)Issue, Unspecified Public Purpose: $27,510,000 ($474.72)Retired Unspecified Public Purpose: $26,130,000 ($450.91)
Midwest City government finances - Cash and Securities in 2021 (per resident):
Other Funds - Cash and Securities: $292,398,000 ($5045.69)
7.15% of this county's 2021 resident taxpayers lived in other counties in 2020 ($56,046 average adjusted gross income )
Here:
7.15%Oklahoma average:
8.28%
0.04% of residents moved from foreign countries ($425 average AGI )Oklahoma County:
0.04%Oklahoma average:
0.04%
Top counties from which taxpayers relocated into this county between 2020 and 2021:
7.53% of this county's 2020 resident taxpayers moved to other counties in 2021 ($55,930 average adjusted gross income )
Here:
7.53%Oklahoma average:
7.66%
0.04% of residents moved to foreign countries ($348 average AGI )Oklahoma County:
0.04%Oklahoma average:
0.03%
Top counties to which taxpayers relocated from this county between 2020 and 2021:
Businesses in Midwest City, OK
Name Count Name Count
ALDI 1 Long John Silver's 1 AT&T 5 Lowe's 1 Ace Hardware 1 Marshalls 1 Advance Auto Parts 1 McDonald's 3 Arby's 2 Motel 6 1 Ashley Furniture 1 Nike 1 AutoZone 1 Office Depot 1 Best Western 1 Panda Express 1 Blockbuster 2 Panera Bread 1 Budget Car Rental 1 Papa John's Pizza 1 Burger King 1 Payless 2 CVS 2 Penske 1 Carl\s Jr. 1 PetSmart 1 Catherines 1 Pizza Hut 1 Chevrolet 1 Qdoba Mexican Grill 1 Chick-Fil-A 1 RadioShack 1 Church's Chicken 1 Rue21 1 Circle K 3 SONIC Drive-In 4 Comfort Inn 1 Sam's Club 1 Cricket Wireless 1 Sears 2 Curves 1 Sheraton 1 Domino's Pizza 1 Sprint Nextel 2 FedEx 6 Starbucks 2 Firestone Complete Auto Care 1 Steak 'n Shake 1 Ford 1 Subway 4 GameStop 1 Super 8 1 H&R Block 2 T-Mobile 3 Hawthorn 1 Taco Bell 2 Hilton 1 Target 1 Hobby Lobby 1 Toyota 1 Holiday Inn 1 U-Haul 4 Home Depot 1 U.S. Cellular 2 IHOP 1 UPS 2 JCPenney 1 Vans 1 Jones New York 1 Verizon Wireless 1 KFC 2 Walgreens 3 Kohl's 1 Wendy's 1 Lane Bryant 1 YMCA 1 Little Caesars Pizza 1
Strongest AM radio stations in Midwest City:
KOMA (1520 AM; 50 kW; OKLAHOMA CITY, OK; Owner: RENDA BROADCASTING CORP. OF NEVADA)
KTOK (1000 AM; 5 kW; OKLAHOMA CITY, OK; Owner: CLEAR CHANNEL BROADCASTING LICENSES, INC.)
WKY (930 AM; 5 kW; OKLAHOMA CITY, OK; Owner: CITADEL BROADCASTING COMPANY)
WWLS (640 AM; 5 kW; MOORE, OK; Owner: CITADEL BROADCASTING COMPANY)
KOCY (1560 AM; 1 kW; CHICKASHA, OK; Owner: TYLER ENTERPRISES, L.L.C.)
KTLR (890 AM; daytime; 1 kW; OKLAHOMA CITY, OK; Owner: TYLER BROADCASTING CORPORATION)
KEBC (1340 AM; 1 kW; OKLAHOMA CITY, OK; Owner: CLEAR CHANNEL BROADCASTING LICENSES, INC.)
KVSP (1140 AM; daytime; 1 kW; OKLAHOMA CITY, OK; Owner: PERRY BROADCASTING COMPANY, INC.)
KRMG (740 AM; 50 kW; TULSA, OK; Owner: CXR HOLDINGS, INC.)
KQCV (800 AM; 2 kW; OKLAHOMA CITY, OK; Owner: BOTT BROADCASTING COMPANY)
KTLV (1220 AM; 0 kW; MIDWEST CITY, OK; Owner: FIRST CHOICE BROADCASTING, INC.)
KFAQ (1170 AM; 50 kW; TULSA, OK; Owner: JOURNAL BROADCAST CORPORATION)
KREF (1400 AM; 1 kW; NORMAN, OK; Owner: FOX BROADCASTING CO, INC.)
Strongest FM radio stations in Midwest City:
KMGL (104.1 FM; OKLAHOMA CITY, OK; Owner: RENDA BROADCASTING CORP. OF NEVADA)
KHBZ-FM (94.7 FM; OKLAHOMA CITY, OK; Owner: CLEAR CHANNEL BROADCASTING LICENSES, INC.)
KTST (101.9 FM; OKLAHOMA CITY, OK; Owner: CLEAR CHANNEL BROADCASTING LICENSES, INC.)
KYIS (98.9 FM; OKLAHOMA CITY, OK; Owner: CITADEL BROADCASTING COMPANY)
KRXO (107.7 FM; OKLAHOMA CITY, OK; Owner: RENDA BROADCASTING CORPORATION OF NV)
KOMA-FM (92.5 FM; OKLAHOMA CITY, OK; Owner: RENDA BROADCASTING CORPORATION OF NV)
KATT-FM (100.5 FM; OKLAHOMA CITY, OK; Owner: CITADEL BROADCASTING COMPANY)
KJYO (102.7 FM; OKLAHOMA CITY, OK; Owner: CLEAR CHANNEL BROADCASTING LICENSES, INC.)
KXXY-FM (96.1 FM; OKLAHOMA CITY, OK; Owner: CLEAR CHANNEL BROADCASTING LICENSES, INC.)
K246AF (97.1 FM; OKLAHOMA CITY, OK; Owner: MICHAEL A. BROOKS / DBA JIME'NEZ COM)
K259AM (99.7 FM; OKLAHOMA CITY, OK; Owner: THE LOVE STATION, INC.)
KYLV (88.9 FM; OKLAHOMA CITY, OK; Owner: EDUCATIONAL MEDIA FOUNDATION)
KOKF (90.9 FM; EDMOND, OK; Owner: R.D.M BROADCASTING ENTERPRISES, INC.)
KCSC (90.1 FM; EDMOND, OK; Owner: THE UNIVERSITY OF CENTRAL OKLAHOMA)
KKNG-FM (93.3 FM; NEWCASTLE, OK; Owner: TYLER BROADCASTING CORPORATION)
KKWD (97.9 FM; EDMOND, OK; Owner: CITADEL BROADCASTING COMPANY)
KROU (105.7 FM; SPENCER, OK; Owner: UNIVERSITY OF OKLAHOMA)
K208CG (89.5 FM; OKLAHOMA CITY, OK; Owner: CALVARY CHAPEL OF TWIN FALLS, INC.)
KGOU (106.3 FM; NORMAN, OK; Owner: UNIVERSITY OF OKLAHOMA)
KTUZ-FM (106.7 FM; OKARCHE, OK; Owner: TYLER BROADCASTING CORPORATION)
TV broadcast stations around Midwest City:
KWTV (Channel 9; OKLAHOMA CITY, OK; Owner: GRIFFIN ENTITIES, L.L.C.)
KOCO-TV (Channel 5; OKLAHOMA CITY, OK; Owner: OHIO/OKLAHOMA HEARST- ARGYLE TELEVISION)
KOKH-TV (Channel 25; OKLAHOMA CITY, OK; Owner: KOKH LICENSEE, LLC)
KETA-TV (Channel 13; OKLAHOMA CITY, OK; Owner: OKLAHOMA EDUCATIONAL TELEVISION AUTHORITY)
KOCB (Channel 34; OKLAHOMA CITY, OK; Owner: KOCB LICENSEE, LLC)
KOPX (Channel 62; OKLAHOMA CITY, OK; Owner: PAXSON OKLAHOMA CITY LICENSE, INC.)
KFOR-TV (Channel 4; OKLAHOMA CITY, OK; Owner: NEW YORK TIMES MANAGEMENT SERVICES)
KSBI (Channel 52; OKLAHOMA CITY, OK; Owner: LOCKE SUPPLY CO.)
KTBO-TV (Channel 14; OKLAHOMA CITY, OK; Owner: TRINITY BROADCASTING OF OKLAHOMA CITY, INC.)
K69EK (Channel 69; OKLAHOMA CITY, OK; Owner: ARKANSAS MEDIA, L.L.C.)
KXOC-LP (Channel 54; OKLAHOMA CITY, OK; Owner: LOCKE SUPPLY CO.)
KDSA-LP (Channel 11; NORMAN, OK; Owner: DAY STAR BROADCASTING CORPORATION)
KOHC-LP (Channel 7; OKLAHOMA CITY, OK; Owner: TIGER EYE BROADCASTING CORPORATION)
KQOK (Channel 30; SHAWNEE, OK; Owner: SHAWNEE BROADCASTING, INC.)
KCHM-LP (Channel 59; OKLAHOMA CITY, OK; Owner: TIGER EYE BROADCASTING CORPORATION)
K30EC (Channel 30; BATESVILLE, AR; Owner: MS COMMUNICATIONS, LLC)
KLHO-LP (Channel 17; OKLAHOMA CITY, OK; Owner: ARACELIS ORTIZ, EXECUTRIX OF THE ESTATE OF CARLOS ORTIZ)
KKCC-LP (Channel 19; OKLAHOMA CITY, OK; Owner: EICB-TV, LLC)
KTOU-LP (Channel 21; OKLAHOMA CITY, OK; Owner: MAKO COMMUNICATIONS, LLC)
National Bridge Inventory (NBI) Statistics 39 Number of bridges305ft / 93.4m Total length $48,268,000 Total costs686,389 Total average daily traffic65,173 Total average daily truck traffic
New bridges - historical statistics
1 1920-1929 3 1930-1939 3 1940-1949 1 1950-1959 16 1960-1969 6 1970-1979 1 1980-1989 2 1990-1999 2 2000-2009 4 2010-2019
See full National Bridge Inventory statistics for Midwest City, OK
Home Mortgage Disclosure Act Aggregated Statistics For Year 2009(Based on 16 full and 5 partial tracts) A) FHA, FSA/RHS & VA B) Conventional C) Refinancings D) Home Improvement Loans E) Loans on Dwellings For 5+ Families F) Non-occupant Loans on G) Loans On Manufactured Number Average Value Number Average Value Number Average Value Number Average Value Number Average Value Number Average Value Number Average Value
LOANS ORIGINATED 456 $106,515 170 $78,359 676 $105,438 248 $19,522 1 $2,875,850 159 $58,026 11 $20,819 APPLICATIONS APPROVED, NOT ACCEPTED 13 $94,340 10 $99,496 73 $96,934 24 $20,761 0 $0 10 $38,985 3 $44,817 APPLICATIONS DENIED 49 $87,736 51 $71,320 358 $87,927 174 $18,804 0 $0 42 $53,726 10 $31,848 APPLICATIONS WITHDRAWN 37 $113,774 16 $107,655 231 $99,185 11 $37,701 0 $0 20 $50,469 1 $84,000 FILES CLOSED FOR INCOMPLETENESS 8 $83,632 4 $84,872 55 $101,499 5 $172,448 0 $0 5 $73,478 0 $0
Aggregated Statistics For Year 2008(Based on 16 full and 5 partial tracts) A) FHA, FSA/RHS & VA B) Conventional C) Refinancings D) Home Improvement Loans F) Non-occupant Loans on G) Loans On Manufactured Number Average Value Number Average Value Number Average Value Number Average Value Number Average Value Number Average Value
LOANS ORIGINATED 371 $107,045 284 $93,355 469 $82,559 295 $22,833 205 $58,615 17 $28,215 APPLICATIONS APPROVED, NOT ACCEPTED 22 $108,352 23 $58,640 62 $82,619 27 $30,635 14 $67,530 13 $29,475 APPLICATIONS DENIED 48 $95,054 84 $77,691 444 $92,504 223 $24,808 50 $52,315 12 $38,855 APPLICATIONS WITHDRAWN 21 $111,666 35 $91,287 177 $96,517 26 $57,221 24 $55,527 0 $0 FILES CLOSED FOR INCOMPLETENESS 7 $70,261 9 $73,592 30 $100,493 4 $69,330 2 $54,810 1 $136,000
Aggregated Statistics For Year 2007(Based on 16 full and 5 partial tracts) A) FHA, FSA/RHS & VA B) Conventional C) Refinancings D) Home Improvement Loans E) Loans on Dwellings For 5+ Families F) Non-occupant Loans on G) Loans On Manufactured Number Average Value Number Average Value Number Average Value Number Average Value Number Average Value Number Average Value Number Average Value
LOANS ORIGINATED 262 $112,375 666 $87,246 578 $73,232 309 $24,035 2 $513,990 251 $59,704 14 $32,441 APPLICATIONS APPROVED, NOT ACCEPTED 14 $89,089 67 $85,236 122 $83,765 30 $33,786 1 $734,380 17 $75,299 8 $44,912 APPLICATIONS DENIED 26 $91,824 151 $81,479 603 $86,288 259 $33,695 0 $0 77 $62,437 25 $51,666 APPLICATIONS WITHDRAWN 13 $110,401 66 $89,301 248 $87,905 43 $55,115 1 $2,976,940 22 $64,916 0 $0 FILES CLOSED FOR INCOMPLETENESS 1 $151,020 21 $84,897 62 $97,771 4 $68,685 0 $0 6 $58,395 0 $0
Aggregated Statistics For Year 2006(Based on 16 full and 5 partial tracts) A) FHA, FSA/RHS & VA B) Conventional C) Refinancings D) Home Improvement Loans E) Loans on Dwellings For 5+ Families F) Non-occupant Loans on G) Loans On Manufactured Number Average Value Number Average Value Number Average Value Number Average Value Number Average Value Number Average Value Number Average Value
LOANS ORIGINATED 301 $100,833 836 $78,012 687 $72,555 310 $22,564 2 $2,255,235 333 $56,172 19 $35,608 APPLICATIONS APPROVED, NOT ACCEPTED 11 $96,085 119 $61,791 135 $89,583 33 $28,828 1 $5,000,000 42 $51,897 26 $42,208 APPLICATIONS DENIED 20 $96,779 220 $73,802 670 $81,366 318 $30,275 0 $0 70 $58,515 37 $34,082 APPLICATIONS WITHDRAWN 22 $94,295 115 $78,035 394 $83,325 62 $40,061 0 $0 41 $62,817 0 $0 FILES CLOSED FOR INCOMPLETENESS 1 $56,000 35 $78,511 93 $86,846 3 $87,553 0 $0 10 $78,876 0 $0
Aggregated Statistics For Year 2005(Based on 16 full and 5 partial tracts) A) FHA, FSA/RHS & VA B) Conventional C) Refinancings D) Home Improvement Loans E) Loans on Dwellings For 5+ Families F) Non-occupant Loans on G) Loans On Manufactured Number Average Value Number Average Value Number Average Value Number Average Value Number Average Value Number Average Value Number Average Value
LOANS ORIGINATED 290 $93,723 860 $74,160 801 $71,845 333 $25,790 2 $1,385,895 338 $50,923 15 $21,517 APPLICATIONS APPROVED, NOT ACCEPTED 16 $83,771 105 $68,703 142 $85,113 23 $28,094 0 $0 20 $51,379 23 $52,273 APPLICATIONS DENIED 38 $73,059 256 $69,103 777 $79,384 318 $24,044 0 $0 99 $55,797 48 $49,087 APPLICATIONS WITHDRAWN 13 $90,135 208 $78,824 513 $86,095 75 $96,073 0 $0 35 $79,757 2 $44,640 FILES CLOSED FOR INCOMPLETENESS 3 $94,923 28 $65,766 74 $93,311 7 $74,680 0 $0 13 $70,015 0 $0
Aggregated Statistics For Year 2004(Based on 16 full and 5 partial tracts) A) FHA, FSA/RHS & VA B) Conventional C) Refinancings D) Home Improvement Loans E) Loans on Dwellings For 5+ Families F) Non-occupant Loans on G) Loans On Manufactured Number Average Value Number Average Value Number Average Value Number Average Value Number Average Value Number Average Value Number Average Value
LOANS ORIGINATED 324 $89,000 682 $75,109 958 $72,789 278 $19,629 2 $2,411,000 306 $46,997 21 $29,794 APPLICATIONS APPROVED, NOT ACCEPTED 20 $79,630 67 $79,229 197 $73,000 28 $31,480 0 $0 23 $39,329 10 $52,061 APPLICATIONS DENIED 24 $77,462 172 $60,116 768 $74,837 256 $23,060 0 $0 63 $42,047 55 $35,752 APPLICATIONS WITHDRAWN 20 $89,746 86 $75,500 496 $86,045 31 $50,370 0 $0 32 $48,013 1 $66,280 FILES CLOSED FOR INCOMPLETENESS 5 $95,282 29 $83,166 79 $84,756 6 $35,785 0 $0 10 $43,568 0 $0
Aggregated Statistics For Year 2003(Based on 16 full and 5 partial tracts) A) FHA, FSA/RHS & VA B) Conventional C) Refinancings D) Home Improvement Loans E) Loans on Dwellings For 5+ Families F) Non-occupant Loans on Number Average Value Number Average Value Number Average Value Number Average Value Number Average Value Number Average Value
LOANS ORIGINATED 399 $81,997 511 $75,831 1,739 $72,115 274 $14,220 2 $2,322,945 315 $54,957 APPLICATIONS APPROVED, NOT ACCEPTED 9 $72,880 56 $73,972 222 $71,010 18 $20,856 0 $0 26 $48,008 APPLICATIONS DENIED 38 $91,749 149 $64,512 829 $69,644 140 $12,804 1 $922,930 61 $45,115 APPLICATIONS WITHDRAWN 23 $81,535 50 $67,918 459 $74,980 23 $19,186 0 $0 32 $50,982 FILES CLOSED FOR INCOMPLETENESS 4 $75,832 19 $61,426 135 $72,299 2 $38,635 0 $0 12 $54,105
Aggregated Statistics For Year 2002(Based on 14 full and 5 partial tracts) A) FHA, FSA/RHS & VA B) Conventional C) Refinancings D) Home Improvement Loans E) Loans on Dwellings For 5+ Families F) Non-occupant Loans on Number Average Value Number Average Value Number Average Value Number Average Value Number Average Value Number Average Value
LOANS ORIGINATED 358 $68,865 323 $61,725 856 $60,665 233 $14,441 2 $1,062,440 235 $39,684 APPLICATIONS APPROVED, NOT ACCEPTED 9 $71,784 42 $59,688 170 $57,338 17 $24,465 1 $3,200,000 13 $42,601 APPLICATIONS DENIED 27 $60,874 83 $60,910 465 $54,137 115 $13,563 0 $0 39 $43,236 APPLICATIONS WITHDRAWN 18 $62,434 37 $83,052 287 $63,065 23 $21,317 0 $0 12 $45,552 FILES CLOSED FOR INCOMPLETENESS 4 $64,125 18 $67,152 136 $75,555 0 $0 0 $0 17 $43,281
Aggregated Statistics For Year 2001(Based on 14 full and 5 partial tracts) A) FHA, FSA/RHS & VA B) Conventional C) Refinancings D) Home Improvement Loans E) Loans on Dwellings For 5+ Families F) Non-occupant Loans on Number Average Value Number Average Value Number Average Value Number Average Value Number Average Value Number Average Value
LOANS ORIGINATED 368 $65,111 305 $55,997 730 $56,869 253 $13,068 3 $549,720 192 $37,614 APPLICATIONS APPROVED, NOT ACCEPTED 6 $76,167 62 $37,700 143 $53,672 23 $17,521 0 $0 18 $32,232 APPLICATIONS DENIED 48 $66,530 158 $44,562 552 $51,777 159 $13,163 2 $10,125,000 65 $34,315 APPLICATIONS WITHDRAWN 20 $56,348 42 $63,691 401 $57,655 28 $21,614 0 $0 16 $48,090 FILES CLOSED FOR INCOMPLETENESS 9 $62,231 12 $51,029 71 $55,887 0 $0 1 $1,900,000 3 $51,807
Aggregated Statistics For Year 2000(Based on 14 full and 5 partial tracts) A) FHA, FSA/RHS & VA B) Conventional C) Refinancings D) Home Improvement Loans E) Loans on Dwellings For 5+ Families F) Non-occupant Loans on Number Average Value Number Average Value Number Average Value Number Average Value Number Average Value Number Average Value
LOANS ORIGINATED 363 $57,224 365 $51,324 385 $46,779 230 $12,305 2 $9,825,000 131 $34,579 APPLICATIONS APPROVED, NOT ACCEPTED 9 $56,394 63 $41,891 109 $49,348 48 $21,955 0 $0 10 $36,895 APPLICATIONS DENIED 45 $53,265 207 $39,171 381 $49,352 189 $14,497 0 $0 41 $28,167 APPLICATIONS WITHDRAWN 30 $60,023 45 $60,719 209 $49,356 32 $18,826 1 $694,680 15 $35,070 FILES CLOSED FOR INCOMPLETENESS 4 $73,330 15 $47,572 37 $56,311 3 $16,790 0 $0 3 $44,250
Aggregated Statistics For Year 1999(Based on 14 full and 6 partial tracts) A) FHA, FSA/RHS & VA B) Conventional C) Refinancings D) Home Improvement Loans E) Loans on Dwellings For 5+ Families F) Non-occupant Loans on Number Average Value Number Average Value Number Average Value Number Average Value Number Average Value Number Average Value
LOANS ORIGINATED 468 $64,137 381 $61,511 667 $49,659 253 $12,963 1 $148,950 152 $36,150 APPLICATIONS APPROVED, NOT ACCEPTED 7 $79,290 63 $43,399 188 $49,402 33 $17,702 0 $0 22 $36,684 APPLICATIONS DENIED 67 $58,681 250 $41,778 474 $49,492 205 $16,217 1 $100,000 44 $37,318 APPLICATIONS WITHDRAWN 33 $63,038 45 $61,216 254 $53,305 25 $39,148 0 $0 14 $48,007 FILES CLOSED FOR INCOMPLETENESS 5 $59,324 6 $54,808 112 $50,624 5 $42,342 0 $0 4 $37,118
Detailed mortgage data for all 21 tracts in Midwest City, OK
Private Mortgage Insurance Companies Aggregated Statistics For Year 2009(Based on 12 full and 4 partial tracts) A) Conventional B) Refinancings C) Non-occupant Loans on Number Average Value Number Average Value Number Average Value
LOANS ORIGINATED 23 $111,890 19 $134,274 1 $105,400 APPLICATIONS APPROVED, NOT ACCEPTED 3 $107,463 14 $125,142 1 $50,000 APPLICATIONS DENIED 2 $208,355 4 $172,278 1 $109,260 APPLICATIONS WITHDRAWN 1 $88,000 3 $124,067 0 $0 FILES CLOSED FOR INCOMPLETENESS 3 $72,743 0 $0 2 $52,000
Aggregated Statistics For Year 2008(Based on 15 full and 5 partial tracts) A) Conventional B) Refinancings C) Non-occupant Loans on Number Average Value Number Average Value Number Average Value
LOANS ORIGINATED 108 $94,060 46 $119,698 28 $55,140 APPLICATIONS APPROVED, NOT ACCEPTED 41 $87,701 24 $85,200 10 $59,838 APPLICATIONS DENIED 11 $81,445 6 $121,602 5 $69,716 APPLICATIONS WITHDRAWN 6 $86,135 1 $67,000 2 $52,000 FILES CLOSED FOR INCOMPLETENESS 3 $66,177 3 $123,467 2 $67,265
Aggregated Statistics For Year 2007(Based on 16 full and 5 partial tracts) A) Conventional B) Refinancings C) Non-occupant Loans on Number Average Value Number Average Value Number Average Value
LOANS ORIGINATED 293 $90,073 86 $94,874 54 $61,166 APPLICATIONS APPROVED, NOT ACCEPTED 22 $97,730 15 $85,239 5 $64,016 APPLICATIONS DENIED 1 $147,010 2 $93,500 0 $0 APPLICATIONS WITHDRAWN 7 $120,956 3 $160,960 1 $153,000 FILES CLOSED FOR INCOMPLETENESS 1 $65,040 0 $0 1 $56,000
Aggregated Statistics For Year 2006(Based on 15 full and 5 partial tracts) A) Conventional B) Refinancings C) Non-occupant Loans on Number Average Value Number Average Value Number Average Value
LOANS ORIGINATED 184 $88,098 67 $94,671 52 $56,028 APPLICATIONS APPROVED, NOT ACCEPTED 20 $80,074 17 $95,366 7 $60,796 APPLICATIONS DENIED 1 $78,470 0 $0 1 $78,470 APPLICATIONS WITHDRAWN 8 $123,895 6 $88,842 0 $0 FILES CLOSED FOR INCOMPLETENESS 1 $95,000 0 $0 0 $0
Aggregated Statistics For Year 2005(Based on 16 full and 5 partial tracts) A) Conventional B) Refinancings C) Non-occupant Loans on Number Average Value Number Average Value Number Average Value
LOANS ORIGINATED 186 $86,172 73 $97,157 44 $54,964 APPLICATIONS APPROVED, NOT ACCEPTED 13 $84,131 25 $79,431 7 $64,301 APPLICATIONS DENIED 1 $87,250 0 $0 1 $53,000 APPLICATIONS WITHDRAWN 8 $103,120 8 $90,908 1 $80,000 FILES CLOSED FOR INCOMPLETENESS 2 $59,000 4 $84,478 2 $33,500
Aggregated Statistics For Year 2004(Based on 16 full and 5 partial tracts) A) Conventional B) Refinancings C) Non-occupant Loans on Number Average Value Number Average Value Number Average Value
LOANS ORIGINATED 163 $73,333 90 $83,662 62 $48,784 APPLICATIONS APPROVED, NOT ACCEPTED 17 $95,927 36 $99,108 5 $59,770 APPLICATIONS DENIED 3 $106,197 2 $66,500 2 $38,390 APPLICATIONS WITHDRAWN 12 $67,715 6 $69,428 6 $36,567 FILES CLOSED FOR INCOMPLETENESS 0 $0 0 $0 0 $0
Aggregated Statistics For Year 2003(Based on 16 full and 5 partial tracts) A) Conventional B) Refinancings C) Non-occupant Loans on Number Average Value Number Average Value Number Average Value
LOANS ORIGINATED 158 $83,814 220 $87,448 54 $50,360 APPLICATIONS APPROVED, NOT ACCEPTED 15 $92,523 49 $94,166 5 $54,090 APPLICATIONS DENIED 1 $45,650 3 $61,333 1 $43,000 APPLICATIONS WITHDRAWN 6 $72,568 22 $97,226 4 $58,355 FILES CLOSED FOR INCOMPLETENESS 0 $0 3 $113,187 0 $0
Aggregated Statistics For Year 2002(Based on 14 full and 5 partial tracts) A) Conventional B) Refinancings C) Non-occupant Loans on Number Average Value Number Average Value Number Average Value
LOANS ORIGINATED 99 $74,828 118 $79,639 37 $50,032 APPLICATIONS APPROVED, NOT ACCEPTED 16 $69,534 28 $71,362 6 $47,887 APPLICATIONS DENIED 2 $106,500 8 $72,332 3 $58,887 APPLICATIONS WITHDRAWN 4 $76,872 10 $72,255 3 $51,757 FILES CLOSED FOR INCOMPLETENESS 0 $0 1 $60,000 0 $0
Aggregated Statistics For Year 2001(Based on 14 full and 5 partial tracts) A) Conventional B) Refinancings C) Non-occupant Loans on Number Average Value Number Average Value Number Average Value
LOANS ORIGINATED 78 $71,821 80 $73,368 22 $41,745 APPLICATIONS APPROVED, NOT ACCEPTED 11 $63,190 14 $71,219 5 $45,468 APPLICATIONS DENIED 2 $78,500 3 $81,210 0 $0 APPLICATIONS WITHDRAWN 1 $114,000 2 $62,030 1 $31,760 FILES CLOSED FOR INCOMPLETENESS 1 $138,870 2 $48,765 1 $45,930
Aggregated Statistics For Year 2000(Based on 13 full and 5 partial tracts) A) Conventional B) Refinancings C) Non-occupant Loans on Number Average Value Number Average Value Number Average Value
LOANS ORIGINATED 85 $62,962 38 $59,918 19 $32,775 APPLICATIONS APPROVED, NOT ACCEPTED 8 $59,758 4 $92,528 4 $39,765 APPLICATIONS DENIED 1 $82,490 4 $77,680 1 $28,060 APPLICATIONS WITHDRAWN 4 $41,060 2 $53,500 3 $36,000 FILES CLOSED FOR INCOMPLETENESS 2 $56,500 1 $175,000 0 $0
Aggregated Statistics For Year 1999(Based on 14 full and 6 partial tracts) A) Conventional B) Refinancings C) Non-occupant Loans on Number Average Value Number Average Value Number Average Value
LOANS ORIGINATED 99 $79,485 59 $72,392 18 $35,719 APPLICATIONS APPROVED, NOT ACCEPTED 13 $84,176 12 $61,983 2 $20,525 APPLICATIONS DENIED 4 $48,135 1 $251,650 1 $11,540 APPLICATIONS WITHDRAWN 2 $77,500 5 $52,984 1 $28,460 FILES CLOSED FOR INCOMPLETENESS 0 $0 2 $82,890 0 $0
Fire-safe hotels and motels in Midwest City, Oklahoma:
La Quinta Inns & Suites, 5653 Tinker Diagonal, Midwest City, Oklahoma 73110 Phone: (405) 733-1339, Fax: (405) 732-6550
Hampton Inn 140 East/Tinker Afb, 1833 Center Dr, Midwest City, Oklahoma 73110 Phone: (405) 732-5500, Fax: (405) 732-5514
Hawthorn Suites, 5701 Tinker Diagonal, Midwest City, Oklahoma 73110 Phone: (405) 737-7777, Fax: (405) 737-7773
Super 8 Motel, 6821 SE 29th St, Midwest City, Oklahoma 73110 Phone: (405) 737-8880, Fax: (405) 732-0815
All 4 fire-safe hotels and motels in Midwest City, Oklahoma Midwest City compared to Oklahoma state average:
Unemployed percentage significantly below state average. Black race population percentage significantly above state average. Foreign-born population percentage below state average. Length of stay since moving in significantly above state average. Midwest City on our top lists :
#5 on the list of "Top 101 cities with largest percentage of males in occupations: installation, maintenance, and repair occupations (population 50,000+)"
#5 on the list of "Top 101 cities with the largest city-data.com crime index increase from 2002 to 2012 (population 50,000+)"
#7 on the list of "Top 101 cities with largest percentage of males in industries: public administration (population 50,000+)"
#14 on the list of "Top 101 cities with largest percentage of females in industries: public administration (population 50,000+)"
#27 on the list of "Top 101 cities with largest percentage of males in occupations: health technologists and technicians (population 50,000+)"
#31 on the list of "Top 101 cities with the highest average wind speeds (population 50,000+)"
#41 on the list of "Top 101 cities with largest percentage of females in occupations: construction and extraction occupations (population 50,000+)"
#49 on the list of "Top 101 cities with the least people having Doctorate degrees (population 50,000+)"
#52 on the list of "Top 101 cities with largest percentage of females in occupations: office and administrative support occupations (population 50,000+)"
#54 on the list of "Top 101 cities with the highest number of rapes per 100,000 residents, excludes tourist destinations and others with a lot of outsiders visiting based on city industries data (population 50,000+)"
#55 on the list of "Top 101 cities with the highest percentage of English-only speaking households, population 50,000+"
#61 on the list of "Top 100 high-educated but low-earning cities (pop. 50,000+)"
#67 on the list of "Top 101 cities with largest percentage of males in occupations: office and administrative support occupations (population 50,000+)"
#76 on the list of "Top 101 cities with the smallest percentage of likely homosexual households (counted as self-reported same-sex unmarried-partner households) (population 50,000+)"
#77 on the list of "Top 101 cities with the highest number of burglaries per 100,000 residents, excludes tourist destinations and others with a lot of outsiders visiting based on city industries data (population 50,000+)"
#77 on the list of "Top 101 cities with the largest percentage of one, detached housing units in structures (20,000+ housing units)"
#78 on the list of "Top 101 cities with largest percentage of females in industries: mining, quarrying, and oil and gas extraction (population 50,000+)"
#87 on the list of "Top 101 cities with the highest number of arson incidents per 100,000 residents, excludes tourist destinations and others with a lot of outsiders visiting based on city industries data (population 50,000+)"
#87 on the list of "Top 101 cities with the highest average snowfall in a year (population 50,000+)"
#92 on the list of "Top 100 cities with lowest ratio of median house value to median household income (pop. 50,000+)"
#16 (73145) on the list of "Top 101 zip codes with the smallest percentage of taxpayers reporting profit/loss from business in 2012 (pop 1,000+)"
#41 (73084) on the list of "Top 101 zip codes with the largest percentage of Scottish first ancestries (pop 5,000+)"
#44 (73145) on the list of "Top 101 zip codes with the smallest percentage of taxpayers using paid preparers for 2012 taxes (pop 1,000+)"
#45 (73145) on the list of "Top 101 zip codes with the lowest 2012 average reported profit/loss from business (pop 1,000+)"
#55 (73145) on the list of "Top 101 zip codes with the largest percentage of returns reporting salary or wage in 2012 (pop 1,000+)"
#1 on the list of "Top 101 counties with the lowest Sulfur Oxides Annual air pollution readings in 2012 (µg/m3 )"
#7 on the list of "Top 101 counties with the highest lead air pollution readings in 2012 (µg/m3 )"
#8 on the list of "Top 101 counties with the most Evangelical Protestant adherents"
#17 on the list of "Top 101 counties with the most Evangelical Protestant congregations"
#21 on the list of "Top 101 counties with the lowest lead air pollution readings in 2012 (µg/m3 )"
Top Patent Applicants
Christopher S. Jordan (3)
Richard S. Brush (3)
Marcos Bitela (2)
Pamela Bitela (2)
Sherry Crowe (2)
Anne Kasus-Jacobi (1)
Ann Kasus-Jacobi (1)
Shaw Furukawa (1)
Eric Thomas Gohr (1)
Richard Norton (1)
Total of 21 patent applications in 2008-2024.


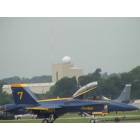
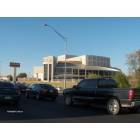
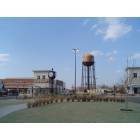

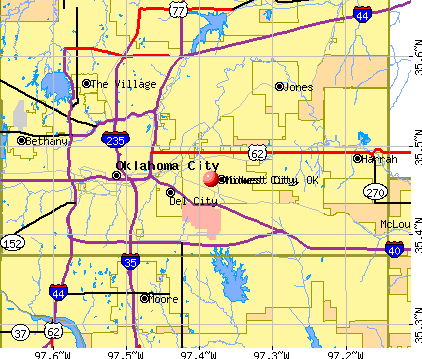


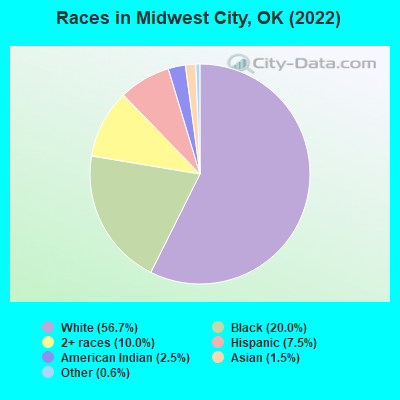
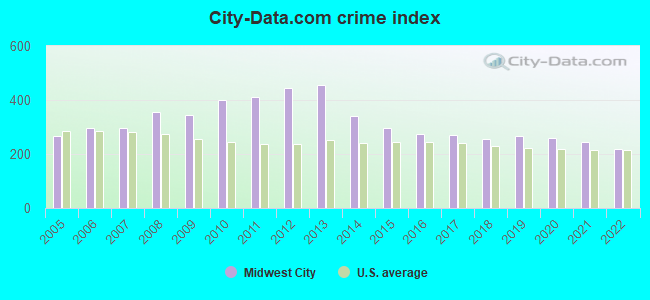
 Recent articles from our blog. Our writers, many of them Ph.D. graduates or candidates, create easy-to-read articles on a wide variety of topics.

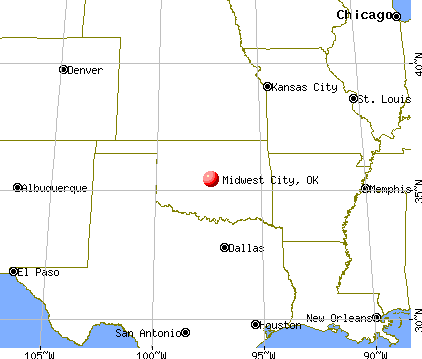
 (8.6 miles
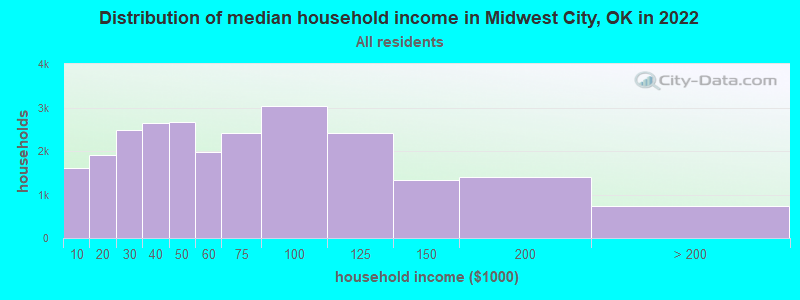
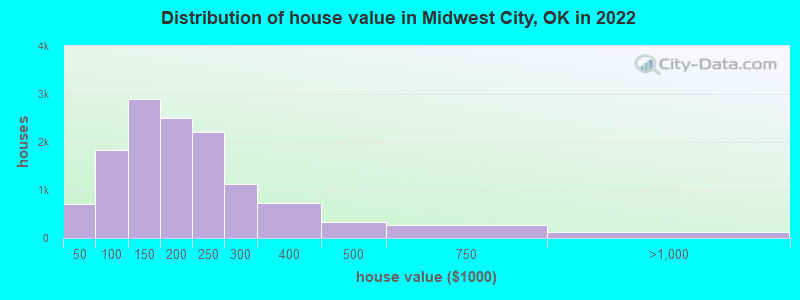
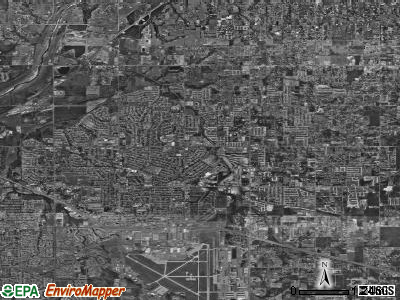
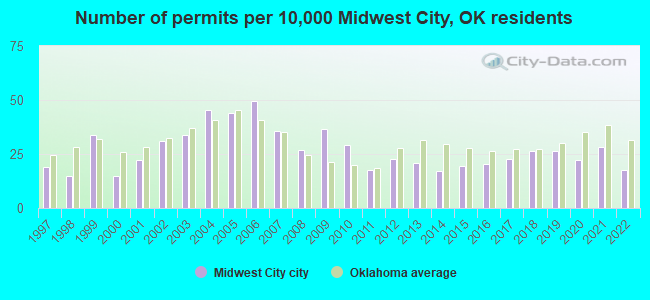
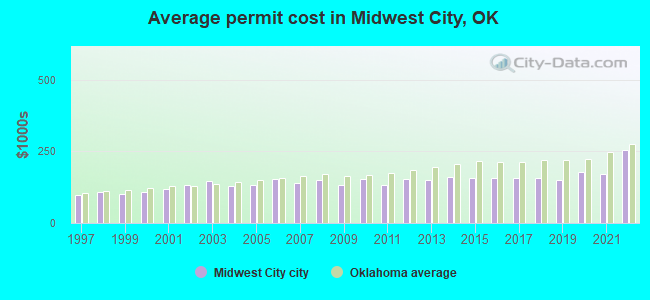
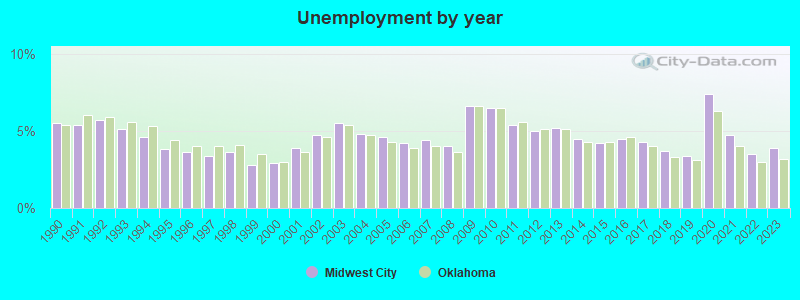
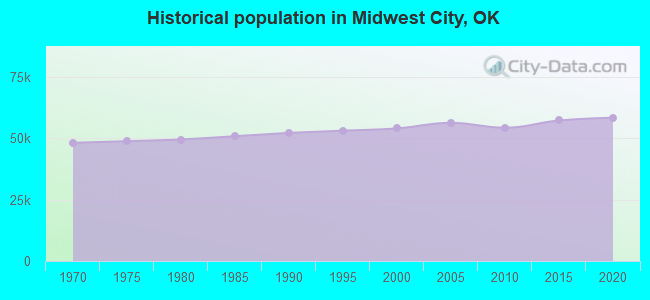
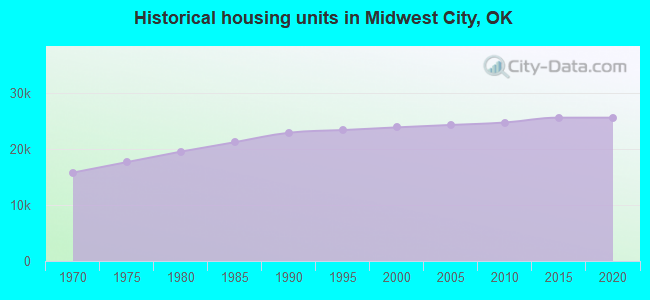
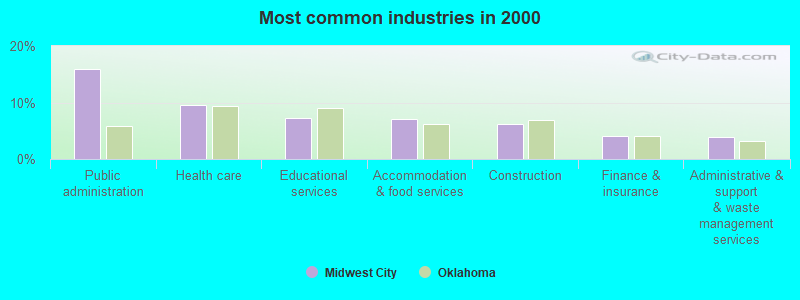
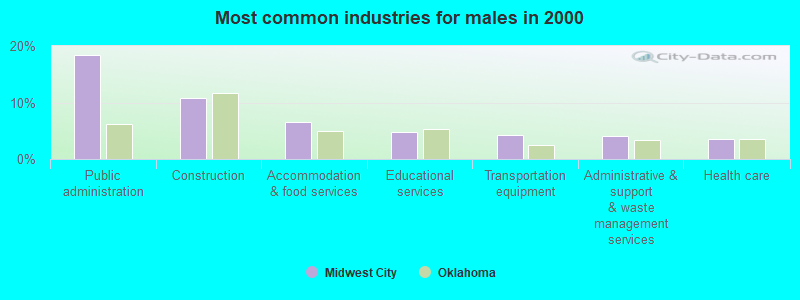
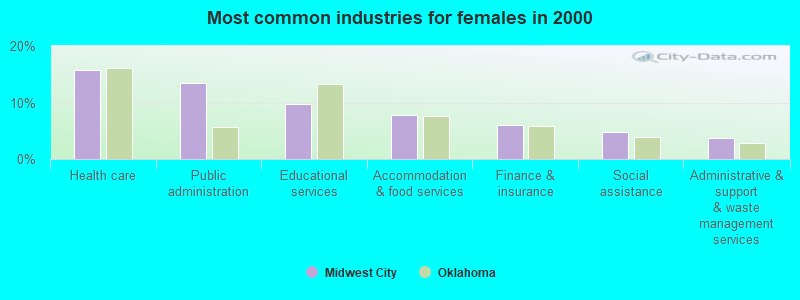
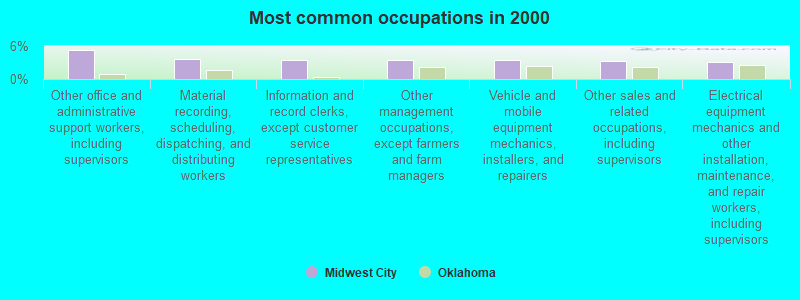
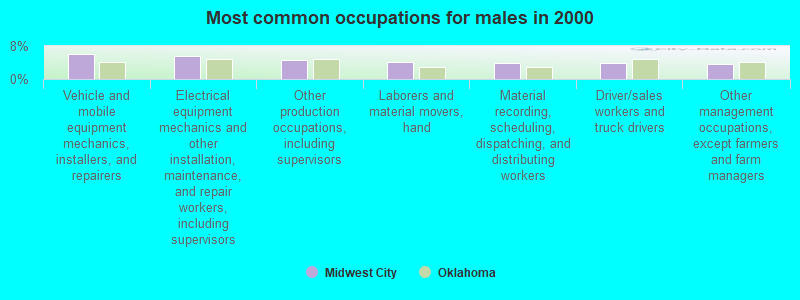
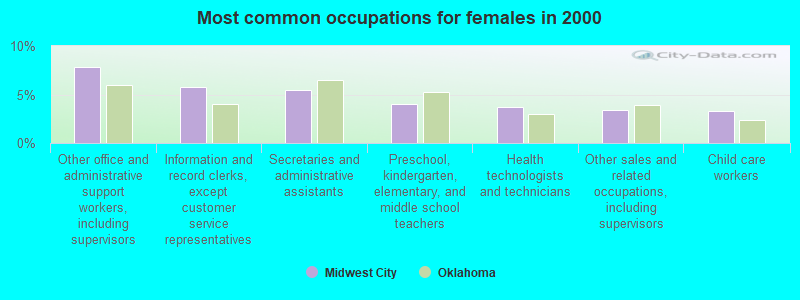
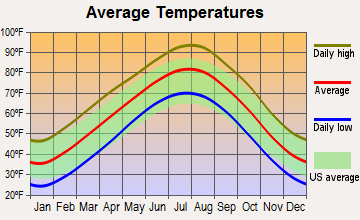
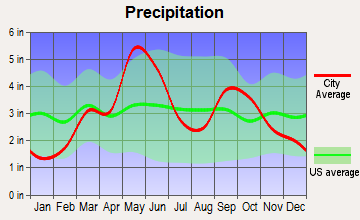
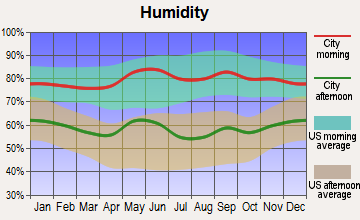
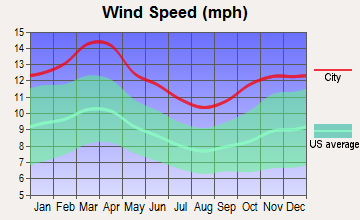
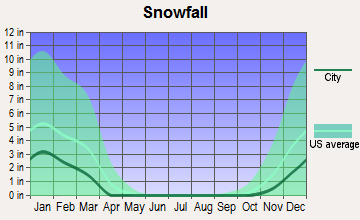
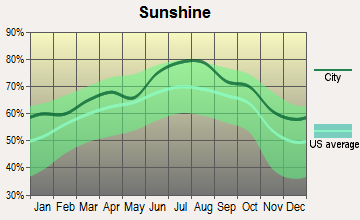
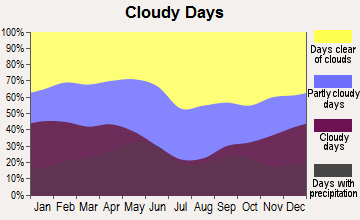
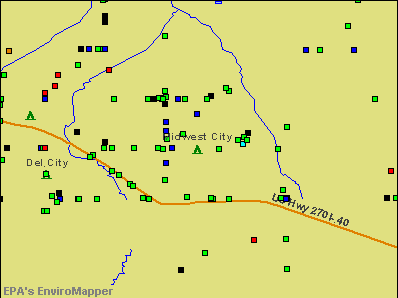

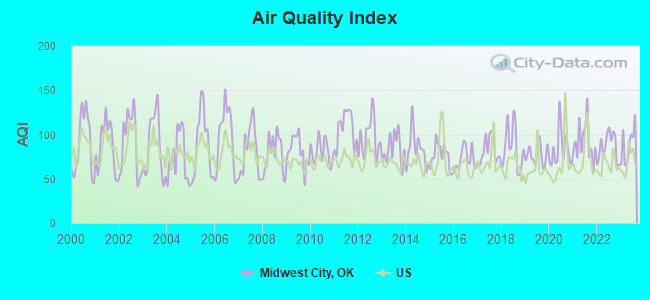
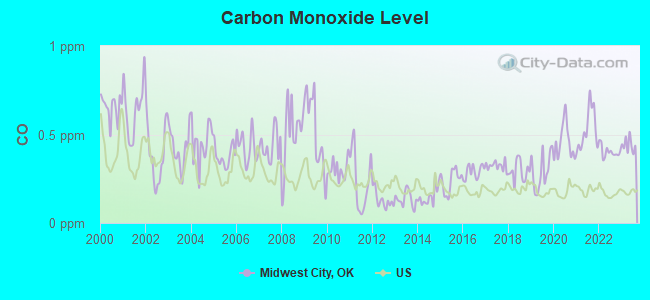
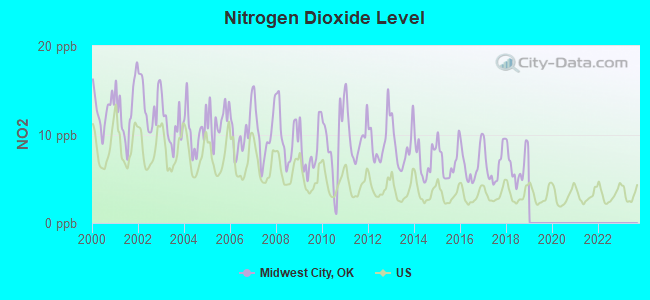
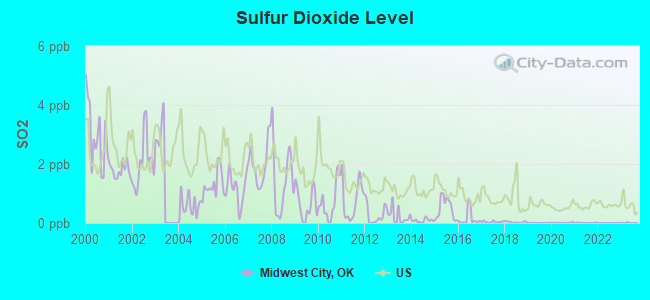
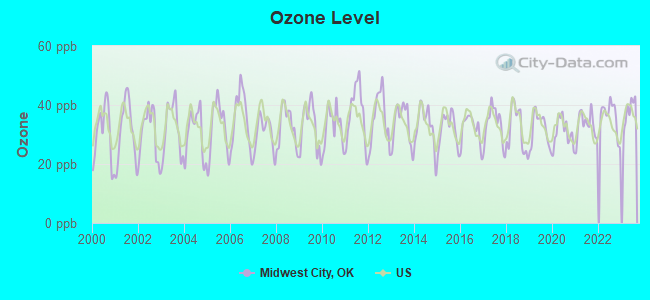
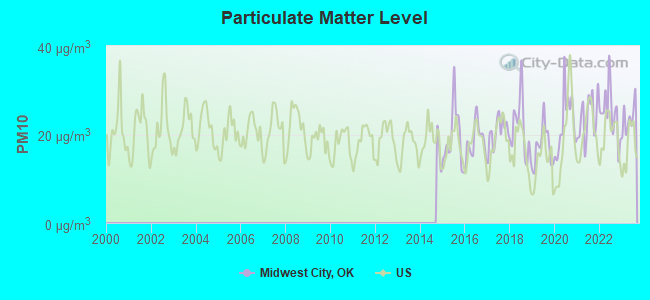
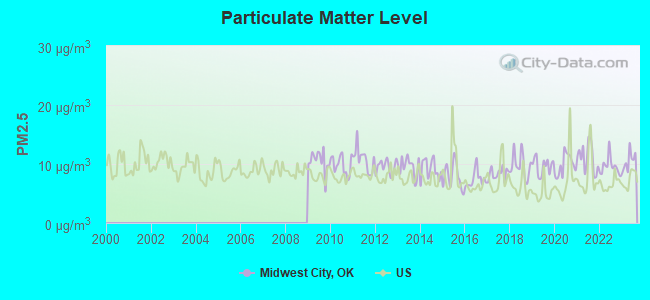
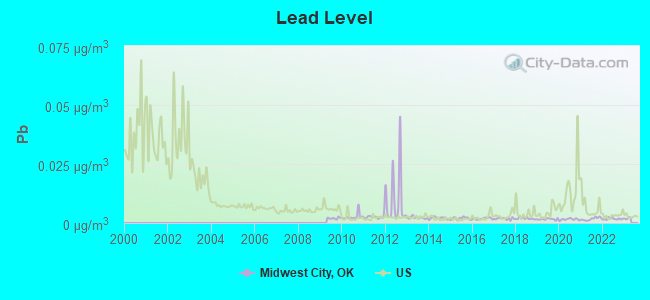
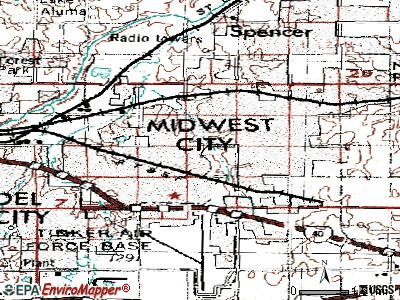
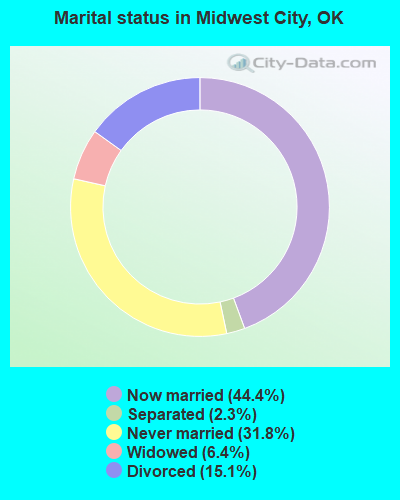
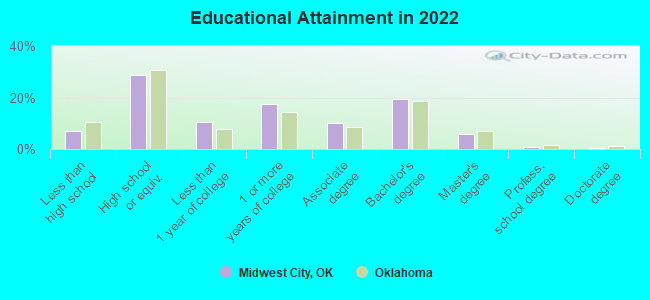
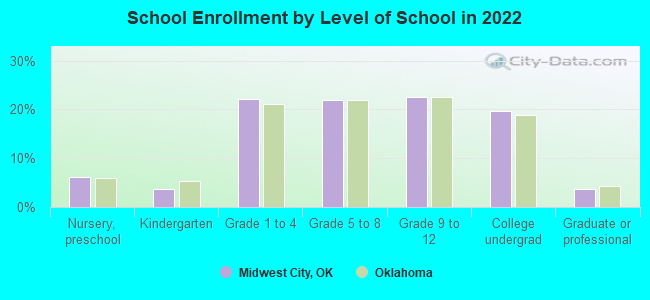
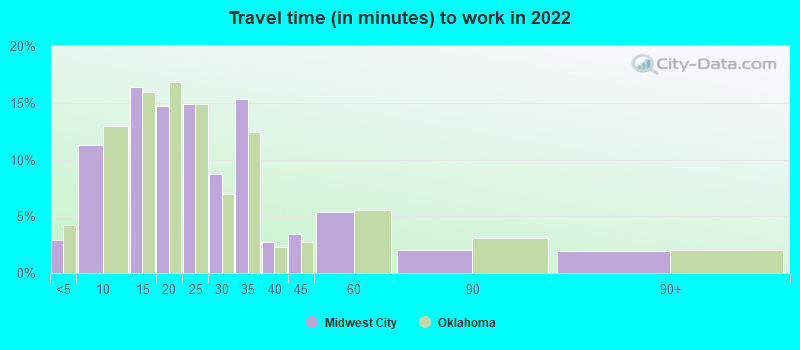
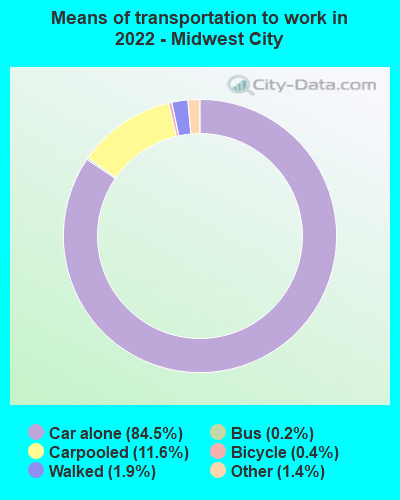
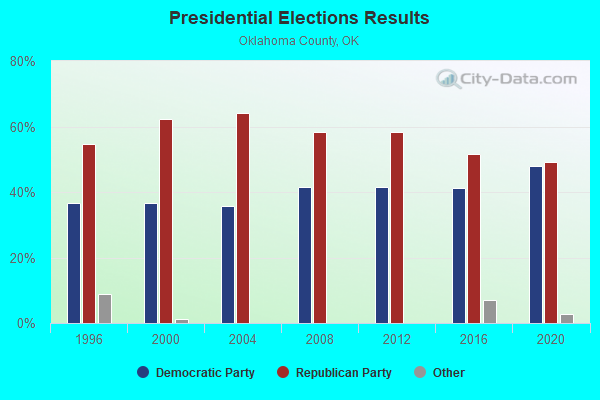
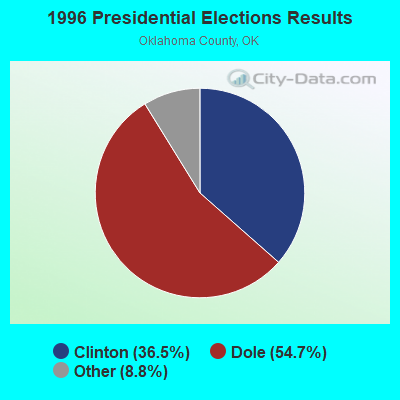
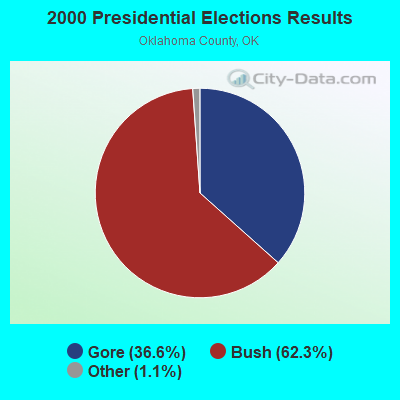
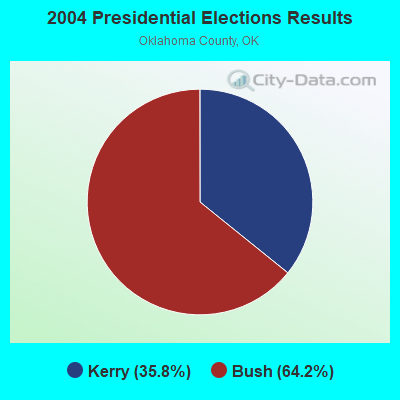
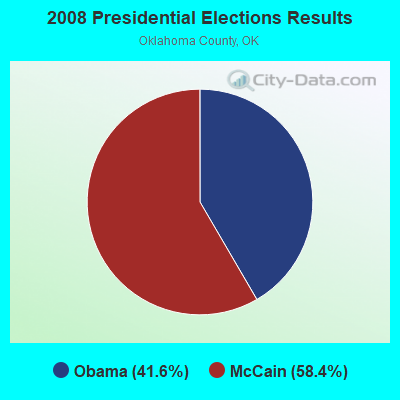
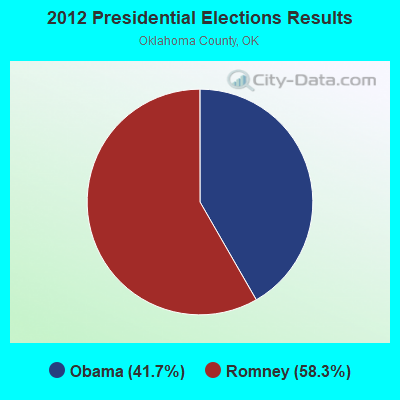
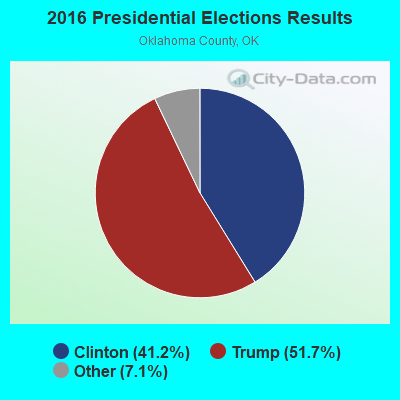
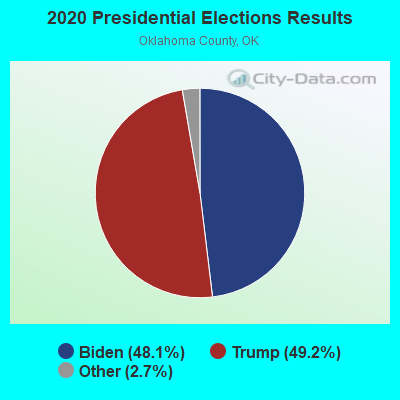
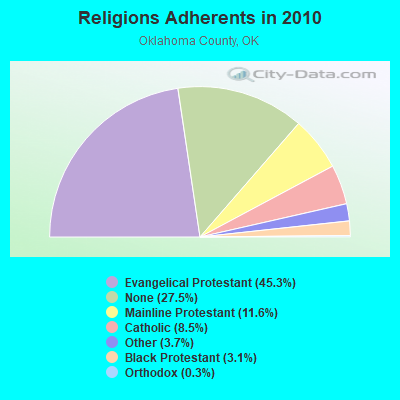
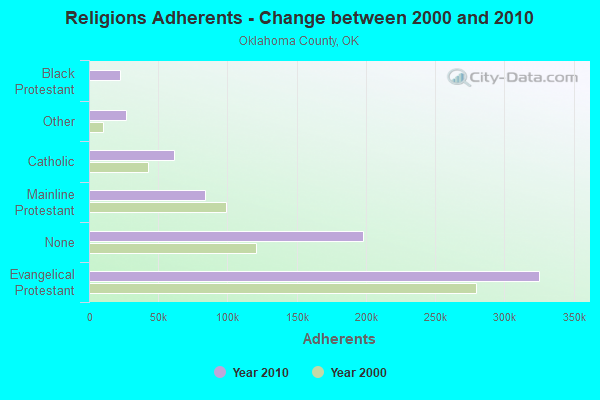
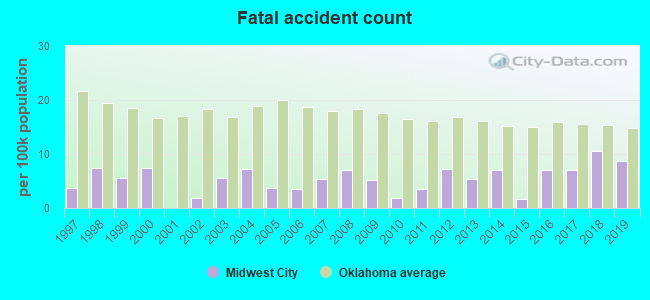
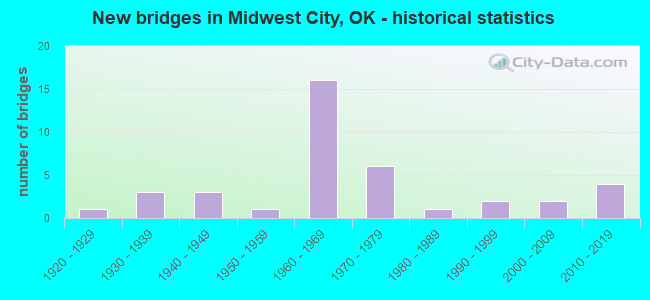
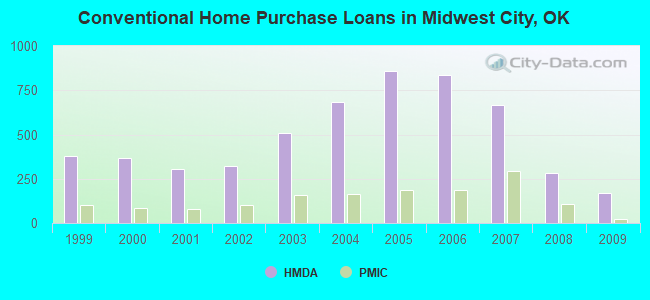
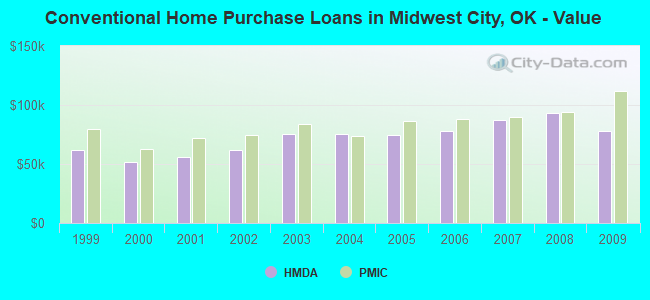
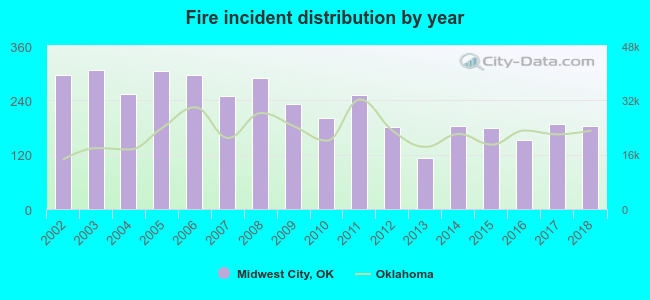 According to the data from the years 2002 - 2018 the average number of fire incidents per year is 227. The highest number of reported fires - 307 took place in 2003, and the least - 112 in 2013. The data has a decreasing trend.
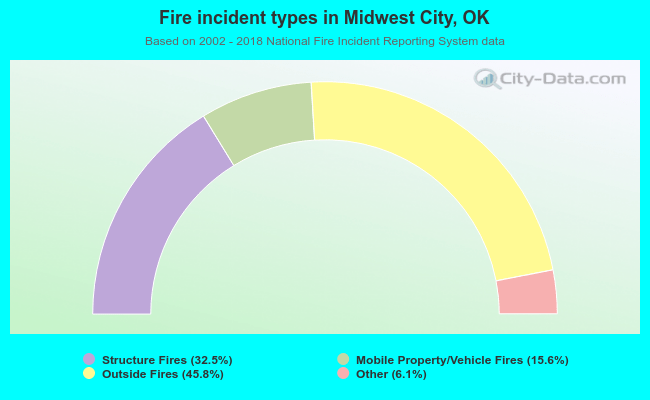 When looking into fire subcategories, the most incidents belonged to: Outside Fires (45.8%), and Structure Fires (32.5%).